Journal of Scientific & Industrial Research
36 Vol. 68, January 2009, pp. 36-43
J SCI IND RES VOL 68 JANUARY 2009
Optimization of process parameters for friction stir welding of cast aluminium alloy A319 by Taguchi method M Jayaraman1*, R Sivasubramanian2, V Balasubramanian3 and A K Lakshminarayanan3 1
Department of Mechatronics Engineering, Kongu Engineering College, Perundurai, Erode 638 052, India Department of Mechanical Engineering, Coimbatore Institute of Technology, Coimbatore 641 014, India
2
3
Centre for Materials Joining & Research (CEMAJOR), Department of Manufacturing Engineering, Annamalai University, Annamalai Nagar 608 002, India Received 18 April 2008; revised 24 October 2008; accepted 03 November 2008
In order to improve strength of welded joints in fusion welding of cast Al alloys, friction stir welding (FSW) technique may be employed to eliminate porosity, micro-fissuring, hot cracking etc. This paper discusses use of taguchi experimental design technique for maximizing tensile strength of friction stir welded cast aluminium alloy A319. Using ANOVA and signal to noise ratio of robust design, effect on tensile strength of FSW process parameters (tool rotation speed, welding speed and axial force) is evaluated and optimum welding condition for maximizing tensile strength is determined. In order to correlate process parameters and measured tensile strength, a mathematical model has been developed by nonlinear regression analysis. Keywords: Cast aluminium alloy, Friction stir welding, Nonlinear regression, Taguchi method, Tensile strength
Introduction Friction stir welding (FSW) technique1 has high joining speed, autogenous welding, improved metallurgical properties and reduced need for human skill, in comparison with conventional fusion welding methods2,3. Formation of friction stir processing zone is affected by material flow behaviour under the action of rotating tool. However, material flow behaviour is predominantly influenced by tool rotation speed, welding speed and axial force3-8. Taguchi techniques have been used widely for product or process on determining parameters and their performance measure with minimum variation 9 , and also applied for optimization in materials processing10-15. It appears that optimization of FSW process parameters of aluminium alloy A319 a cast alloy of Al-Si-Cu, used in food, chemical, marine, electrical and automotive industries, has not been reported by using Taguchi method. This paper, by using full factorial experimental design (33) with Taguchi’s robust design concept, analyses effect of tool rotation speed, welding speed and axial force for optimum tensile strength (TS) of friction stir welded joints of A319 alloy. *Author for correspondence Tel: 04294-226725(O) E-mail:
[email protected]
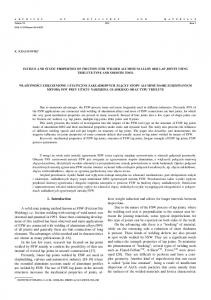
Experimental Work From reported7,8,16 primary and secondary process parameters (Fig. 1), three primary process parameters [tool rotation speed (N), welding speed (S) and axial force (F)], which contribute to heat input and subsequently influence TS variations in friction stir welded aluminium alloy joints, were selected for this study.
Determination of Working Limits of Parameters
A large number of trial runs were carried out using cast plates of A319 alloy (6 mm thick) to find out feasible working limits of FSW process parameters. Chemical composition of A319 alloy is as follows: Si, 5.9; Cu, 3.4; Fe, 0.8; Mn, 0.31; Zn, 0.40; Mg, 0.12; Ti, 0.13; Al, 88.94 % (wt basis). Working range of each parameter was decided upon by inspecting macrostructure (cross section of weld region) for a smooth appearance without any visible defects (tunnel defect, pinhole, crack, etc.). From above inspection, following observations have been made: I) When tool rotation speed was lower than 1000 rpm, tunnel defect was at the middle of retreating side of weld region observed (Fig. 2a), may be due to insufficient heat generation and insufficient metal transportation. When tool rotation speed was higher than 1400 rpm,
JAYARAMAN et al: FRICTION STIR WELDING OF CAST ALUMINIUM ALLOY A319 BY TAGUCHI METHOD
37
Fig. 1—Cause and effect diagram of factors influencing friction stir welded (FSW) joint strength
(a) 900 rpm
(b) 1500 rpm
(c) 15 mm/min
(d) 100 mm/min
(e) 1 kN
(f) 5 kN
Fig. 2—Macrostructure of FSW joints
piping defect was observed at the top of retreating side (Fig. 2b), may be due to excess turbulence caused by higher tool rotation speed; II) When welding speed was lower than 22 mm/min, tunnel defect was observed at retreating side (Fig. 2c) due to excess heat input per unit length of weld. When welding speed was higher than 75 mm/min, tunnel at retreating side and middle of weld region was observed (Fig. 2d) due to inadequate flow of material caused by insufficient heat input; III) When axial force was lower than 2 kN, pin hole defect at retreating side was observed (Fig. 2e) due to absence of vertical flow of material caused by insufficient downward force.
When axial force was increased beyond 4 kN, it resulted in tunnel defect at both sides of retreating and advancing and excessive thinning (Fig. 2f) due to higher heat input. Therefore, full factorial experimental design (33) with tool rotation speed, welding speed and axial force at three levels are chosen (Table 1). Conducting Experiments
Commercial A319 aluminium alloy was made into cast rectangular plates (175 mm X 75 mm X 6 mm). Square butt joint configuration was prepared to fabricate FSW
38
J SCI IND RES VOL 68 JANUARY 2009
a)
b)
Fig. 3—Joint configuration and tensile specimen dimensions: a) Scheme of welding and extraction of tensile specimens; b) Dimensions of flat tensile specimen
Table 1—Process parameters with their range and values at three levels Process parameters
Range
Level 1
Level 2
Level 3
Tool rotation speed (N), rpm Welding speed (S), mm/min Axial force (F), kN
1000-1400 22-75 2-4
1000 22 2
1200 40 3
1400 75 4
joints. A non-consumable, rotating tool, made of high carbon steel, was used to fabricate FSW joints. An indigenously designed and developed machine (15 hp; 3000 rpm; 25 kN) was used to fabricate joints. Welded joints were sliced (Fig. 3a) in traverse direction using a power hacksaw and tensile specimens were prepared to required dimensions as per ASTM E8M-04 (Fig. 3b). Three tensile specimens were prepared from each joint to evaluate transverse TS. Tensile test was
carried out in 100 kN, servo controlled Universal Testing Machine (Make: FIE-Bluestar, India; Model: UNITEK94100) and average of three results is presented (Table 2). Results and Discussion Analysis of Variance (ANOVA)
In order to assess influence of factors on response, means and signal-to-noise ratios (S/N) for each control
JAYARAMAN et al: FRICTION STIR WELDING OF CAST ALUMINIUM ALLOY A319 BY TAGUCHI METHOD
39
Table 2—Experimental values of tensile strength (mean) and S/N ratio Test
1 2 3 4 5 6 7 8 9 10 11 12 13 14 15 16 17 18 19 20 21 22 23 24 25 26 27
N rpm
1000 1000 1000 1000 1000 1000 1000 1000 1000 1200 1200 1200 1200 1200 1200 1200 1200 1200 1400 1400 1400 1400 1400 1400 1400 1400 1400
S mm/min
22 22 22 40 40 40 75 75 75 22 22 22 40 40 40 75 75 75 22 22 22 40 40 40 75 75 75
F kN
2 3 4 2 3 4 2 3 4 2 3 4 2 3 4 2 3 4 2 3 4 2 3 4 2 3 4
Specimen 1
Tensile strength MPa Specimen Specimen 2 3
113 111 119 120 129 132 117 120 123 120 125 131 137 143 153 123 128 132 108 109 113 114 121 128 106 114 110
109 114 118 124 129 131 116 120 128 121 126 131 140 138 149 123 129 131 104 110 112 113 121 130 110 112 110
factor are to be calculated17. Signals are indicators of effect on average responses and noises are measures of deviations from experiment output. Appropriate S/N ratio must be chosen using previous knowledge, expertise, and understanding of the process18. In this study, S/N ratio was chosen according to criterion, larger-the-better, in order to maximize response. In Taguchi method, S/N ratio is used to determine deviation of quality characteristics from desired value. S/N ratio (ηj) in jth experiment can be expressed as
108 117 117 122 126 133 116 121 127 122 124 129 137 142 151 126 130 134 106 109 108 110 119 127 108 116 109
S/N ratio dB Average
110 114 118 122 128 132 116 120 126 121 125 130 138 141 151 124 129 132 106 109 111 112 120 128 108 114 110
40.827 41.138 41.437 41.727 42.144 42.411 41.289 41.583 42.007 41.655 41.938 42.278 42.797 42.984 43.579 41.868 42.211 42.411 40.506 40.748 40.906 40.894 41.583 42.144 40.668 41.138 40.827
effect of FSW process parameters. Experimental results were transformed into means and S/N ratio (Table.2). Analysis of variance (ANOVA) has been performed to identify statistically significant process parameters, which affect TS of FSW joints (Table 3). Results of ANOVA indicate that selected process parameters are highly significant factors affecting TS of FSW joints. Effects of interaction between process parameters are not significant. Optimizing Tensile Strength
1 η j = −10 log ∑ (1 / Yijk2 ) n
…(1)
where n is number of tests and Yijk is experimental value of ith quality characteristics in jth experiment at kth test. In present study, TS data was analyzed to determine the
Analysis of mean for each of experiments gives better combination of parameter levels. Mean response refers to average value of performance characteristics for each parameter at different levels. Mean for one level was calculated as average of all responses that were obtained with that level. Mean response of raw data and S/N ratio of TS for each parameter at level 1, 2 and 3 were
40
J SCI IND RES VOL 68 JANUARY 2009
Source
N S F N*S N*F S*F Error Total
S/N ratio
Table 3—ANOVA for tensile strength (S/N ratio and means) V SS’ P% Means S/N Means S/N Means S/N ratio Means ratio ratio
8.37 4.682 1.8 0.239 0.051 0.164 0.216 15.526
1688.063 972.527 364.953 71.701 12.59 42.812 38.312 3190.962
DF
2 2 2 4 4 4 8 26
SS
4.185 2.341 0.9 0.119 0.025 0.082
844.031 486.263 182.476 35.85 6.295 21.405
8.316 4.628 1.745 0.166 0 0.069
1678.484 962.948 355.375 55.391 0 23.655
53.559 29.806 11.244 1.071 0 0.449 3.381 100.00
52.601 30.177 11.136 1.735 0 0.74 3.611 100.00
DF= Degree of freedom, SS=Sum of squares, V=Variance, SS’=Pure sum of squares, P%= Percentage contribution
Table 4—Main effects of tensile strength (means and S/N ratio) Mean
Source
N S F NS NF SF
S/N ratio
Level-1
Level-2
Level3
Delta (L2-L1)
Level-1
Level-2
Level3
Delta (L2-L1)
120.666 116.0 117.444 122.666 121.333 123.444
132.333 130.222 122.222 121.444 122.333 120.888
113.111 119.888 126.444 122.0 122.444 121.777
11.667 14.222 4.777 -1.222 1.0 -2.556
41.618 41.27 41.369 41.711 41.731 41.784
42.413 42.261 41.718 41.659 41.674 41.62
41.056 41.556 42.0 41.718 41.683 41.684
0.794 0.99 0.349 -0.052 -0.058 -0.165
calculated (Table.3). Analyzing means and S/N ratio of various process parameters (Table.4), it is observed that a larger S/N ratio corresponds to better quality characteristics. Therefore, optimal level of process parameter is the level of highest S/N ratio19. Mean effect (Fig. 4) and S/N ratio (Fig. 5) for TS calculated by statistical software20 indicated that TS was at maximum when: N (level 2), 1200 rpm; S (level 2), 40 mm/min; and F (level 3), 4 kN. Interpretation of Results Percentage of Contribution (P%)
P% is the portion of total variation observed in the experiment attributed to each significant factors and / or reflected interaction (Fig. 6). P%, a function of sum of squares for each significant item, indicates relative power of a factor to reduce the variation. If factor levels were controlled precisely, then total variation could be reduced by the amount indicated by P%. Estimation of Optimum Performance Characteristics
Optimum value of TS was predicted at selected levels of significant levels of significant parameters. Significant
process parameters and their optimum levels have already been selected as N2, S2 and F3 (Table. 4). Estimated mean of response characteristics (TS) can be computed21,22 as −
−
−
−
Tensile strength(TS ) = N 2 + S 2 + F3 − 2 T −
…(2)
−
where, T , overall mean of TS; N 1 , average TS at second − level of tool rotation speed 1200 rpm; S 2 , average TS − at second level of welding speed 40 mm/min; F3 , average TS at third level of axial force 4 kN (Table 4). Substituting values of various terms in Eq. (2), TS = 132.33 + 130.22 + 126.44 – 2 X 122.04 = 144.91 MPa Confirmation Test
Confirmation experiments were conducted at optimum setting of process parameters. N2, S2 and F3 were set and average TS of FSW A319 alloy was found to be 147 MPa, which was within confidence interval of predicted optimal TS. Macro- and microstructures of traverse section of FSW joint at optimum parameters (Fig. 7) reveals that there is no defect due to sufficient heat generation and also it is found that coarse Si particles in
JAYARAMAN et al: FRICTION STIR WELDING OF CAST ALUMINIUM ALLOY A319 BY TAGUCHI METHOD
41
Tensile strength, MPA
135 130 125 120 115 110 1000 1200 1400
22
40
75
2
3
4
Tool rotation speed, rpm Welding speed, mm/min Axial force, kN Fig. 4—Response graph (means) of tensile strength
Tensile strength, MPA
43 42.5
42 41.5
41 40.5 1000 1200 1400 Tool rotation speed, rpm
22 40 75 Welding speed, mm/min
2 3 4 Axial force, kN
Fig. 5—Response graph (S/N ratio) of tensile strength
base metal are fragmented into finer size and distributed uniformly in Al matrix due to optimum stirring during FSW. Regression Model
In order to correlate process parameters and TS of welded joints, a nonlinear regression model was developed to predict TS of FSW A319 alloy based on experimentally measured TS. Regression coefficients were calculated using statistical software, MINITAB 15.0. After determining significant coefficients (at 95% confidence level), final model developed using only these coefficients to estimate TS as
TS = { 139.4 – 4.30 (N) +1.90 (S) + 3.80 (F) - 1.625 (NS) - 1.375(NF) + 0.125 (SF) – 16.5 N2 - 13.5 S2 + 4.0 F2} Adequacy of model was tested by using ANOVA. All terms including N, S, F, NS, N2, S2 and F2 were found to be significant at 95% confidence interval. The determination coefficient (R2) indicates goodness of fit for the model. In this case, R2 (0.985953) indicates that only < 1% of total variations are not explained by the model. The value of adjusted determination coefficient (adjusted R2 =0.97331) is also high, which indicates a high significance of the model. Predicted R2 is also made a good agreement with the adjusted R2.
42
J SCI IND RES VOL 68 JANUARY 2009
F 11.14%
S*F 0.74% N*S 1.74%
E 3.61%
N 52.60% S 30.18%
Fig. 6—Percentage contribution of factors (means) and their interactions
a)
a
b
a
a
b
20µm
20µm
Fig. 7—Macrostructure and microstructures of different regions of FSW joint at optimum parameters: (a) Base metal (BM); b) Stir zone (SZ)
Conclusions TS of FSW Al alloy A319 has been evaluated under different processing conditions using 33 full factorial experimental design. Tool rotation speed has been found dominant parameter for TS followed by welding speed. Axial force shows minimal effect on TS compared to other parameters. A maximum TS (147 Mpa) exhibited by FSW joints with optimal process parameters (tool rotation speed, 1200 rpm; welding speed, 40 mm/min; and axial force, 4 kN) shows a reasonable agreement with experimental value. A nonlinear regression model, developed to correlate TS, has been found to be useful in predicting TS. However, contribution of nonlinear terms in regression model is insignificant. Thus linear
regression analysis model may employ successfully for designing process parameters of FSW A319 alloy. Acknowledgements Authors are grateful to Department of Manufacturing Engineering, Annamalai University, Annamalainagar, Tamil Nadu, India for extending facilities of Metal Joining Laboratory and Materials Testing Laboratory to carryout this investigation. References 1
Abbacy G M, Kokabi A H, Daneshi G H, Shalchi B & Sarrafi R ,The influence of the ratio of “rotational speed/traverse speed” (ω/v) on mechanical properties of AZ31 friction stir welds, Int J Mach Tools & Manuf, 46 (2006) 1983-1987.
JAYARAMAN et al: FRICTION STIR WELDING OF CAST ALUMINIUM ALLOY A319 BY TAGUCHI METHOD
2
3
4
5
6
7
8
9
10
11
Amirizad M, Kokabi A H, Abbasi G M et al, Evaluation of microstructure and mechanical properties in friction stir welded A356+15% SiCp cast composite, Mater Lett, 40 (2006) 565568. Rodriguez N A, Almanza E & Alvarez C J, Study of friction stir welded A319 and A413 aluminum casting alloys, J Mater Sci, 40 (2005) 4307-4312. Liu H J, Fuji H, Maeda M & Nogi K, Mechanical properties of friction stir welded joints of 1050-H 24 aluminium alloy, Sci Tech Weld Join, 8 (2003) 450-454. Barcellona A, Buffa G, Fratini L & Palmeri D, On microstructural phenomena occurring in friction stir welding of aluminium alloys, Mater proc Tech (in press). Kim Y G, Fujii H, Tsumura T, Komazaki T & Nakata K, Three defect types in friction stir welding of aluminum die casting alloy, Mater Sci Eng A, 415 (2006) 250-254. Elangovan K & Balasubramanian V, Influences of pin profile and rotationalspeed of the tool on the formation of friction stir processing zone in AA2219 aluminium alloy, J Mater Sci Eng A, 459 (2007) 7-18. Elangovan K & Balasubramanian V, Effect of tool pin profile and axial force on the formation of friction stir processing zone in AA6061 aluminium alloy, Int J Adv Manuf Tech, (in press). Ersan A, Necip C C & Burak B R, Design optimization of cutting parameters when turning hardened AISI 4140 steel (63 HRC) with Al2O3 + TiCN mixed ceramic tool, Mater Design, 28 (2007) 1618-1622. Lin T R, Experimental design and performance analysis of TiN coated carbide tool in face milling stainless steel, J Mate Proc Tech, 127 (2002) 1-7. Davim J P, Design optimization of cutting parameters for turning metal matrix composites based on the orthogonal arrays, J Mater Proc Tech, 132 (2003) 340.
12
43
Ghani J A, Choudhury, I A & Hassan H H, Application of Taguchi method in the optimization of end milling operations, J Mater Proc Tech, 145 (2004) 84-92. 13 Palanikumar K, Application of Taguchi and response surface methodologies for surface roughness in machining glass fiber reinforced plastics by PCD tooling, Int J Adv Manuf Tech (in press). 14 Paulo D J, A note on the determination of optimal cutting condition for surface finish obtained in turning using design of experiments, J Mater Proc Tech, 116 (2001) 305-308. 15 Paulo D J, Study of drilling metal-matrix composites based on the Taquchi techniques, J Mater Proc Tech, 132 (2003) 250-254. 16 Won B L, Mechanical properties related to microstructural variation of 6061 Al alloy joints by friction stir welding, Mater Trans, 45 (2004) 1700-1705. 17 Elango V & Karunamoorthy L, Effect of lighting conditions in the study of surface roughness by machine vision - an experimental design approach, Int J Adv Manuf Tech (in press). 18 Phadke M S, Quality Engineering Using Robust Design (Prentice Hall, Englewood cliffs, NJ, USA), 1989. 19 Sharma P, Verma A, Sidhu, R K & Panday O P, Process parameter selection for strontium ferrite sintered magnets using Taguchi L9 orthogonal design, J Mater Proc Tech, 168 (2005) 147-151. 20 MINITABTM Statistical software Release 15. 21 Mahapatra S S & Patnaik A, Optimization of wire electrical discharge machining (WEDM) process parameters using Taguchi method, Int J Adv Manu Tech (in press). 22 Ross P J, Taguchi Techniques for Quality Engineering (McGraw- Hill, NewYork) 1996.