International Journal of Engineering & Technology, 7 (1.1) (2018) 138-142
International Journal of Engineering & Technology Website: www.sciencepubco.com/index.php/IJET Research paper
Optimization of process parameters on commercial mild steel using taguchi technique V. Jaiganesh 1*, B. Yokesh Kumar 2, P. Sevvel 3, A.J. Balaji 4 1Professor,
Department of Mechanical Engineering, S.A. Engineering College, Thiruverkadu, Chennai, India Professor, Department of Mechanical Engineering, S.A. Engineering College, Thiruverkadu, Chennai, India 3Professor, Department of Mechanical Engineering, S.A. Engineering College, Thiruverkadu, Chennai, India 4UG Scholar, Department of Mechanical Engineering, S.A. Engineering College, Thiruverkadu, Chennai, India *Corresponding author E-mail:
[email protected]
2Assistant
Abstract In the present scenario of bulk manufacturing where Metal Removal Rate (MRR), Chip Thickness Ratio (CTR) and Surface Roughness (SR) is of significant importance in manufacturing the component using CNC (computer numerical controlled) machines. Nine experiments were conducted based on orthogonal array. General linear model has been generated for all the three output parameters such as (MRR, Chip Thickness Ratio surface roughness) versus input parameters (speed, time, depth of cut). The statistical method called the analysis of variance (ANOVA) is applied to find the critical factor. The Main effects of S/N ratio values are found and plotted in the form of graph. The optimized value is found for speed, time, and depth of cut by using “MINITAB” software. By using this optimized value the efficient metal cutting can be done in commercial mild steel. Keywords: MRR (Metal Removal Rate), DOC (Depth of Cut), Orthogonal Array (OA), Chip Thickness Ratio (CTR), Surface Roughness (SR).
1.
Introduction
At present, for the industries the main objective is to manufacture a component at low cost, with all the essential qualities in minimum period of time [1–3]. Commonly used operation to perform cutting and finishing processes is turning. In turning operation parameters such as materials, the DOC, feed, cutting speed and the use of cutting fluids will directly affect the material’s metal removal rate and surface roughness of the material [4–7]. In this paper our main objective is to find the optimized values for Metal Removal Rate, surface roughness and Chip Thickness Ratio using Taguchi method. Feng and Wang [8] investigated the influence on surface roughness in finish turning operation by developing an empirical model through considering exogenous variables: work piece hardness (material), feed, cutting tool point angle, depth of cut, spindle speed, and cutting time and they have found the optimized vales of process parameters. Taguchi found a method for the selection of the most optimal solution (i.e. Metal Removal Rate, Chip Thickness Ratio, surface roughness) for set of input parameters (i.e. cutting speed, time and depth of cut) with a reduced cost and increased quality [9–11]. The optimal solution so obtained is least affected by any outside disturbances like the noise or any other environmental condition. The present day approach to find the optimum output value over input value can be easily made out by the use of Taguchi’s method than using any other traditional methods. This method has a wide scope of use in the agricultural field, medical field and various fields of Engineering. This method has been used by many agricultural scientists to evaluate the production of their crops based on the different sets of inputs like the rain fall, fertility and other agricultural parameters. This method is also used by metrology department in forecasting the different types of climatic
conditions [12–15]. This method is specifically used in the Engineering problems, for obtaining optimal results based on the different types of input. So, the Taguchi method of finding the optimized value has a wide range of applications in the different fields because of its easiness and optimized results. Additionally, the ANOVA (analysis of variance) is also used to find the most significant factors for the turning operation such as the MRR, Chip Thickness Ratio and surface roughness are simultaneously considered. Better surface roughness is obtained at lower rates of feed and the high cutting speed [16–19]. A group of researchers including Ozel and Karpat [20] have found that cutting parameters (Feed, Speed, DOC, and tool geometry and material properties of tool) directly influence the surface finish of components.
2.
Experimental details
Turning operation is done using a single point cutting tool. It is one of the oldest and popular methods of metal cutting. It has even replaced grinding in several applications with reduced lead time without affecting the surface quality [21–24]. In this investigation; the experiments were carried out on a rigid CNC machine with spindle speed of 2500rpm. Nine experiments are conducted by considering three different speeds, three different depth of cut and three different time interval for machining operation. Another cutting parameter is taken as feed of 0.2 mm\revolution as a constant factor. The tool used in CNC for our experiment is carbide tipped general purpose tool. The turning operation is carried out for 20mm length in mild steel cylindrical rod. Fig 1 shows the image of machined work piece which was done during the experiment.
Copyright © 2018 Authors. This is an open access article distributed under the Creative Commons Attribution License, which permits unrestricted use, distribution, and reproduction in any medium, provided the original work is properly cited.
International Journal of Engineering & Technology
139
Fig. 1: Machined work piece Table 1: L9 Orthogonal Array EXPERIMENTS
A
B
C
SPEED
TIME
DOC
SURFACE ROUGHNESS
CHIP THICKNESS RATIO
MRR
1 2 3 4 5 6 7 8 9
1 1 1 2 2 2 3 3 3
1 2 3 1 2 3 1 2 3
1 2 3 2 3 1 3 1 2
2000 2000 2000 1500 1500 1500 900 900 900
8 8.2 8.3 8 8.2 8.3 8 8.2 8.3
1 1.3 1.5 1 1.3 1.5 1 1.3 1.5
0.86 0.02 1.5 1.6 0.42 0.47 0.38 6.18 2.72
1.08 1.12 1.15 1.09 1.1 1.14 1.09 1.13 1.15
30 38.05 43.37 30 34.67 45 21.81 28.36 30
Table 1 shows the experiments which were conducted and the corresponding values of speed; time and Depth of Cut were obtained. After that the output parameters were obtained and they were tabulated. 2.1. Generation of general linear model by using ANOVA The first model is generated between Surface Roughness versus speed, time, Depth of Cut. Table 2 explains about the type of the factor whether it is fixed or not fixed and with their levels and with their values. Table 2: Types and Levels Factor Speed Time DOC
Type Fixed Fixed Fixed
Levels 3 3 3
Values 900 8.0 1.0
Table 4: T-value and P-value TERM
COEFFICIENT
1500 8.2 1.3
2000 8.3 1.5
Analysis of variance (ANOVA) is used to analyze the experimental results and identifying the factor which has significant effect on machining variable. Analysis of variance (ANOVA) technique was used to find the variables affecting the width[1]. The Table 3 shows p value or probability value shows the level of significance of each factor and the f-value is statistical value.
CONSTANT SPEED 900 1500 TIME 8.0 8.2 DOC 1.0 1.3
ADJ.SS 10.414 2.382 4.595 12.045 29.436
ADJ MS 5.207 1.191 2.297 6.022
1.52 -0.74
1.16 1.16
1.31 -0.64
0.319 0.587
1.33 1.33
-0.63 0.63
1.16 1.16
-0.54 0.55
0.643 0.638
1.33 1.33
0.93 -0.13
1.16 1.16
0.80 -0.11
0.505 0.923
1.33 1.33
Taguchi found three different types of quality characteristics they are smaller is better, nominal is better and larger is better. In Taguchi method an orthogonal array is employed to reduce the number of experiments for determining the optimal machining process parameters [25]. The given below table 6 gives the level of speed, time, DOC. (S/N)=-10 log[∑y12/n] [4] Whereas, Y1= average response n= number of observations 2.5. Response table for signal to noise ratios Smaller is better is chosen for obtaining the optimized values.
Table 3: ANOVA DF 2 2 2 2 2
PVALUE 0.195
2.4. Taguchi analysis: surface roughness versus speed, time, DOC
2.2. Analysis of variance
SOURCE SPEED TIME DOC ERROR TOTAL
TVALUE 1.92
VIF
1.572
SE COEFFICIENT 0.818
Table 5: Average Effect Response for S/N Ratio F-VALUE 0.86 0.2 0.38
P-VALUE 0.536 0.835 0.724
2.3. Coefficient This Table 4 gives the details about the statistical findings such as t-value, p-value.
LEVEL 1 2 3 DELTA RANK
SPEED -5.369 3.337 10.589 15.958 1
TIME 1.877 8.565 -1.855 10.450 2
DOC -2.651 7.069 4.139 9.719 3
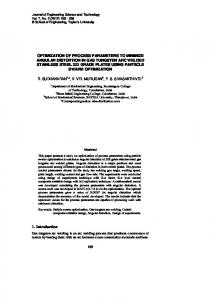
From the Fig 2 it is clearly seen that 900rpm speed, 8.3 seconds time and 1.0mm depth of cut are the optimum values to achieve good surface roughness. Rajakumar and Jaiganesh work emphasizes on the optimization of various parameters that influence the surface roughness, flank wear, chip packing ratio
140
International Journal of Engineering & Technology
and build-up-edge through technique in milling [26–30].
investigation
using
Taguchi’s
characteristics, a higher S/N ratio always corresponds to a better performance [10]. 3.5. Response table for signal to noise ratios Smaller is better is chosen for obtaining the optimized values Table 9: Average Effect Response for S/N Ratio LEVEL 1 2 3 DELTA RANK
SPEED -1.0080 -0.9048 -0.9556 0.1032 2
TIME -0.7218 -0.9579 -1.1887 0.4668 1
DOC -0.9560 -0.9823 -0.9301 0.0522 3
From the graph it is clearly shown that 900 rpm speed,8.3 seconds and 1.3mm depth of cut is the optimized value to achieve good Chip Thickness Ratio.
Fig. 2: Main effects plots for S/N ratio
3.1. Generation of general linear model The second model is generated between Chip Thickness Ratio versus speed, time, DOC. Table 6 explains about the type of the factor whether it is fixed or not fixed and with their levels. Table 6: Type and Levels factor Speed Time DOC
Type Fixed Fixed Fixed
Levels 3 3 3
Values 900 8.0 1.0
1500 8.2 1.3
2000 8.3 1.5
3.2. Analysis of variance Analysis of variance (ANOVA) is used to analyze the experimental results and identifying the factor which has significant effect on machining variable. ANOVA was employed for identifying the level of importance of the machining parameters on the multi-performance characteristics[2]. The p value or probability value shows the level of significance of each factor. The f value is statistical value
Fig. 3: Main effects plot for S/N ratio
4.1. Generation of general linear model The third model is generated between metal removal rate versus speed, time, DOC. Table 10explains about the type of the factor whether it is fixed or not fixed and with their levels.
Table 7: ANOVA SOURCE SPEED TIME DOC ERROR TOTAL
DF 2 2 2 2 2
ADJ.SS 0.000267 0.005400 0.000067 0.000267 0.006000
ADJ MS 0.000133 0.002700 0.000033 0.000133
Table 10: Type and Levels F-VALUE 1.00 20.25 0.25
P-VALUE 0.500 0.047 0.800
This Table 8 gives the details about the statistical findings such as t-value, p-value. Table 8: T-value and P-value COEFFICIENT
CONSTANT SPEED 900 1500 TIME 8.0 8.2 DOC 1.0 1.3
type Fixed Fixed fixed
levels 3 3 3
Values 900 8.0 1.0
1500 8.2 1.3
2000 8.3 1.5
4.2. Analysis of variance table
3.3. Coefficient
TERM
factor Speed Time DOC
TVALUE 290.12
PVALUE 0.000
VIF
1.11667
SE COEFFICIENT 0.00385
0.00667 -0.00667
0.00544 0.00544
1.22 -1.22
0.345 0.345
1.33 1.33
-0.03000 0.00000
0.00544 0.00544
-5.51 0.00
0.031 1.000
1.33 1.33
-0.00000 0.00333
0.00544 0.00544
1.000 0.603
1.000 0.603
1.33 1.33
Analysis of variance (ANOVA) is used to analyze the experimental results and identifying the factor which has significant effect on machining variable. The p value or probability value shows the level of significance of each factor. The f value is statistical value. Table 11: ANOVA SOURCE SPEED TIME DOC ERROR TOTAL
DF 2 2 2 2 2
ADJ.SS 205.54 222.990 4.862 18.164 451.558
ADJ MS 102.771 111.495 2.431 9.082
F-VALUE 11.32 12.28 0.27
P-VALUE 0.081 0.075 0.789
4.3. Coefficient 3.4. Taguchi analysis: chip thickness ratio versus speed, Time, DOC Taguchi found three different types of quality characteristics they are smaller is better, nominal is better and larger is better. The given below table gives the level of speed, time, DOC. It is well known that disregarding of the category of the performance
The table12 gives the details about the statistical findings such as t-value, p-value.
International Journal of Engineering & Technology
141
Table 12: T-value and P-value TERM
COEFFICIENT
CONSTANT SPEED 900 1500 TIME 8.0 8.2 DOC 1.0 1.3
References
TVALUE 33.32
PVALUE 0.001
VIF
33.47
SE COEFFICIENT 1.00
-6.75 3.08
1.42 1.42
-4.75 2.17
0.042 0.162
1.33 1.33
-6.20 0.22
1.42 1.42
-4.37 0.15
0.049 0.891
1.33 1.33
0.98 -0.79
1.42 1.42
0.69 -0.56
0.562 0.634
1.33 1.33
[1]
4.4. Taguchi analysis: metal Removal rate versus speed, time, DOC
[2]
[3]
[4]
Taguchi found three different types of quality characteristics they are smaller is better, nominal is better and larger is better. The given below table gives the level of speed, time, DOC. 4.5. Response table for signal to noise ratios
[5]
[6]
Smaller is better is chosen for obtaining the optimized values Table 13: Average Effect response for S/N Ratio LEVEL 1 2 3 DELTA RANK
SPEED 28.46 31.14 31.30 2.84 2
TIME 28.62 30.49 31.78 3.16 1
DOC 30.55 3.023 30.11 0.45 3
From the Fig 4 it is clearly shown that 2000 rpm speed, 8.3 seconds and 1mm depth of cut is the optimized value to achieve good Chip Thickness Ratio.
[7]
[8]
[9]
[10]
[11]
[12]
[13] Fig. 4: Main effects plot for S/N ratio
3.
[14]
Conclusion
In this experimental study, the optimization of metal cutting parameters for multiple responses such as MRR, Chip Thickness Ratio and surface roughness were found by using Taguchi approach. The input parameters influence the output parameters at significant rate, by controlling the input parameters the desired output parameters can be obtained. The results are plotted in the form of graphs and response tables. The optimum values to achieve better surface roughness are 900rpm speed, 8.3 seconds and 1mm depth of cut. The optimum values to achieve better Chip Thickness Ratio are 900rpm, 8.3 seconds and 1.3mm depth of cut. The optimum values to achieve better Metal Removal Rate are 2000rpm, 8.3 seconds and 1mm depth of cut. There will be a conflict between the optimum values of Chip Thickness Ratio and Metal Removal Rate, because they are directly proportional to each other. So this study clearly gives separate optimum values for both Chip Thickness Ratio and Metal Removal Rate.The experimental findings, is used in machinery parts manufacturing, and pipe line industries.
[15]
[16]
[17]
[18]
[19]
[20]
Liu D, Xin R, Sun L, Zhou Z & Liu Q, “Influence of sampling design on tensile properties and fracture behavior of friction stir welded magnesium alloys”, Materials Science & Engineering A, Vol.576, (2013), pp.207-216. Sevvel P & Jaiganesh V, “Effect of Tool Shoulder Diameter to Plate Thickness Ratio on Mechanical Properties and Nugget Zone Characteristics During FSW of Dissimilar Mg Alloys”, Transactions of the Indian Institute of Metals, Vol.68, No.S1, (2015), pp.41–46. Sutton MA, Reynolds AP, Yang B & Taylor R, “Mode I fracture and microstructure for 2024-T3 friction stir welds”, Materials Science and Engineering A, Vol.A354, (2003), pp.6-16. Sevvel P & Jaiganesh V, “Impact of process parameters during friction stir welding of AZ80A Mg alloy”, Science and Technology of Welding and Joining, Vol.21, (2016), pp.83–90. Aghion E, Bronfin B & Eliezer D, “The role of the magnesium industry in protecting the environment”, Journal of Material Processing Technology, Vol.117, (2001), pp.381–385. Sevvel P & Jaiganesh V, “Improving the mechanical properties of friction stir welded AZ31B magnesium alloy flat plates through axial force investigation”, Applied Mechanics and Materials, Vol.591, (2014), pp.11–14. Cao X & Jahazi M, “Effect of tool rotational speed and probe length on lap joint quality of a friction stir welded magnesium alloy”, Materials & Design, Vol.32, (2011), pp.1–11. Feng CX & Wang X, “Development of empirical model for surface roughness prediction in finish turning”, International Journal of Advanced Manufacturing Technology, Vol.20, (2002), pp.348-356. Jaiganesh V & Sevvel P, “Effect of Process Parameters on the Microstructural Characteristics and Mechanical Properties of AZ80A Mg Alloy during Friction Stir Welding”, Transactions of the Indian Institute of Metals, Vol.68, (2015), pp.99–104. Sevvel P & Jaiganesh V, “Investigation on evolution of microstructures and characterization during FSW of AZ80A Mg alloy”, Archives of Metallurgy and Materials, Vol.62, No.3, (2017), pp.1779-1785. Stephan Thangaiah IS, Sevvel P, Satheesh C, Manova Raja Singh S & Jaiganesh V, “Numerical and Statistical Analysis for Betterment of Mechanical Properties During FSW of AZ31B Mg Alloys”, International Journal of Pure and Applied Mathematics, Vol.117, No. 7, (2017), pp.359-369. Ramulu PJ, Narayanan RG, Kailas SV & Reddy J, “Internal defect and process parameter analysis during friction stir welding of Al 6061 sheets”, International Journal of Advanced Manufacturing Technology, Vol.65, (2013), pp.1515-1528. Sevvel P & Jaiganesh V, “Impact of Tool Profile on Mechanical Properties of AZ31B Mg Alloy during FSW Using Optimized Parameters”, FME Transactions, Vol.44, (2016), pp.43–49. Mehmet Erdem, “Investigation of structure and mechanical properties of copper-brass plates joined by friction stir welding”, International Journal of Advanced Manufacturing Technology, Vol.76, No.9, (2015), pp.1583–1592. Sevvel P & Jaiganesh V, “Effects of axial force on the mechanical properties of AZ80A Mg alloy during friction stir welding”, Materials Today Proceedings, Vol.4, No.2, Part A, (2017), pp. 1312–1320. Ramanujam R, Venkatesan K, Saxena V, Pandey R, Harsha T & Kumar G, “Optimization of Machining Parameters Using Fuzzy Based Principal Component Analysis during dry turning operation of Inconel 625–A hybrid approach”, Procedia Engineering,Vol.97, (2014), pp.668-676. Zeng R, Dietzel W, Zettler R, Chen J & Kainer KU, “Microstructure evolution and tensile properties of friction-stirwelded AM50 magnesium alloy”, Transactions of Nonferrous Metals Society of China, Vol.18, (2008), pp.S76–S80. Sevvel P & Jaiganesh V, “A detailed investigation on the role of different tool geometry in friction stir welding of various metals & their alloys”, Proceedings of the International Colloquium on Materials, manufacturing & metrology, (2014), pp.103–107. Stephan Thangaiah IS, Sevvel P, Satheesh C & Jaiganesh V, “Investigation on the Impingement of Parameters of FSW Process on the Microstructural Evolution & Mechanical Properties of AZ80A Mg Alloy Joints”, FME Transactions, Vol.46, No.1, (2018), pp. 23–32. Ozel T & Karpat Y, “Predictive Modelling of surface roughness and Tool wear in hard turning using Regression and Neural
142
[21]
[22]
[23]
[24]
[25]
[26]
[27]
[28]
[29]
[30]
International Journal of Engineering & Technology networks”, International Journal of Machine Tools and Manufacture, Vol.45, (2005), pp.467-479. Kesharwani RK, Panda SK & Pal SK, “Multi-Objective Optimization of Friction Stir Welding Parameters for Joining of Two Dissimilar Thin Aluminum Sheets”, Procedia Materials Science, Vol.6, (2014), pp.178–187. Sevvel P & Jaiganesh V, “Influence of the arrangement of materials and microstructural analysis during FSW of AZ80A & AZ91C Mg alloys”, Archives of Metallurgy and Materials, Vol.62, No.3, (2017), pp.1795–1801. Jiang JF, Lin X, Wang Y, Qu JJ & Luo SJ, “Microstructural evolution of AZ61 magnesium alloy predeformed by ECAE during semisolid isothermal treatment”, Transactions of Nonferrous Metals Society of China, Vol.22, No.3, (2012), pp.555–563. Sevvel P & Jaiganesh V, “An detailed examination on the future prospects of friction stir welding–a green technology”, Proceedings of the International conference on advances in industrial engineering applications, Chennai, India, (2014), pp.62–63. Yu S, Chen X, Huang Z & Liu Y, “Microstructure and mechanical properties of friction stir welding of AZ31B magnesium alloy added with cerium”, Journal of Rare Earths, Vol.28, (2010), pp. 316–20. Jai Ganesh V & Rajakumar S, “Optimization of the face milling process selection parameters using desirability technique for ALSiC composites”, Journal of manufacturing Engineering, Vol.6, No.3, (2011), pp.191-194. Sevvel P, Sunil Solomon R, Mahadevan S & Shahul Hamid Khan, “Optimization of Process Parameters and Evaluation of Response Characteristics in EDM Using Taguchi and ANOVA Method – A Review”, Journal of Advanced Research in Dynamical & Control Systems, Vol.9, No.5, (2017), pp.91-100. Moghaddam MS, Parvizi R, Haddad-Sabzevar M, Davoodi A, “Microstructural and mechanical properties of friction stir welded Cu-30Zn brass alloy at various feed speeds: influence of stir bands”, Materials and Design, Vol.32, (2011), pp.2749–2755. Jaiganesh V, Satheesh C, Manova Raja Singh S, Sevvel P & Balaji AJ, “Optimization of Process Parameters on Commercial Mild Steel Using Regression and Principal Component Analysis”, International Journal of Pure and Applied Mathematics, Vol.117, No.20, (2017), pp.741-758. Jaiganesh V, Srinivasan D & Sevvel P, “Optimization of process parameters on friction stir welding of 2014 aluminum alloy plates”, International Journal of Engineering & Technology, Vol.7, (2018), pp.09–11.