Dec 15, 1999 - Several software producers developed their own formats. Exchange of the data in the same format is a simple task; integrating the data from.
Optimization of Quality of Geoinformation Products Alenka Krek and Andrew U. Frank Institute for Geoinformation, Technical University Vienna Gusshausstrasse 27-29/127, A-1040 Vienna, Austria {krek, frank}@geoinfo.tuwien.ac.at
Presented at SIRC 99 – The 11th Annual Colloquium of the Spatial Information Research Centre University of Otago, Dunedin, New Zealand December 13-15th 1999
ABSTRACT Data quality of geographic information is of importance to the user and the producer. This paper provides an economic framework in which the relation between the quality of geographic data and its value can be discussed and shows how economically optimal quality can be achieved. A number of steps are necessary to construct such a theory. We show that the concept of the Geoinformation product, which is designed to support a particular decision situation, leads to a method to assess the value of geographic information and to discuss the contribution and the cost of data quality. It is then possible to identify the economically optimal level of data quality for the product. The optimal quality of the Geoinformation product is the quality where the difference between the benefits of using the product and cost of producing it is the highest. In this paper quality has a single dimension and a continuous scale. Further research should consider multiple quality aspects.
Keywords and phrases: Geoinformation product, value, cost, data quality, optimization of data quality
1.
INTRODUCTION
The market for geographic information is not yet well developed. Users in need of geographic data are typically forced to use whatever data they can find. The organizations which collect and manage geographic data make their datasets available on a restricted market. Users and producers are concerned with data quality. Standards according to which National Mapping Agencies collect data are often widely discussed. Occasionally voices of users are heard, deploring the lack of quality of some datasets. What we are missing is a rational discussion on data quality. In practical situations argumentations, which sound reasonable, are tried: for example, the precision of data collection for a cadastre is often linked to the value of the land – this is apparently convincing, but the theoretical problems become evident quickly. This paper concentrates on the question if there is an optimal quality for a dataset and provides a framework, in which a request for improved quality can be evaluated and rational arguments for an optimal solution made. An economic approach is proposed, which shows that in most cases there is an optimal data quality. The construction requires a clarification of a few concepts:
We first introduce the concept of a Geoinformation product, which provides information for a concrete decision. The value of such a Geoinformation product can be determined as its contribution in the decision process. It is then possible to assess the contribution of data quality to the value of the Geoinformation product, but also to investigate what the cost of quality in the production is. A product which has a higher level of quality than the user needs has not more value to the user but likely more cost for the producer. We draw the approximation of the cost and benefit curve, which is unique for a specific product and its particular use. In this framework, the quality can be optimized. An optimal quality of the Geoinformation product is then the quality where the incremental cost of producing more quality equals the incremental value of the quality. Intentionally limited quality, but sufficient for a particular use (optimal quality), leads to differentiation of Geoinformation products and reduction of the production cost.
2.
GEOINFORMATION PRODUCT
Geoinformation is used to make decisions. We consider here the specific piece of geoinformation which is provided as a product in a particular form suitable for a decision process as a Geoinformation product. It serves a particular information need in a specific situation. Geoinformation products come in many forms and can be delivered through different media – printed on paper as reports or maps, delivered electronically, or can be verbal instructions during a trip with a car. A Geoinformation product is produced from geographic data, which can be considered as the raw material for its production.
2.1. Forms of the product The Geoinformation product combines datasets acquired from one or several data sources and can be offered in various forms. The form of the Geoinformation product influences the user’s ability to extract information from it. It can differ according to the format of the datasets, and the way the product is packaged. The format of the dataset depends on the processing technology and thus on the software used for it. Several software producers developed their own formats. Exchange of the data in the same format is a simple task; integrating the data from different sources and of different format is a problem for the inexperienced user. Substantial efforts were made lately by the industry and other organizations in a joint initiative (Open GIS Initiative) to overcome this problem and offer a solution for better interoperability. How the product is packaged and offered to the user depends mostly on the media of delivery.
2.2. Media of the product delivery The Geoinformation product can be delivered on paper as a report or in a graphic form as a map. A product is often delivered in a digital form on hardware media like diskette or compact disk. Internet is becoming an important media for geoinformation business, where gathering information about the product, placing the order, and paying is done over electronic network (books and CD’s are successfully sold over e-net, and one can order even a pizza over the Internet). Buyer and seller enter an electronic relationship without any other personal contact and they exchange the good over the network. In this case no physical product is delivered to the buyer. Another possible media of delivery is voice, for example, the answer to the user’s question comes as a verbal instruction during a trip with a car.
2.3. Creation of the product The creation process provides the link between the raw geographic data and the information needed to support the user’s process. Geographic data can be seen as a raw material from which Geoinformation products are produced. One dataset can be included in a variety of different products, like in the production of other economic goods where the raw material (for example, oil, potato, wood) is used for the production of different products. The creation of the Geoinformation product consists of a sequence of processing steps undertaken by one or several different producers. Each step in the processing makes sense if it contributes to the value for the user. The most important part of design is the determination of the product’s features, i.e., quality, detail, accuracy, attributes, reliability, speed. The requirements and needs of the user influence the nature of the creation process, steps needed and the producers involved.
3.
VALUE OF THE GEOINFORMATION PRODUCT
The economic value of Geoinformation is the contribution it makes to improve a decision, and ultimately the effects of the decision on activities in the real world. This linking of information to real-world activities is necessary to link information to economic value. We distinguish between value of use and value of exchange,
which is equal to the price paid for the product. Using geographic information, decisions should lead to improved production processes, which create more goods to fulfil human needs, or production processes which have less negative effects and thus less cost. The contribution of the Geoinformation product to the improvement of the user’s process can be rationally estimated to a substantial extent and expressed in monetary value.
3.1. Value of use The value of the Geoinformation product for the user is related to the use of the product and the benefits the user can draw from using it. Data about road network might be of no or little use to a logistics company, which wants to coordinate the logistics more efficiently. Road network data integrated with other data and an easy-to-use viewer enabling insertion of the global positioning data from the vehicle is more valuable for the logistics company than the datasets alone. The advantage of the Geoinformation product, like any information, is that the same product can be used many times without reducing the quality of the product or its usefulness. The same product can be used to support and improve different users’ processes. If the Geoinformation product is used often, it brings certain advantages to the user. Used datasets will be better maintained, which will result in higher usability of the product. Once a Geoinformation product has been effectively used by one user, it will raise the demand for the product and result in more users. The value of use should be higher than the value of exchange (which equals to the price) and lower than the value of decision taken by using the Geoinformation product.
3.2. Value of exchange The price reflects individuals’ preferences and is intimately tied to value formation. The value perceived by the buyer leads to the decision if the product is worth buying. If the Geoinformation product has low value to the buyer, he will not be willing to pay a high price for it. Producers of Geoinformation products should find new pricing strategies and relate the price to the value the Geoinformation product has for the user (value pricing). For example, when determining the boundaries of a parcel, a difference of a few square meters can be obtained, depending on the source of the data. The data can be available in different form and accuracy (exact coordinates, paper map, verbal description, scheme, hand drawing, etc.) The owner will be willing to pay for the information which will prevent the loss of a part of his land, but he will not be willing to pay an amount which is higher than the value of this part of the parcel.
3.3. Assessing the value The major part of the value of a Geoinformation product to the user can be assessed rationally. One can assess the contribution of the Geoinformation product to the improvement of a process undertaken by the user. An improvement of the process can be achieved in many ways; by taking better, faster and more reliable decisions, increased productivity, or increased earning capabilities (better planning of the business activities, better information about the customers). The contribution of a Geoinformation product can be measured as reduction of material, time or human resources necessary for accomplishing a certain task, and expressed in money saved. The use of the Geoinformation product to support a process impacts the whole organization of the processes. It might reflect in changes of other processes in which the Geoinformation product will not be used directly for performing the task. Consider one department in a utility company using a Geoinformation product for analyzing the network. The results of the analysis done in one department will be used in another department for further processing and execution of the maintenance work on the network. The results of the analysis will be used efficiently, which will improve the productivity of the second department. Because of this ‘network effect’ (one positive change causing a chain of positive effects) it is difficult to predict in advance all changes caused by the use of the Geoinformation product, and their influence on the users’ processes.
4.
COST OF THE GEOINFORMATION PRODUCT
The production of the Geoinformation product has a cost. One must collect the data, maintain it up to date in a format useful for the extraction of the particular data sets, and prepare the data for presentation in a format which can be used effectively. The total production cost of the Geoinformation product is determined by the fixed cost of producing the first copy of the product, which is usually high. A substantial part of the fixed cost is the cost for collecting and maintaining the datasets. Creating the value for a user will cause additional cost for the producers. Marginal cost of producing another copy of the Geoinformation product is almost negligible.
4.1. High fixed cost Fixed cost of producing the first copy of a Geoinformation product is high. The significant amount represents the cost of collecting and maintaining the data, which is mostly labor cost. Fixed cost is relatively easy to estimate and quantify. The producer assigns a monetary value to the time spent for the production process and the resources needed for accomplishing the task. The dominant component of the fixed cost of producing information is sunk cost, which is not recoverable if production is halted. “If you invest in a new office building and you decide you don’t need it, you can recover part of your costs selling the building” [Shapiro and Varian 1998]. Once a producer has invested in acquisition of datasets he cannot use to create a Geoinformation product or sell, he will have difficulty to recover this cost.
4.2. Cost of creating the value We consider the cost of creating the value as a separate category. Most of the producers are not aware of the importance of being able to create the value according to the needs of the user. For example, a Geoinformation product with a high level of quality (high positional accuracy, detailed attributes, and high logical consistency) might not be of any more value than a product with less quality if the buyer needs a small amount of data on a small scale, as base data for the presentation of the situation. Cost of creating the value is mostly associated with additional effort of the producer to design the product. It includes identification of the potential user’s needs and values, which is in most cases done with the help of interviews, market surveys, or questionnaires. The producers might find ways to involve buyers in the design of the product, and define the characteristics and parameters of the product in cooperation with the potential buyers. Creating the value will bring additional cost for the producer and buyer, but will lead to the products which are demanded and needed by the user.
4.3. Low marginal cost of producing an additional copy Marginal cost is cost of producing another unit of output. Marginal cost of producing another copy of the Geoinformation product is minimal, sometimes negligible. This is contrary to the rules of economics applied for the standard economic good where the marginal cost of producing is positive and increasing with the number of products produced. Such rules do not hold for a Geoinformation product. For example, copying already integrated datasets can be performed as a batch process and does not require additional work of the expert. The marginal cost of another copy in this case is the cost of media (compact disc, diskette, or transfer over the network) and time of the machine spent on copying. Marginal cost of the Geoinformation product is usually only the cost of dissemination.
4.4. Cost of assessing the quality Assessing the quality brings about certain costs, which are not equally allocated between user and producer. The Geoinformation product is an ‘experience good’, which means that the quality of the product can be rationally assessed only by testing the product. The user can try to apply a limited version of the product, test it in a particular situation and assess the quality for the selected problem. The other possibility is that the producer provides description of the quality, which can be checked. The cost for the producer in this case is the time needed for preparing useful quality descriptions. “Current practice of data quality description is inadequate and does not help users to decide if a potentially useful dataset should be acquired and used.”[Frank 1998].
5.
QUALITY OF THE GEOINFORMATION PRODUCT
A Geoinformation product has multiple aspects of quality, e.g., how precise is the information, how complete or how up-to-date is it. The quality of the product is derived from the quality of the datasets. We assume here that high quality datasets result in a high quality product. It is also reasonable to assume that higher quality increases the cost of producing the Geoinformation product. We show that improving the quality beyond a certain level does not bring additional benefit to the user. If products have undetermined variable quality, using these products involves additional risk.
5.1. Quality of datasets Datasets, which are used as a raw material for creating a Geoinformation product, have substantial influence on the quality of the final product. The quality of the datasets is in most cases associated with the positional and attribute accuracy of the data. One can also estimate other parameters of the quality, for example, logical consistency (are all polygons closed, do all parcels have parcel numbers, etc.), or completeness of the data
measured by the percent of the data that were not collected (errors of omission or commission). An important parameter of the quality is temporal update level. We assume that the high level of quality of the collected and maintained datasets contributes to the high quality of the Geoinformation product.
5.2. Multiple aspects of quality It is difficult to separate the several aspects of data quality. Consider a slowly increasing forest area: a delay in updating cannot be separated from an error in the position of the boundary. It is difficult to measure objectively how much a specific parameter of the quality dataset contributes to the quality of the final product. We assume here that we consider only one aspect of data quality, which is measured on a linear scale, and that the high level of quality of datasets leads to a high level of quality for a Geoinformation product. A more detailed investigation would need to consider the case of Geoinformation products for which two or more independent data quality aspects can be determined independently.
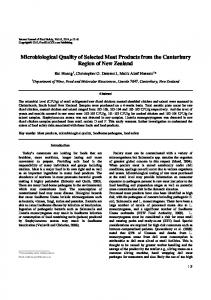
5.3. High level of quality increases cost A higher level of quality increases cost, and we assume here that the marginal cost of producing one unit of more quality increases. Consider the case of preparing the digital map as a source for car navigation. For the simple orientation how to go from one city to another the driver will need only the road network on a small scale (the user can get all major roads in the USA for approximately $200; a price for a comparable dataset of Europe is not even available). Having only the road network on a map of small scale will not be enough for an efficient orientation in the center of the city. A driver will need a map with a variety of other data, at least the buildings and street names. The cost of producing a dataset with low accuracy and lower level of detail is low in comparison to the map with data integrated from different sources. The costs of producing a map with higher precision (only one parameter of the product quality) are rising.
Costs
Quality
Figure 1: Costs of providing quality (cost curve)
5.4. Benefit of the quality to the user The important question a producer should consider is how much the quality of a Geoinformation product can contribute to a better decision of the user. We concentrate on the car navigation example with only one parameter of the quality, e.g., precision. A map source with location errors of more than 100 m has no value for the driver driving in town. With this precision he will miss the correct road. A map of too low quality does not bring any benefit to the user because it cannot prevent him from taking the wrong decision. Another extreme example is high positional accuracy (map source with, for example, 1 cm of positional accuracy), which does not bring additional benefit to the user and is costly to produce. The driver can as efficiently find the road with the map of lower positional accuracy. For an illustration we draw an approximation of the benefit curve in figure 2 to show the important intervals of the benefits of the quality to the user. We marked three important points showing that improving the level of the quality results in higher benefit for a producer only in a certain interval, between the points A and B on the figure 2. For the navigation example, the point A can be 100 m, the
point B 1m positional accuracy. After a maximum quality appropriate for a specific use of the product is achieved, improving the quality further does not result in a better decision of the user. Producing it causes only unnecessary cost to the producer.
Benefits
Quality A
B
Figure 2: Benefits of the Quality for the User (benefit curve)
5.5. Variable quality Using a product of variable quality involves risk. Changes in the level of the quality cause uncertainty and less satisfaction to the user, not meeting his expectations. If airline companies have unpredictable delays, the value of air transportation is reduced for most users. Bank customers expect that the banks will not make any errors recording their account number and the amount of money on their accounts. Reducing errors in the product or services leads to less variability in the quality. Uncertainty about the quality is also lower if the product performs according to a given specification. This is difficult to achieve for certain products where the sequence of performed tasks cannot be easily predicted and can cause errors in performance (software bugs, for example). The formulation of standards of performance of Geoinformation products is an important research goal.
6.
OPTIMAL QUALITY FOR A GEOINFORMATION PRODUCT
The optimal quality for a Geoinformation product is the quality where the incremental cost of producing more quality equals the incremental value of the quality. Producing a better product costs more than what is gained, and producing a worse product does bring less profit. We assume here that the law of diminishing returns is applicable both for the production of the data quality and the production of value from the quality. Even if the functions are not continuous and of different shape, a maximum value for the difference between the benefit of using it and cost of creating the product can be found. We draw the approximation of the cost and benefit curve, which is unique for a specific product and its particular use. Better evaluation of the costs and estimation of the benefits will enable the producer to make an economically rational decision about the level of the optimal quality for a specific group of users.
6.1. Profitable Quality Profitable quality is the interval of the quality, which assures higher benefits to the user than the cost of producing it to the producer. For the producer it is crucial to provide the demanded level of quality at lower cost than benefits and earn a reasonable rate of return on his investment.
ECU per unit output
Costs
Benefits
Quality OA
B
Figure3: Profitable Quality (between A and B)
6.2. Optimal Quality Optimal quality of the Geoinformation product is the quality where the difference between the benefits of using the product and cost of producing is the highest. At this point (figure 4, point x) the incremental cost of producing more quality equals the incremental value of the quality. A rational driver will choose the level of precision (deduced from the map source with low, but still acceptable positional accuracy) that assures him to find the right road, at minimum cost possible. Knowing the cost and benefit curve for the Geoinformation product will enable producers to efficiently plan the optimal level of the quality and develop the products, which will earn reasonable rate of return on the investment and will be needed and demanded by the users. Figure 4 presents a possible outcome of the analysis for the particular Geoinformation product.
Costs
ECU per unit output
Benefits
Quality X Figure 4: Optimal Quality (X)
6.3. Quality differentiation To satisfy the different needs of the users producers will intentionally produce different quality. Quality differentiation will lead to differentiation of the Geoinformation products so that they will be sufficient only for a particular use. This will enable the producer to develop the Geoinformation product for a particular segment of the market. Differentiation will lower the production cost for the producer, who will produce Geoinformation products of limited, but sufficient quality (optimal quality). “The purpose of differentiation is to generate profit for the firm, the focus for analyzing differentiation must be the customer: it is by creating value for the customer that exceeds the costs incurred by the firm that profit is generated. The critical issue is whether that differentiation creates value for the customer. Differentiation is about understanding the product or service and about understanding the customer” [Grant 1995].
7.
CONCLUSIONS
The absolute concept of quality does not exist; user and producer have different perceptions of quality and the value quality has for them. The producer should accept the user’s criteria and provide the quality of the product that has high value to him. Major producers of the raw material (datasets) for Geoinformation products focus their activities on providing a high level of technical quality (high accuracy, more detail, etc.). This can be in contradiction with the user’s expectations and needs. To focus on the creation of quality Geoinformation products is not the only condition for an efficient and successful business strategy. It is crucial for the producer to understand the concept of different levels of quality. The producer of the Geoinformation product will have to plan his activities according to the demand of the potential user and his perception of the value. He should know in the phase of designing the product what level of quality is demanded. A product which has a higher level of quality than the user needs has not more value to the user but likely cost more for the producer. The producer will earn a reasonable rate of return on his investment only for the Geoinformation product that will be demanded and accepted on the market and designed in a way that it has value for the user. The question is still why the potential buyers are more aware of the problems and costs using a Geoinformation product than of the benefits they can draw from using it. The producer has difficulties to estimate and quantify the benefits if he does not know the processes within the user’s organization and where the Geoinformation product can be applied. Cost and benefit curves are unique for a specific Geoinformation product and its particular use. Evaluation of the costs and estimation of the benefits of quality will enable the producer to make economically rational decisions about the optimal quality for the target market. Innovative strategies will become winning strategies. An active role – of both the producer and the user – in the phase of the design and creation of the product, and defining the attributes and characteristics will be required in the future. A more flexible understanding of the quality will create new opportunities for the producer of the Geoinformation product. Opening up new markets will offer new possibilities and ways of using the datasets and Geoinformation products.
ACCKNOWLEDGEMENTS We appreciate the efforts of Mag. Roswitha Markwart to improve this text and Michael J. Kevany for the comments on an early draft.
REFERENCES Grant, Robert M. (1995), Contemporary Strategy Analysis, Blackwell Publishers Inc., Cambridge, Massachusetts, USA Goodchild, Michael and Robert Jeansoulin –editors (1998), Data Quality in Geographic Information, Editions Hermes, Paris Guptill, C. Stephen and Joel L. Morrison –editors (1995), Elements of Spatial Data Quality, Published on behalf of the ICA Commission on Spatial Data Quality, Elsevier Science Ltd. Johansson, Johny K. (1997), Global Marketing, Foreign Entry, Local Marketing, and Global Management, Richard D. Irwin, a Times Mirror Higher Education Group, Inc. Company
Fabri, Karen P. and Henk J. Scholten (1995), GIS and Multimedia breaks into the Tourism Industry, In Conference Proceedings, GIS for Business, Discovering the Missing Piece in your Business Strategy, Madrid, Spain, p. 261 Fletcher, Tony and Neil Russell-Jones (1997), Value Pricing, How to Maximize Profits Through Effective Pricing Policies, Kogan Page Limited, London Frank, Andrew U. (1995), Strategies. In Geographic Information Systems – Materials for a Post-Graduate Course: Vol. 3 – GIS Organization, Department of Geoinformation, Technical University Vienna Frank, Andrew U. (1998), Metamodels for Data Quality Description. In Data Quality in Geographic Information, From Error to Uncertainty, editors – M. Goodchild and R. Jeansoulin, Editions Hermes, Paris, p. 15 Frank, Andrew U. (1996), Der Nutzen und der Preis von geographischer Information, Salzburger Geographische Materialen, Heft 24: 61-70, Salzburg 1996, Beitraege zur Geographischen Informationswissenschaft (article) Goldratt, Eliyahu M. and Jeff Cox (1992), The Goal, A Process of Ongoing Improvement, second revised edition, North River Press, Inc. Hammer, Michael and James Champy (1995), Business Reengineering, Die Radikalkur für das Unternehmen, 5. Auflage, Campus Verlag, Frankfurt/New York Hanan, Mack and Peter Karp (1991), Competing on Value, Amacom, American Management Association, New York Harvey, F. (1998), Quality needs more than a Standard. In Data Quality in Geographic Information, Editions Hermes, Paris, p. 37 Friedman, David (1996), Hidden Order, The Economics of Everyday Life, Harper Business Kotler, Philip (1994), Marketing Management, Analysis, Planning, Implementation, and Control, Eighth Edition, Prentice Hall Inc. Mansfeld, Edwin (1993), Managerial Economics, W.W. Norton & Company, Inc. Meixner, Harald and Andrew U. Frank (1996), GI Policy – Study on Policy Issues Relating to Geographic Information in Europe, European Commission DG XIII: Brussels Porter, Michael E. (1990), The Competitive Advantage of Nations, New York Free Press Shapiro, Carl and Hal R.Varian (1998), Information Rules, Harward Business School White, Marvin S. (1991), Car Navigation Systems. In Geographical Information Systems, edited by Maguire D.J., Goodchild M.F, and Rhind D.W., Longman Scientific&Technical, Longman Group UK Ltd., p. 115