www.aasrc.org/aasrj
American Academic & Scholarly Research Journal
Vol. 4, No. 3 May 2012
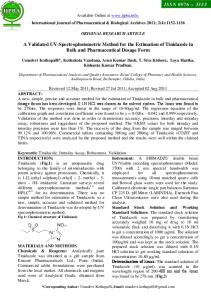
OPTIMIZED AND VALIDATED SPECTROPHOTOMETRIC METHOD FOR THE DETERMINATION OF OLANZAPINE IN PHARMACEUTICAL FORMULATIONS USING 1,2,-NAPHTHOQUINONE-4-SULPHONATE (NQS) Abir Abdalla Ahmed Ali, Abdalla Ahmed Elbashir * University of Khartoum, Faculty of Science, Chemistry Department, Khartoum, P. O. Box 321, 1115,Sudan.
Author of correspondence Dr. Abdalla A. Elbashir, e-mail:
[email protected],
Abstract Spectrophotometric study was carried out, for the first time, to investigate the reaction between the antipsychotic Olanzapine (OLP) and 1,2-naphthoquinone -4-sulphonate (NQS) reagent. In alkaline medium (pH 13), an orange-colored product exhibiting maximum absorption peak (λmax) at 454nm was produced. The stoichiometry of the reaction was determined and the reaction mechanism was postulated. This colordeveloping reaction was successfully employed in the development of simple and rapid spectrophotometric method for determination of OLP in its pharmaceutical dosage forms. Under the optimized reaction conditions, Beer’s law correlating the absorbance (A) with OLP concentration (C) was obeyed in the range of 0.4–4 µgml−1. The regression equation for the calibration data was A = 0.0372 + 0.1637C, with good correlation coefficient (0.9997). The molar absorptivity (ε) was 5.6×10⁴ l mol−1 cm−1. The limits of detection, quantification and Sandell sensitivity were 0.09, 0.29 µgml−1 and 0.006 µgcm−2 respectively. The intra-day precision (%RSD) and accuracy (%RE) ranged from 0.2 to 0.67 % and from 0.18 to 0.66 %, respectively, the inter-day (%RSD) and (%RE) values were within 0.12 % and 0.52 %, respectively. The proposed method was successfully applied to the determination of OLP in its pharmaceutical tablets with good accuracy and precisions; the label claim percentage was 100.67± 0.06. The method is practical and valuable for its routine application in quality control laboratories for analysis of OLP. Keywords: Olanzapine, 1,2-Naphthoquinone-4-sulphonate, Spectrophotometry, Pharmaceutical analysis. 1. Introduction Olanzapine (OLP), chemically known as 2-methyl-4-(4-methyl-1-piperazinyl)-10H-thieno [2,3-b] [1,5] benzodiazepine (Scheme1), is an atypical antipsychotic agent, also known as second-generation antipsychotic (SGA) (Conley & Kelly D.L. 2005; Basavaiaha et al., 2009). Since its introduction in 1996 in over 84 countries, several workers have reported HPLC methods for the determination of OLP in plasma, serum, human breast milk and rat brain(Concetta et al., 2006; Saracino et al.,2006; and 2007; Raggi et al., 2001; Olesen & Linnet 1998; Kasper et al., 1999; ). HPLC has also been used for the assay of OLP in pharmaceutical formulations when present either alone (Raggi et al., 2000) or in combination with fluoxetine (Reddy et al., 2007; Shah et al., 2007). Various other techniques including HPTLC (Shah et al., 2007), nonaqueous titrimetry and UV-spectrophotometry (Rubesh et al., 2011; Firdous et al., 2005), capillary zone electrophoresis and linear voltammetry (Raggi et al., 2000) have also been reported for the assay of OLP in pharmaceuticals. There are few reports on the use of visible spectrophotometry in the assay of OLP
www.aasrc.org/aasrj
American Academic & Scholarly Research Journal
Vol. 4, No. 3 May 2012
(Revanasiddappa & Veena, 2008; Nagaraju & Kanakapura, 2009a, 2009b; Basavaiah et al., 2010; Vivek et al., 2010; Jasinska & Nalewajko, 2004; Krebs et al., 2006; Mohamed 2008). However, most of these methods are costly, tedious, and time consuming. Therefore, the need for a rapid, economical, and selective method is obvious, especially for a routine quality control analysis of pharmaceutical products containing OLP. The aim of this study was to develop a fast, sensitive, economical, and easy UV-Visible spectrophotometric method for the determination of OLP in raw and pharmaceutical formulations. 1,2-Naphthoquinone-4-sulphonate (NQS) has been used for the determination of many pharmaceutical amines (Wang et al., 2004; Darwish et al., 2009; Ebraheem et al., 2011; Shazalia et al., 2011; Elbashir and Elwagee,2012; Elbashir et al., 2012a;2012b). The reaction between NQS and OLP has not been investigated yet. Therefore, the present study was devoted to explore NQS as a derivatizing reagent in the development of selective and sensitive spectrophotometric method for the determination of OLP in tablets. 2. Experimental 2.1. Apparatus All of the spectrophotometric measurements were made with a Double beam UV-1800 ultraviolet-visible spectrophotometer provided with matched 1-cm quartz cells (SHIMADZU Japan), temperature controller was used for the spectrophotometer measurements, pH meter model pH 211(HANNA Italy) was used for adjusting pH. 2.2. Chemicals and materials Olanzapine (OLP ;) was obtained and used as received; its purity was 100.2±1.25%.1,2-naphthoquinone-4sulphonate; (NQS; Aldrich chemical Co., St. Louis, USA). Olanzapine tablets (Microlab Ltd, hosur, India) are labeled to contain 10 mg of OLP tablet. All reagents were of analytical grade reagent. Double-distilled water was used in all experiments. 2.3. Preparation of standard and sample solutions 2.3.1. Stock standard solution of Olanzapine (500 μgmL−1) An accurately weighed 0.5g standard sample of OLP was dissolved in 10 mL 0.025 M H2SO4, transferred into a 100mL standard flask and diluted to the mark with water and mixed well. The solution was stable for at least two weeks at 4ºC. 2.3.2. Sodium 1,2-naphthoquinone-4-sulfonic (NQS) solution 0.6% (w/v) A weighed 0.60g NQS was dissolved in water transferred into a 100 mL standard flask and diluted to the mark with water and mixed well. The solution was freshly prepared and protected from light. 2.3.3. Buffer solutions Buffer solution of pH 13.0 was prepared by mixing 25 mL of 0.2 M KCl with 65 mL of 0.2 M NaOH in 100 mL volumetric flask and adjusted by a pH meter. Buffer solutions of different pH value were also prepared according to literature method. 2.3.4. Tablets sample solution Twenty tablets were weighed accurately and pulverized. Then an accurately weighed amount equivalent to 20 mg was transferred into a 100 mL calibrated flask, and dissolved in about 10 mL in 0.025 M H2SO4, after 10 minutes of continuous shaking, was filtered into a 100 ml of calibrated volumetric flask through Whatmann No 41 filter paper and was diluted to 100 ml, to obtain a stock solution with a concentration of 200µg/ml. The prepared solution was diluted quantitatively to obtain a suitable concentration for the analysis, and then the general procedure was followed as described above below.
www.aasrc.org/aasrj
American Academic & Scholarly Research Journal
Vol. 4, No. 3 May 2012
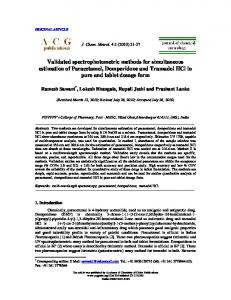
2.4. General recommended procedure A 1.0 mL of 10 mg/L OLP was transferred into A 10.0 mL standard flask 1.0mL NaOH–KCl buffer solution of pH 13.00, 1.00 mL of 0.6% NQS were added sequentially, diluted to the mark with water and mixed well. This solution stood for 25 min at room temperature. The absorbance of the solution was measured at 454 nm against blank reagent prepared with the same reagent concentration, except the drug. 2.5. Composition of product The Job’s method of continuous variation was employed (Job, 1964). Equimolar (2.5×10⁻³ M) aqueous solutions of OLP and NQS were prepared. Series of 10-mL portions of the master solutions of OLP and NQS were made up comprising different complementary proportions (0:10, 1:9, . . ., 9:1, 10:0, inclusive), The solution was further treated as described under the general recommended procedures. 3. Result and discussion 3.1. Absorption spectra The absorption spectrum of OLP was recorded against water (Fig. 1). It was found that OLP exhibits a maximum absorption peak (λmax) at 360nm with molar absorptivity (ε) of 3.1×10⁴ lmol−1 cm−1. Because of the highly blue shifted λmax of OLP, its determination in the dosage forms based on the direct measurement of its absorption for ultraviolet is susceptible to potential interferences from the co-extracted common excipients. There for derivatization of OLP to a red-shifted light-absorbing derivative was necessary. The reaction between OLP and NQS was performed, and the absorption spectrum of the product was recorded against reagent blank (Fig. 1). It was found that the product is orange colored exhibiting λmax at 454 nm, and the λmax of NQS was 360nm. Obviously, the λmax of OLP–NQS derivative was red-shifted from the λmax of OLP (360nm), eliminating any potential interferences. Therefore, the measurements were carried out at 454nm. 3.2. Optimization of reaction variables 3.2.1. Effect of concentration of NQS The effect of NQS concentrations on their reaction with OLP revealed that the reaction were dependent on the reagent concentration as the readings increased with the increase in the reagent concentration (Fig 2). The highest readings were attained at concentration ranges of (0.1–0.8(w/v)) for NQS. For high precise values, further experiments were carried out using 0.5 for NQS. 3.2.2. Effect of pH The influences of pH on the absorbance of product (I) is shown in Fig.3 at pH 4.0–7.0, the absorbance of the product is close to 0, indicating that under high acidity, OLP has difficulty reacting with NQS. The possible reason may be that the amino group (−NH2) of OLP is protonated and turned into protonated amine salt (−NH3+). So it loses nucleophilic capability for 4-sodium sulfonate of NQS, and the nucleophilic substitution reaction can’t take place easily. If pH>7.0, the absorbance of the solution increases rapidly with the growth of pH. It may be that protonated amine salt (−NH3+) of OLP turns into amino group (−NH2) again when the acidity of the solution becomes low. The higher the pH is, the more effectively the protonated amino group removes the proton, and the more easily the nucleophilic substitution reaction happens. At pH13.0, the absorbance reaches its maximum; in other words, the degree of the nucleophilic substitution reaction is also maximal. If pH>13.0, the absorbance of solution decreases sharply again. Presumably it may be that the increase of hydroxide ion holds back the nucleophilic substitution reaction between OLP and the chromogenic reagent. Consequently, the absorbance of the solution reduces. In order to keep the high sensibility for determination of OLP, pH 13.0 was selected for the optimal experimental conditions. 3.2.3. Effect of Temperature and Time. The effect of temperature on the reaction was studied by carrying out the reaction at different temperatures (25–80◦C). It was found that the reaction of OLP with NQS was not affected by increasing the temperature,
www.aasrc.org/aasrj
American Academic & Scholarly Research Journal
Vol. 4, No. 3 May 2012
and the reaction at room temperature (25 ±5◦C) went to completion in 25 minutes, and longer reaction time up to 40 minutes did not affect the reaction (Fig 4,5).Therefore, further experiments involving NQS reagent were carried out at room temperature (25 ± 5◦C) for 25 minutes. 3.3. Stoichiometry of Derivatization Reaction Under the optimum conditions, the stoichiometry of the reaction between OLP and NQS was investigated by Job’s method (Job, 1964) and was found to be 1: 1 because OLP molecule Contains only one center (secondary amino group) available for this condensation reaction Fig 6. Based on this ratio, the reaction pathway was postulated to be proceeded as shown in Scheme 2. 3.4. Method Validation 3.4.1. Calibration and sensitivity Calibration curve for the determination of OLP by its reaction with NQS was constructed by plotting the absorbances as a function of the corresponding concentrations (n=6). The regression equation for the results was A = 0.0372 + 0.1637C (r 2 = 0.9997), where A is the Absorbance at 454 nm, C is the concentration of OLP in µgml −1 in the range of 0.4–4 µgml−1, and (r2) is the correlation coefficient. The molar absorptivity (ε) was 5.6×10 4 lmol−1 cm−1. The limit of detection (LOD) and limit of quantification (LOQ) were determined according to The International Conference of Harmonization (ICH) guidelines for validation of analytical procedures (ICH,1996). The following formula was used: LOD or LOQ= қ SDa/b, where қ = 3.3 for LOD and 10 for LOQ, SDa is the standard deviation of the intercept, and b is the slope. The LOD and LOQ were 0.09 and 0.29µgml −1, respectively. The parameters for the analytical performance of the proposed method are summarized in Table 1. 3.4.2 .Precision and Accuracy Three different concentrations of OLP with in Beer’s law limits in this method was analysed in five replicates during the same day (intra-day precision) and five consecutive days (inter-day precision) (Shabir, 2003. Drug analysis was performed in triplicate and pooled-standard deviation was calculated. The RSD values of intraday and inter-day studies for OLP showed that the precision of the methods was acceptable Table 2. Accuracy was evaluated as percentage relative error (RE) between the measured mean concentrations and nominal concentrations for OLP. As summarized in Table 2, accuracy was acceptable. 3.4.3. Robustness Robustness was examined by evaluating the influence of small variation in the method variables on its analytical performance. In these experiments, one parameter was changed whereas the others were kept unchanged, and the recovery percentage was calculated each time. It was found that small variation in the method variables did not significantly affect the procedures; recovery values were shown in Table 3. 3.4.4. Recovery Study To study the accuracy of the proposed method, and to check the interference from excipients used in the dosage forms, recovery experiments were carried out by the standard addition method. This study was performed by addition of known amounts of OLP to reanalyzed solutions of commercial tablets; as shown in Table 4. 3.5. Application of the Proposed Method The proposed method was applied to some pharmaceutical formulations containing OLP. The results in Table 4 indicate the high accuracy of the proposed method for the determination of the studied drug. As can be seen from Table 5, the proposed method has the advantage of being virtually free from interferences by excipients such as glucose, lactose and starch or from common degradation products. The percentage was 100.67± 0.06 for OLP. 4. Conclusions No UV or derivative spectrophotometric methods have been described for the determination of olanzapine. Therefore simple, fast and reliable derivative spectrophotometric method was developed for the routine
www.aasrc.org/aasrj
American Academic & Scholarly Research Journal
Vol. 4, No. 3 May 2012
determination of olanzapine. The developed method can be concluded as accurate, sensitive and precise and can be easily applied to the pharmaceutical formulation.
References Ahmed, S.M.A., Elbashir, A. A., Aboul-Enein, H.Y. (2012) New spectrophotometric method for determination of cephalosporins in pharmaceutical formulations. Arabian Journal of Chemistry, doi:10.1016/j.arabjc.2011.08.012 Basavaiah, K., Zenita, O., Rajendraprasad, N., Kalsang Tharpa., & Vinay K.B. (2010). Simple and sensitive spectrophotometric determination of olanzapine in pharmaceuticals using hexacyanoferrate (III)-an improved protocol ,Journal of Advanced Pharmaceutical Research, 1,146-156. Basavaiaha, k. Tk, Nagaraju, R, Salmara, G, Hiriyannab, & Vinaya .K.B. (2009) Spectrophotometric Determination of Antipsychotic Drug Olanzapine in Pharmaceuticals. Jordan Journal of Chemistry, 4,65-76. Concetta, D, Gaetana M., Vincenza S., & Edoardo S. (2006). Determination of olanzapine in human plasm by reversed-phase high-performance liquid chromatography with ultraviolet detection. Ther. Drug Monit.,28,388-393. Conley, R.R., & Kelly, D.L. (2005). A review of current drug targets and pharmacology of antipsychotic treatment. Med. Chem. Rev., 2:177-182. Darwish, A.H., Amer, S.M., Al-Rayes LI. (2009). Spectrophotometric study for the reaction between fluvoxamine and 1,2-naphthoquinone-4-sulphonate: kinetic, mechanism and use for determination of fluvoxamine in its dosage forms. Spectrochimica Acta A: Mol. Biomol. Spectrosc 72,897–902. Ebraheem S., Elbashir, A.A., & Aboul-Enein H.Y. (2011). Spectrophotometric methods for the determination of gemifloxacin in pharmaceutical formulations. Acta Pharmaceutica Sinica B, 1,248– 253. Elbashir, A.A., Ahmed, A.A., Ahmed, S.M. A., & Aboul-Enein H.Y. (2012a). 1,2-Naphthoquinone-4sulphonic acid sodium salt (NQS) as an analytical reagent for the determination pharmaceutical amine by spectrophotometry. Applied Spectroscopy Reviews, 47,219-232. Elbashir A.A., Ahmed, A.S.M. & Aboul-Enein H.Y. (2012b). New Spectrofluorimetric Method for Determination of Cephalosporins in Pharmaceutical Formulations. J. Fluorescence, DOI: 10.1007/s10895-011-1021-1. Elbashir, A.A., & Elwagee, H.E.A. (2012). Spectrophotometric determination of pyrimethamine(PYM) in pharmaceutical formulation using 1,2-naphthoquinone-4-sulfonate (NQS). Journal of the Association of Arab Universities for Basic and Applied Sciences xxx, xxx–xxx. Firdous, S. A., man, T. & Nisa, A., (2005). Determination of olanzapine by UV spectrophotometry and nonaqueous titration. J. Chem. Soc. Pak. 27,163-167. ICH Guideline, Q2(R1). (2005). Validation of Analytical Procedures: Text and Methodology, London, Jasinska, A, & Nalewajko, E., (2004). Batch and flow injection methods for the spectrophotometric determination of olanzapine. Anal. Chim. Acta, 508, ,165-170. Kasper, S.C., Mattiuz, E.L., Swanson, S.P., Chiu, J.A., Johnson J. T. & Garner C. O. (1999). Determination of olanzapine in human breast milk by high performance liquid chromatrography with electrochemical detection. J. Chromatogr. B, 726,203-209.
www.aasrc.org/aasrj
American Academic & Scholarly Research Journal
Vol. 4, No. 3 May 2012
Krebs, A., Starczewska, B., Puzanowsha-Tarasiewicz H. & Sledz J. (2006). Spectrophotometric determination of olanzapine by its oxidation with N-bromosuccinimide and cerium (IV) sulfate. Anal. Sci 22,829833. Mohamed, A.A. (2008). Kinetic and maximum absorbance spectrophotometric methods for the determination of olanzapine. Monatsh Chem., 139,1005-1010. Nagaraju, R, & Kanakapura, B. (2009a). Determination of olanzapine by spectrophotometry using permanganate. Brazilian Journal of Pharmaceutical Sciences, 45,539-550. Nagaraju, R, Kanakapura, B., Kalsang, T., Kanakapura, B., Vinay (2009b). Quantitative Determination of Olanzapine in Tablets with Visible Spectrophotometry using Cerium(IV)sulphate and Based on Redox and Complexation Reactions. Eurasian J. Anal. Chem, 4, 191-203. Olesen, O.V., & Linnet, K. (1998). Determination of olanzapine in serum by high-performance liquid chromatography using ultraviolet detection considering the easy oxidability of the compound and the presence of other psychotropic drugs. J.Chromatogr., B 714,309-315. P. J. (1964). Advanced Physicochemical Experiments. 2nd ed ed. Edinburgh.
Raggi, M.A., Casamenti G., Mandrioli R., Izzo G. & Kenndler E. (2000). Quantitation of olanzapine in tablets by HPLC, CZE, derivative spectrometry and linear voltammetry. J. Pharm. Biomed. Anal. 23,973981. Raggi, M.A, Casamenti, G., Mandrioli, R. , & Volterra, V. (2001). A sensitive high-performance liquid chromatographic method using electrochemical detection for the analysis of olanzapine and desmethylolanzapine in plasma of schizophrenic patients using a new solid-phase extraction procedure J. Chromatogr. B. 750, 137-146. Reddy, B.V., Suresh Reddy K. V. N., Sreeramulu J. & Kanumula G. V. (2007). Simultaneous determination of olanzapine and fluoxetine by HPLC. Chromatographia, 66,111-114. Revanasiddappa, H.D., & Veena, M. A. (2008). Highly sensitive spectrophotometric methods for the determination of olanzapine, J.Ecletica., 33,47-52. Rubesh, k.S., Gayathri, P., Duganath, N., Kiran, C.H., Sridhar, C., & Jayaveera, K. . (2011) Simultaneous Estimation of Fluoxetine HCl and Olanzapine in Bulk Drug and Pharmaceutical Formulation by Using UV-Visible Spectroscopy Method . International Journal of Pharmaceutical Sciences and Drug Research (ijpsdr), 3,52-55. Saracino, M.A., Gandolfi, O., Dall’Olio R. O., Albers, L., Kenndler, E. & Raggi, M. A. (2006). Determination of Olanzapine in rat brain using liquid chromatography with coulometric detection and a rapid solidphase extraction procedure. J.Chromatogr. A, 1122,21-27. Saracino, M.A., Koukopoulos, A., Sani G., Amore, M. & Raggi, M.A. (2007). Simultaneous highperformance liquid chromatographic determination of olanzapine and lamotrigine in plasma of bipolar patients. Ther. Drug Monit. 29,773-780. Shabir, G.A. (2003). Validation of high-performance liquid chromatography methods for pharmaceutical analysis: Understanding the differences and similarities between validation requirements of the US Food and Drug Administration, the US Pharmacopeia and the International Conference on Harmonization,. J. Chromatogr A, 987,57-66. Shah, C.R., Shah, N.J., Suhagia, B. N., & Patel N.M. (2007). Simultaneous assay of olanzapine and fluoxetine in tablets by column high-performance liquid chromatography and high-performance thin layer chromatography. J. AOAC Int., 90,1573-1578.
www.aasrc.org/aasrj
American Academic & Scholarly Research Journal
Vol. 4, No. 3 May 2012
Vivek, M.P., Jigar, A.P., Shweta, S.H., & Sunil R. (2010). First and Second derivative spectrophotometric methods for determination of olanzapine in pharmaceutical formulation. International Journal of ChemTech Research, 2, :756-761. Wang, X., LX, Xiao Y, Han. (2004). Spectrophotometric determination of dapsone in pharmaceutical products using sodium 1,2-naphthoquinone-4-sulfonic as the chromogenic reagent . J Spectrochimica Acta A.Mol. Biomol. Spectrosc 60,2933–2939.
Table1: Parameters for the performance of the proposed method. Parameter OLP λmax, nm 454 Beer’s law limits, μg/ml 0.4-4.0 Molar absorptivity, l/mol cm 5.6 X 10⁴ 2 Sandell sensitivity, μg/cm 0.006 Limit of detection, μg/ml 0.09 Limit of quantification, μg/ml 0.29 Regression equation, Y٭: Intercept (a) 0.03724 Standard deviation of intercept 0.0049 Slope (b) 0.1637 Standard deviation of slope 0.0020 Correlation coefficient (r2) 0.9997 Standard deviation 0.00656 ٭Y=a+bX, where Y is the absorbance, a intercept, b slope and X concentration in µg/mL.
Table 2: Evaluation of intra-day and inter-day accuracy and precision. Intra-day(n=5) Found Found %RE %RSD μg/mL μg/mL 3.2 3.194 0.187 0.52 3.196 4.0 3.987 0.325 0.20 3.991 4.8 4.768 0.666 0.67 4.775 RE: relative error; RSD: relative standard deviation. Mean value of three determinations.
LID Taken μg/mL
Inter-day(n=5) %RE
%RSD
0.125 0.175 0.520
0.45 0.58 0.65
Table 3: Robustness of the proposed spectrophotometric method. Recommended condition Standard pH NQS concentration (w/v %) Temperature (°C)
Parameters 13 11.8 12.2 0.55 0.65 23 27
Recovery٭ (%±SD) 99.82±0.71 101.3±0.87 99.23± 0.56 101.46±0.80 102.00±0.39 99.58 ± 0.66 99.23 ± 1.08
www.aasrc.org/aasrj
American Academic & Scholarly Research Journal
Reaction time (min) ٭
23 27
Vol. 4, No. 3 May 2012 100.05 ± 1.32 102.34 ± 0.69
Values are mean of three determinations. Table 4: Recovery studies for determination of Olanzapine by the proposed method. Added Found Recovery Sample content −1 −1 (µgml ) ٭ (µgml ) ٭ (%±RSD) −1 (µgml )
0.5 0.25 0.758 100.93±1.20 0.5 1.50 2.020 101.07±0.86 0.5 3.25 3.740 99.87±0.590 ٭Recovery was calculated as the amount found/amount taken × 100. Values are mean ± RSD: Relative standard deviation. Mean value of three determinations.
Table 5: Determination of Olanzapine formulations by the proposed method. Nominal amount Proposed method name٭٭Tablet brand mg/tablet (Found % ±SD)٭ Olan-10 ٭Mean value of five determinations. ٭٭Marketed by: Microlab Ltd, hosur, India.
10
100.67± 0.06
www.aasrc.org/aasrj
American Academic & Scholarly Research Journal
Vol. 4, No. 3 May 2012
SCHEME.1 Chemical structure of Olanzapine
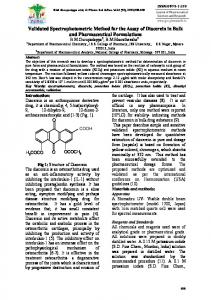
OLP-NQS (І) SCHEME.2. Scheme for the reaction pathway of Olanzapine with NQS.
www.aasrc.org/aasrj
American Academic & Scholarly Research Journal
Vol. 4, No. 3 May 2012
Fig1: (1) Absorption spectra of OLP (10µg/ml) against water, (2) NQS (0.6%, w/v) against water, (3) The reaction product of OLP (10µg/ml) with NQS against reagent blank.
www.aasrc.org/aasrj
American Academic & Scholarly Research Journal
Vol. 4, No. 3 May 2012
0.7 0.6
Absorbance
0.5 0.4 0.3 0.2 0.1 0.0
0.2
0.4
0.6
0.8
NQS%(W/V)
Fig 2: Effect of NQS concentrations on the reaction of OLP with NQS. OLP (10 µg/ml):1ml; NQS: 1ml; buffer solution (pH 13): 1ml; temperature: 25◦C; reaction time: 25 min.
www.aasrc.org/aasrj
American Academic & Scholarly Research Journal
Vol. 4, No. 3 May 2012
0.7
Absorbance
0.6 0.5 0.4 0.3 0.2 0.1 0.0 4
6
8
10
12
14
pH Fig 3: Effect of pH on the reaction of OLP with NQS. OLP (10µg/ml): 1ml; buffer solution: 1ml; NQS (0.6%, w/v): 1 ml; temperature: 25◦C; reaction time: 25 min.
www.aasrc.org/aasrj
American Academic & Scholarly Research Journal
Vol. 4, No. 3 May 2012
0.50
Absorbance
0.45
0.40
0.35
0.30 20
30
40
50
60
70
80
90
0
Temperature( C) Figure 4: Effect of temperature on the reaction of OLP with NQS. OLP (10 µg/ml):1ml; NQS( 0.6%( w/v)): 1ml; buffer solution (pH 13): 1ml; reaction time: 25min.
0.45
Absorbance
0.40 0.35 0.30 0.25 0.20 0.15 5
10
15
20
25
30
35
40
45
Time(min)
Figure 5: Effect of standing time on the reaction of OLP with NQS. OLP (10µg/ml): 1ml; buffer solution (pH 13): 1ml; NQS (0.6%, w/v): 1ml; temperature: 25◦C.
www.aasrc.org/aasrj
American Academic & Scholarly Research Journal
Vol. 4, No. 3 May 2012
0.6
Absorbance
0.5 0.4 0.3 0.2 0.1 0.0 0.0
0.2
0.4
0.6
0.8
VR/VR+VD Figure 6. Determination of Product formation by continuous variation method. VR: NQS (2.5×10⁻³ M); VD: Olanzapine (2.5×10⁻³ M); VR + VD = 10 ml.
1.0