Indian Journal of Chemical Technology Vol. 19, January 2012, pp. 56-62
Selective and validated spectrophotometric methods for determination of ganciclovir with PDAB and Folin’s reagents T Anil Kumar, B M Gurupadayya∗ & M B Rahul Reddy Department of Pharmaceutical Analysis, JSS College of Pharmacy, JSS University, Mysore 570 015, India Received 25 November 2010; accepted 12 December 2011 Two simple, sensitive, selective, accurate and precise methods (Methods A and B) have been developed for the quantitative estimation of ganciclovir in bulk drug and its pharmaceutical formulations. In Method A, presence of amino group in ganciclovir enables the use of condensation reaction with p-dimethylamino benzaldehyde, forming the greenish yellow colored complex due to the formation of Schiff’s base. It shows absorption maximum at 401 nm and obeying Beer’s law in the concentration range 80–200 µg mL-1. Method B is based on the formation of reaction with 1,2-naphtha quinine-4-sulphonic acid sodium salt (Folin’s Reagent), exhibiting absorption maximum at 544 nm and obeying Beer’s law in the concentration range 4–14 µg mL-1. The results of analysis for both the methods have been validated statistically and by recovery studies. These results have been compared with those obtained by using UV spectrophotometric methods developed in our laboratory. Keywords: Folin’s reagent, Ganciclovir, Spectrophotometric study, p-Dimethyl amino benzaldehyde
Ganciclovir is chemically 2-amino-1, 9-[{2-hydroxy1-(hydroxymethyl) ethoxy} methyl]-6H-purine-6-Hone. It is an acyclic guanosine analogue that requires triphosphorylation for activation prior to inhibiting the viral DNA polymerase and is used for the treatment of cytomegalovirus (CMV) infection in AIDS patients. Ganciclovir exhibits antiviral activity against herpes simplex virus (HSV) and cytomegalovirus (CMV) at relatively low inhibitory concentrations. Ganciclovir is a strong inhibitor of all herpes viruses, including Epstein-Barr virus and CMV1-3. Literature survey reveals that few methods which include radioimmunoassay (RIA)4 and enzyme-linked immunosorbent assay5,6 have been initially reported for the quantification of this antiviral drug in biological fluids. Some spectrophotometric7-8 and HPLC methods9-14 have been described for the analysis of ganciclovir in plasma owing to the use of ion-pairing agents or gradient elution. Ganciclovir and its pharmaceutical dosage forms were investigated using a glassy carbon electrode and differential pulse and square-wave voltammetry15. Some simultaneous methods are available for the ganciclovir estimation in combined dosage forms like acyclovir, ganciclovir ________________ *Corresponding author. E-mail:
[email protected]
and penciclovir in human plasma using fluorescence detection16. The determination of ganciclovir and acyclovir in human plasma by liquid chromatographyspectrofluorimetric detection and stability studies was carried in blood samples17. This paper reports spectrophotometric method based on the reaction of ganciclovir with p-dimethyl amino benzaldehyde (PDAB) forming Schiff’s base (Method A). Second method involves reaction of ganciclovir with 1,2-naphthoquinone-4-sulphonic acid sodium salt (Folin’s reagent) via its amino group on the side chain attached to the 2-position of the purine ring (Method B). Experimental Procedure A double-beam Shimadzu 1700 UV spectrophotometer, connected to computer and loaded with UV solution software was used. For an intermediate precision study, a different Shimadzu 1800 UV spectrophotometer connected to computer with UV-PC software was used. Both instruments have an automatic wavelength accuracy of 0.1 nm and matched quartz cells of 10 mm (1.0 cm) cell path length. All chemicals used were of analytical reagent grade and double distilled water was used throughout. Sodium carbonate solution (20%) was prepared in water and filtered. p-dimethylamino benzaldehyde
ANIL KUMAR et al.: SPECTROPHOTOMETRIC DETERMINATION OF GANCICLOVIR
(0.5% w/v) and Folin’s reagent (0.5% w/v) were prepared in distilled water. Concentrated nitric acid and 0.01N sodium hydroxide (40 mg in 100 mL distilled water) were used for the study. The active pharmaceutical ingredient (API), ganciclovir pharmaceutical grade was procured from Strides Archo Lab Limited, Bangalore, India and used as received. Preparation of ganciclovir
Standard drug solution was prepared by dissolving 0.1 g of ganciclovir in 50 mL of water and diluting up to the mark in a 100 mL calibrated flask. The stock solution was further diluted appropriately to get the working concentration. Determination of ganciclovir Method A
Standard solutions of ganciclovir of different aliquots (0.8, 1.2, …2 mL of 100 µg/mL were transferred into a series of 10 mL volumetric flasks, followed by the addition of 2.0 mL of PDAB solution and two drops of concentrated nitric acid. The volume of this solution was diluted up to the mark with water and absorbance of each solution was measured at 401 nm against the reagent blank prepared in the same manner, without the analyte. Method B
Standard solutions of ganciclovir different aliquots (0.4, 0.6, …1.4 mL of 100 µg/mL were transferred into a series of 10 mL volumetric flasks, followed by the addition of 2.0 mL of Folin’s reagent and 1 mL sodium hydroxide. The volume of this solution was diluted up to the mark with water and absorbance of each solution was measured at 544 nm against the reagent blank prepared in the same manner, without the analyte. Analysis of formulations
Twenty capsules of ganciclovir were weighed accurately and ground into a fine powder. An amount of the powder equivalent to 100 mg of ganciclovir was weighed into a 100 mL volumetric flask, 60 mL of water was added and the content was shaken thoroughly for about 20 min. Then, the volume was made up to the mark with water, mixed well and filtered using a Whatmann No. 42 filter paper. First 10 mL portion of the filtrate was rejected and then 2.5 mL of extract was subjected to analysis using the procedure described above.
57
Quantification
The limits of the Beer’s law, the molar absorptivity and the Sandell’s sensitivity values were evaluated and are given in Table 1. Regression analyses of the Beer’s law plots at their respective λmax values revealed a good correlation. Graphs of absorbance versus concentration showed zero intercept, and are described by the regression equation y = b x + c (where y is the absorbance of a 1 cm layer; b, the slope; c, the intercept; and x, the concentration of the drug in µg mL-1) obtained by the least-squares method. The results are summarized in Table 1. Validation of method
The validity of the method for the assay of ganciclovir was examined by determining the precision and accuracy. This was determined by analyzing six replicates of the drug within the Beer’s law limits. The low values of the relative standard deviation (RSD) indicate good precision of the methods. To study the accuracy of the methods, recovery studies were carried out by the standard calibration curve method. For this, known quantities of pure ganciclovir were mixed with definite amounts of pre-analyzed formulations and the mixtures were analyzed as before. The total amount of the drug was then determined and the amount of added drug was calculated by difference. The results are given in Tables 2 and 3. The average present recoveries obtained were quantitative indicating good accuracy of the methods.
Table 1— Analytical parameters for the assay of ganciclovir Parameter
Method A
Method B
Color
Yellowish green 401 80-200 0.362 × 10³ 0.7032 80 200
Cherry red
λmax, nm Beer’s law range, µg mL–1 Molar absorptivity, L mol-1cm-1 Sandell’s sensitivity, µg cm-2 Limit of detection, µg mL–1 Limit of quantification, µg mL–1 Regression equation* Correlation coefficient (r) Slope (b) Intercept (a) Percentage recovery
544 4-14 0.663 × 10³ 0.00970 1 12 y=a+bx
0.999 0.007 0.0023 99.01 & 99.03
0.994 0.031 0.0013 98.96 & 99.44
*y is the absorbance and x is the concentration (µg mL–1).
INDIAN J. CHEM. TECHNOL., JANUARY 2012
58 Specificity and selectivity
Ganciclovir solutions were prepared in the selected media with and without common exicipients separately. All solutions were scanned from 800 nm to 200 nm at a speed of 200 nm min−1 and checked for change in the absorbance at respective wavelengths. In a separate study, drug concentration of 100 µg mL-1 for Method A and 10 µg mL-1 for Method B was prepared independently from pure drug stock solution in selected media and analysed paired t test at 95% level of significance was performed to compare the means of absorbance. Linearity
To establish linearity of the proposed methods, a separate series of solutions of ganciclovir for Method A (80-200 µg mL-1) and for Method B (4-14 µg mL-1) was prepared from the stock
solutions and analyzed. Least square regression analysis was performed on the obtained data. Precision
The precision of the proposed methods was ascertained by actual determination of fixed concentration of the drug within the Beer’s range and finding out the absorbance by the proposed method in all the three drugs. Different levels of drug concentrations (6 times) are prepared three different times in a day and studied for intra-day variation. The same procedure is followed for three different days to study inter-day variation. The percentage relative standard deviation (% RSD) of the predicted concentrations from the regression equation is taken as precision. Precision studies are also carried out using the real samples of LMV in a similar way to standard solution to prove the usefulness of the method. The results are given in Table 4.
Table 2— Results of recovery study by standard addition method Method
Formulation
A
B
Ganciclovir formulation taken, µg
Pure ganciclovir added, µg
Total found µg
Pure ganciclovir recovered, %
Ganguard 250 mg
99.75 99.75 99.75
10 20 30
109.0 119.5 129.0
99.12 98.46 100.62
Natclovir 250 mg
9.75 9.75 9.75
5 15 30
14.68 14.68 14.68
98.61 100.42 101.72
Table 3— Results of determination of ganciclovir in formulations and statistical comparison with the reference method Pharmaceutical dosage forms
Labelled amount, mg
Amount found by proposed methods, mg
Reference method
Recovery of proposed methods, %
A
B
A
B
T1 (Ganguard)
250
249.6
248.19
249.86
99.01 t=0.95 f=2.89
98.96 t=1.45 f=3.79
T2 (Natclovir)
250
248.18
249.27
248.74
99.03 t=1.24 f=4.65
99.44 t=0.76 f=3.86
Table 4— Evaluation of accuracy and precision of Methods A and B Method
Ganciclovir, µg mL-1 Taken Found
Range mg
er %
SD µg mL-1
SEM µg mL-1
RSD a, %
RSD b %
A
100 120 140
99.4 119.4 139.5
0.062 0.07 0.04
4.3 3.5 2.0
0.064 0.473 0.124
0.036 0.273 0.071
0.019 0.40 0.52
0.245 1.286 1.854
B
2 4 6
1.98 3.92 5.94
0.062 0.032 0.046
1.0 1.5 1.7
0.216 0.048 0.028
0.124 0.027 0.016
0.264 0.458 0.548
4.26 3.75 4.68
er — Relative error, SD— Standard deviation, SEM—Standard error of mean, RSD—relative standard Deviation. aIntra-day precision, b Inter-day precision.
ANIL KUMAR et al.: SPECTROPHOTOMETRIC DETERMINATION OF GANCICLOVIR
Accuracy (% Recovery)
Accuracy of an analysis is determined by systemic error involved. It is defined as the closeness of agreement between the actual (true) value and analytical value and obtained by applying test method for a number of times. Accuracy may often be expressed as % recovery by the assay of known and added amount of analyte (Table 2). It is measure of the exactness of the analytical method. The recovery experiments were carried out in triplicate by spiking preciously analysed samples of the formulation (Method A, 99.75 µg/mL and Method B, 9.75 µg/mL) with three different concentrations of standards. Robustness and Ruggedness
To evaluate the robustness of the methods, reaction time and reagent concentrations were slightly altered with reference to optimum values in spectrophotometry. To check the ruggedness, analysis was performed by four different analysts and on three different spectrophotometers using the same analyst. The robustness and the ruggedness were checked at three different drug levels. The intermediate precision, expressed as per cent RSD, which is a measure of robustness and ruggedness was within the acceptable limits as shown in the Table 2.
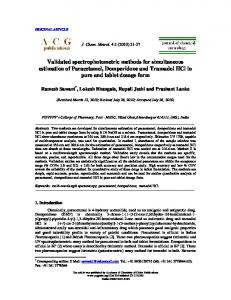
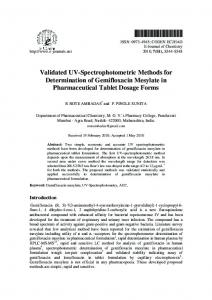
solution. Folin’s reagent have been used for the determination of many amino compounds and a large number of substances of pharmaceutical interest23,24. The proposed method is based on the formation of a Schiff’s base (Method A) and cherry red color complex (Method B), following the reaction of amino group by ganciclovir in the presence of nitric acid (Method A, 401 nm) and in the presence of sodium hydroxide (Method B, 544 nm). The color complexes formed by PDAB and Folin’s reagents with ganciclovir are shown in Figures 1 and 2. Ganciclovir probably affects reduction of 1 or 2 oxygen atoms from the reagents PDAB and Folin’s reagents, thereby producing one more possible reduced species which have characteristic intense color. The effect of different variables such as nature & strength, and optimum volumes of nitric acid for Method A and sodium hydroxide for Method B and reagents, reaction time and order of addition of reactants were studied and optimized for attainment of maximum color and stability of coloured species.
Limits of detection and quantitation
The LOD (limit of detection) and LOQ (limit of quantification) for Method A and Method B by the proposed method were determined using calibration standards. LOD and LOQ were calculated as 3.3 σ/S and 10 σ/S respectively, where S is the slope of the calibration curve and σ is the standard deviation of yintercept of regression equation. Results and Discussion The colour solution formed by urea and reagent consisting of PDAB in ethanol and hydrochloric acid has been introduced as a colorimetric procedure for the determination of urea in sample containing urea, hydrazine, semicarbazide and ammonium ions18. Apart from this, PDAB reagent has been used for the determination of many drugs containing amino group19,20. Sodium 1,2-naphthoquinone-4-sulfonate (Folin's reagent) is a chemical reagent used to determine the amines and amino acids21. The reagent produces a bright red color in alkaline solutions and is also fluorescent22. The main advantage of this procedure of Folin is its simplicity and that the colour is developed at room temperature in slightly alkaline
59
Fig. 1—Mechanism of reaction of ganciclovir with PDAB
60
INDIAN J. CHEM. TECHNOL., JANUARY 2012
Optimization of conditions and absorption Effect of PDAB reagent concentration
It is found that the reaction is dependent on PDAB reagent. The absorbance of the reaction solution increases as the reagent concentration increases, and the highest absorption intensity is attained at 0.5 % (w/v) reagent concentration. A higher reagent concentration up to 1.0% has no effect on the absorption values. Further experiments were carried out using 0.5% (w/v) of the reagent and results obtained are shown in Fig. 3. It is apparent that 2 mL of reagent gives maximum color and hence 2 mL of reagent in a total volume of 10 mL is used throughout the work. Effect of Folin’s reagent concentration
It is found that the reaction is dependent on Folin’s reagent. The absorbance of the reaction solution increases as the Folin’s reagent concentration increases, and the highest absorption intensity is attained at 0.5% (w/v) reagent concentration. A higher reagent concentration up to 1.0% (w/v) has no effect
on the absorption values. Further experiments are carried out using 0.5% (w/v) of the reagent and results obtained are shown in Fig. 4. It is apparent that 2 mL of reagent gives maximum colour and hence 2 mL of reagent in a total volume of 10 mL is used throughout the work. Selection of reaction medium
To find a suitable medium for the reaction, different aqueous acids were used, such as hydrochloric acid, sulphuric acid, nitric acid and acetic acid. The best results are obtained when nitric acid is used (Method A). For Method B, different aqueous bases are used, such as borax, sodium hydroxide, sodium carbonate or bicarbonate, sodium acetate and sodium hydrogen phosphate. The best results are obtained in case of sodium hydroxide.
Fig. 3— Effect of PDAB on formation of color product
Fig. 2— Mechanism of reaction of ganciclovir with Folin’s reagent
Fig. 4—Effect of pH on reaction of ganciclovir with Folin’s reagent
ANIL KUMAR et al.: SPECTROPHOTOMETRIC DETERMINATION OF GANCICLOVIR
Effect of Alkalinity and pH
To generate the nucleophiles from ganciclovir and also to activate the nucleophilic substitution reactions, alkaline medium is necessary. Different inorganic bases are tested, such as sodium hydroxide, disodium hydrogen phosphate, and sodium bicarbonate, all prepared as aqueous solution in concentration range 0.5 – 30 × 10-3 N. Best results are obtained in case of sodium hydroxide, where with other bases either precipitation of white colloid occurs upon diluting the reaction solution with organic solvent, high blank readings, non reproducible results, and/or weak sensitivity are observed. A study for optimization of sodium hydroxide concentration reveals that the optimum concentration is 10 × 10-3 N (Fig. 4). In a separate series of experiments, the influence of pH on the absorbance of ganciclovir-Folin’s reagent product was investigated. The results reveal that the absorbances at pH < 6 are close to 0, indicating that under acidity, ganciclovir have difficulty to react with Folin’s reagent (Fig. 5).
61
(Table 3). This indicates similar accuracy and precision in the analysis of the investigated compounds in their pharmaceutical dosage forms. Conclusion The new methods have been developed and appropriately validated for the assay of ganciclovir using PDAB and Folin’s reagent. These methods are based on the formation of Schiff’s base (Method A) and complexation reaction for Method B and are most sensitive ever reported for ganciclovir in terms of linear range of response and molar absorptivity. An additional advantage of the spectrophotometric methods is that the absorbance is measured at longer wavelengths where the interference from exicipients is less and there is no risk of standardization. From the economical point of view, all the analytical reagents are inexpensive, have excellent shelf life, and are available in any analytical laboratory. Therefore, this method can be recommended for the routine analysis of these drugs in quality control laboratories.
Reaction time and stability of coloured species
The colour reaction is not instantaneous. Maximum colour is developed within 5 min of mixing the reactants and is stable for at least 30 min thereafter. There was no effect of time on the stability of the colour up to 1 h. However a decrease in the absorbance was noted thereafter. Hence, it is recommended that the absorbance should be measured within this time. The results are in agreement with the labeled amounts. For comparison, a conventional UV spectrophotometric method developed in our laboratory was used for parallel comparison. The recovery percentages range from 98.96 to 99.44
Fig. 5— Mechanism of reaction of ganciclovir with Folin’s reagent
Acknowledgement The authors are thankful to the Strides Archo Lab Limited, Bangalore, India for providing the pure drug sample of ganciclovir. References 1 Faulds D & Heel R C, Drugs, 39 (1990) 597-638. 2 Anderson R G, Griffy K G & Jung D, Clin Therapeutics, 17 (1995) 425. 3 Noble S & Faulds D, Drugs, 56 (1998) 115. 4 Nerenberg C, McClung S & Martin, J Pharm Res, 3 (1986) 112. 5 Tadepalli S M, Quinn R P & Averett D R, Antimicrob Agents Chemother, 29 (1986) 93. 6 Henry K, Cantrill H, Fletcher C, Chinnock B J & Balfour H H (Jr), Am J Ophthalmol, 103 (1987) 17. 7 Sarsambi P S, Gowrisankar D, Sonawane A & Faheem A, Int J Chem Tech Res, 2 (2010) 282. 8 Sarsambi P S, Sonawane A, Malipatil S M & Raju S A, J Ind Council Chem, 27 (2010) 202. 9 Wiltink E H H, Stekkinger P & Brakenhoff J A C, Pharmaceutisch Weekblad Scientific Edition, 9 (1987) 261. 10 Sommadossi J P & Bevan R J, Chromatogr Biomed Appl, 414 (1987) 429. 11 McMullin C M, Kirk B & Sunderland J, J Antimicrobial Chemother, 38 (1996) 739. 12 Shibata N, Kitamura A & Yoshikawa Y, Pharm Pharmacol Commun, 6 (2000) 501. 13 Kishino S, Takekuma Y& Sugawara M, J Chromatogr B: Anal Technol Biomed Life Sci, 780 (2002) 289. 14 Teshima D, Otsubo K & Yoshida T, Biomed Chromatogr, 17 (2003) 500. 15 Uslu B, Dogan B & Özkan S A, Anal Chim Acta, 537 (2005) 307.
62
INDIAN J. CHEM. TECHNOL., JANUARY 2012
16 Dao Y J & Jiao Z, Chromatogr B: Anal Technol Biomed Life Sci, 867 (2008) 270. 17 Perrottet N, Beguin A & Meylan P, J Chromatogr B: Anal Technol Biomed Life Sci, 852 (2007) 420. 18 Brown H H, Anal Chem, 31 (1959) 1844. 19 Badiadka N, Krishnamurthy A, Divya Narayana S & Veena K, Eurasian J Anal Chem, 5 (2010) 63. 20 Siddappa K, Mallikarjun M, Reddy P T & Tambe M, Eclet Quím, 33 (2008) 41.
21 Saurina J & Hernández-Cassou S, J Chromatogr A, 676 (1994) 311. 22 Kobayashi Y, Kubo H & Kinoshita T, Anal Biochem, 160 (1987) 392. 23 Navya Sloka S, Gurupadayya B M & Aswani Kumar C, J Pharm Res, 4(1) (2011) 39. 24 Aswani Kumar C, Gurupadayya B M , Navya Sloka S, Chandan R S & Thejaswini J C, Trop J Pharm Res, 10 (2011) 81.