Biotechnology and Bioprocess Engineering 17: 617-623 (2012) DOI 10.1007/s12257-011-0569-6
RESEARCH PAPER
Optimized Biodiesel Production and Environmental Assessment of Produced Biodiesel Muhammad Saqib, Muhammad Waseem Mumtaz, Asif Mahmood, and Muhammad Imran Abdullah
Received: 10 November 2011 / Revised: 7 January 2012 / Accepted: 20 January 2012 © The Korean Society for Biotechnology and Bioengineering and Springer 2012
Abstract Present study deals with the optimization of biodiesel production using rapeseed oil as feedstock and NaOCH3 as a catalyst. Optimization of different reaction parameters, such as catalyst concentration, reaction temperature, reaction time. and alcohol to oil molar ratio, was done using response surface methodology (RSM). The optimal experimental conditions for biodiesel production were as follows: catalyst concentration (%) 0.30, reaction temperature 55oC, molar ratio 6.75, and reaction time 60 min. Under these optimal conditions, 97.5 percentage yield of biodiesel was obtained. The observed and predicted values of rapeseed oil methyl esters (ROMEs) yield showed a linear relationship. The fuel properties such as specific gravity 0.876 ± 0.01, flash point 168 ± 0.48oC, fire point 197.8 ± 0.31oC, pour point -7 ± 0.060oC, cloud point -2 ± 0.10oC kinematic viscosity 4.42 ± 0.26 mm2/sec, and sulfur content 0.002 mg/Kg of the produced biodiesel show the suitability of rapeseed oil biodiesel, as fuel. Moreover, engine performance test of the Rapeseed oil biodiesel (rapeseed oil methyl esters, ROME) was examined. The results showed that CO and particulate matter (PM) emissions of the ROME were lower than those of diesel fuel. NOX emissions of the ROME were lower for B5, B20, B40, and B50, while higher for B80 and B100. These results show the environment benefits of biodiesel.
Muhammad Saqib, Asif Mahmood* Department of Chemistry, University of Gujrat, Gujrat, Pakistan Tel: +92-333-819-2709 E-mail:
[email protected] Muhammad Waseem Mumtaz Department of Chemistry, University of Gujrat, Gujrat, Pakistan. Muhammad Imran Abdullah Institute of Chemistry, University of the Punjab, Lahore, Pakistan
Keywords: optimization, tranesterification, sodium methoxide, response surface methodology, exhaust emission levels
1. Introduction The use of energy has become the basic requirement for human survival, but the present energy resources are limited for the growing rate of world’s population. Presently, the world is facing a twin crisis of fossil fuel depletion and environmental destruction. So there is a dire need for search of alternative fuel sources [1]. Biodiesel, an alternative diesel fuel has attracted attention during the past decade as a renewable, biodegradable, non-toxic, and eco-friendly clean fuel [2,3]. Biodiesel is usually produced by modifying vegetable oils and fats through transesterification reaction [4,5]. The main parameters affecting transesterification are alcohol to oil molar ratio, catalyst concentration, reaction temperature and time, contents of free fatty acids, and water in the oils and fats [6,7]. Response surface methodology (RSM) is compilation of statistical and mathematical techniques highly valuable for development, modification, and optimization of various processes [8]. Rapeseed (Brassica napus) is widely cultivated in Pakistan and throughout the world for the production of animal feed, vegetable oil, and biodiesel. The seeds contain about 40% oil and after extraction of oil, a meal with about 38 ~ 43% protein is obtained. Rapeseed oil is the preferred oil stock for biodiesel production because rapeseed produces more oil per unit of land area compared to other oil sources. Rapeseed is one of the most important oilseeds in the world, ranking fourth with respect to production after soybean, palm, and cottonseed [9].
618
Biotechnology and Bioprocess Engineering 17: 617-623 (2012)
Commonly used alkaline catalysts include sodium hydroxide (NaOH), potassium hydroxide (KOH), sodium methoxide (NaOCH3), and potassium methoxide (KOCH3). Freedman et al. [6] showed that NaOCH3 is a more effective catalyst formulation than NaOH and almost equal oil conversion was observed at 6:1 alcohol-to-oil molar ratio for 1% wt NaOH and 0.5% wt NaOCH3; whereas Ma et al. [10] observed NaOH was a better catalyst than NaOCH3 in transesterification of beef tallow. Vicente et al. [11] reported higher yields with methoxide catalysts, but the rate of reaction was highest for NaOH and lowest for KOCH3 at 65oC, a methanol-to-oil ratio of 6:1, and a catalyst concentration of 1% wt. The present study was carried out with the objective primarily to use response surface methodology (RSM) for the optimization of reaction parameters, including catalyst concentration, alcohol to oil molar ratio, reaction temperature, and reaction time for biodiesel production; rapeseed oil was used as feed stock and NaOCH3 as alkaline catalysts. A second objective monitor exhaust emission behavior of produced biodiesel.
reaction time, 45 to 65oC for reaction temperature, while 4.50 to 9.0 for alcohol to oil molar ratio (Table 2). A 24 full-factorial CCRD design is employed using 4 variables with 3 different levels, a total of 30 experiments. The transesterification of rapeseed oil was executed in a 3 neck flasks furnished with a thermometer, a chiller, condenser, a magnetic stirrer, and a heating plate using NaOCH3 as the alkaline catalyst and methanol as the alcohol. For each experiment, transesterification was conducted at specified reaction conditions according to CCRD and %the percentage yield of rapeseed oil biodiesel (rapeseed oil fatty acid methyl esters) was calculated for each experiment [13,14]. The second-order multiple regression model is used for optimization of biodiesel yield on the basis of data obtained from the CCRD. Optimized reaction parameters and biodiesel yield were estimated from the experimental results and Response Surface Plots were used to ascertain the results. The model can be written as Table 2. Experimental data for central composite response surface second-order design Catalyst Run concentration (%)
2. Materials and Methods 2.1. Collection, extraction, and physico-chemical characterization of rapeseed oil Rape seeds were collected from District Gujrat, Pakistan. Extraction of rapeseed oil from their seeds was performed using the soxhlet extraction method and n-hexane used as a solvent [11,12]. Rapeseed oil was pre-analyzed for the following, using standard methods: acid value, peroxide value, iodine value, specific gravity, refractive index, and sponification value. 2.2. Experimental design The effect of the different variables, such as catalyst concentration % (A), reaction temperature oC (B), methanol: oil molar ratio (C) and reaction time (D), on percentage yield of biodiesel were analyzed using central composite response surface design (CCRD). The levels of different reaction parameters used for the current study ranged from 0.30 to 1.50% for catalyst concentration, 30 to 90 min for Table 1. Physicochemical properties of rapeseed oil Sr.#
Parameters
Values
1 2 3 4 5 6
Acid value (mg KOH/g) Iodine value (g I2/100 g) Peroxide value (mmol/kg) Saponification value (mg of KOH/g) refractive index specific gravity
0.16 ± 0.35 103.5 ± 0.25 4.2 ± 0.26 176.7 ± 0.19 1.476 ± 0.01 0.912 ± .003
1 2 3 4 5 6 7 8 9 10 11 12 13 14 15 16 17 18 19 20 21 22 23 24 25 26 27 28 29 30
0.9 1.5 0.3 1.5 0.9 0.3 1.5 0.9 0.3 1.5 0.9 1.5 1.5 0.9 0.9 0.9 0.9 0.3 0.9 0.9 1.5 0.3 1.5 0.3 0.9 0.9 0.3 1.5 0.3 0.3
Reaction temperature (oC)
Molar ratio
Time (min)
%age Yield actual
55 65 65 65 55 45 55 65 55 65 55 45 65 55 55 55 55 65 45 55 45 65 45 45 55 55 45 45 65 45
6.75 9.00 4.50 4.50 6.75 9.00 6.75 6.75 6.75 9.00 6.75 4.50 4.50 6.75 9.00 4.50 6.75 9.00 6.75 6.75 6.75 4.50 9.00 4.50 6.75 4.50 9.00 9.00 9.00 4.50
60 30 30 30 60 30 60 60 60 90 30 30 90 60 60 60 90 30 60 60 90 90 30 30 60 60 90 90 90 90
89.9 80.2 86.0 70.6 90.2 91.7 77.5 88.5 97.5 78.8 90.5 74.2 70.5 88.9 89.0 80.5 91.7 90.0 89.8 89.7 75.0 88.0 80.0 91.7 87.5 81.2 90.0 78.2 93.2 86.8
Optimized Biodiesel Production and Environmental Assessment of Produced Biodiesel
619
Table 3. Models with their significance, lack of fit, R-square, and adjusted R-square values Model Linear 2F1 Quadratic Cubic
Model significance (P-value) 0.0001 0.8817 0.0001 0.0815 k
k
2
k
Yyield = b0 + ∑ biXi + ∑ biXi + ∑ i=1
i=1
Lack of fit (P-value) 0.0021 0.0012 0.0987 0.2792
k
∑
bijXiXj + e
(Eq. 1)
i=1 j=1 i>j
2.3. Fuel properties of produced biodiesel The following properties of the rapeseed biodiesel produced was determined: specific gravity (ASTM D 5002), kinematic viscosity (ASTM D 445), flash point (ASTM D 93), cloud point (ASTM D 2500), pour point (ASTM D 97) and sulfur content (ASTM D 4294). 2.4. Monitoring of CO, NOx (NO+ NO2), and PM The comparative study of percentage change in exhaust emission levels of rapeseed biodiesel and blends, such as (B5, B20, B40, B50, B80, and B100) with conventional diesel was carried out. For this purpose Diesel Engine (Model SD-1110) with Power 20 HP and weight 210 KG was used. The monitoring of exhaust emission levels was carried out using diesel engine stacks. All measurements were taken in triplicate, while the engine was operating at its full load at different times to examine the emission levels of various pollutants, i.e. CO, NOX, and PM. For the monitoring of CO & NOX (NO+ NO2) and Particulate Matter Flue Gas Analyzer (LANCOM-III) and Iso-kinetic The Casella (Particulate sampling system Instrument) were used respectively.
R-square 0.7404 0.7683 0.9739 0.9956
Adjusted R-square 0.6988 0.6463 0.9496 0.9787
Suggested Aliased
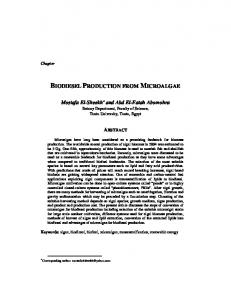
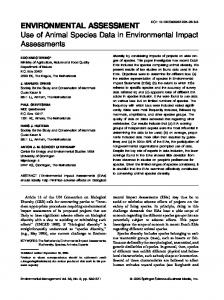
the response was explained by applying multiple regression analysis. Final equation in terms of actual factors is: Biodiesel Yield (%age) = 89.558 -7.738 (A) -0.123 (B) +3.118 (C) -0.672 (D) + 0.318 (A B) + 1.398 (A C) -0.656 (A D) + 0.439 (BC) + 1.293 (BD) + 0.523 (C D) -2.578 (A2) -0.928 (B2) -4.791 (C2) + 1.022 (D2) (Eq. 2) From different models such as the linear, 2F1, quadratic and cubic, quadratic is selected on the bases of p-values, Lack of fit test and R-Square. A P-value (P < 0.0001) indicates the signifficance of quadratic model. In addition, absence of any lack of fit (P > 0.05) strengthened the reliability of the model. R2, which was defined as the ratio of the explained variation to the total variation, was a measure of the degree of fit [15]. By referring to Table 3, the R2 value for the quadratic model was 0.9739, which was closed to 1. This suggested that the predicted second order polynomial model defined well, the real behavior of the system. In addition, the value of adjusted R2 (0.9496) was very high to advocate for a high significance of the model. The plot between predicted vs. actual (Fig. 1) is a good tool to study the significance of suggested model. The responses predicted from the empirical model are in agreement with the observed values in the range of the operating variables. Maximum points are on the line. The normal probability plot is shown in Fig. 2. The general impression from examining this display is that as the plot
3. Results and Discussion 3.1. Physico-chemical characteristics/quality parameters of rapeseed oil For quality evaluation of rapeseed oil, physico-chemical characterization was carried out before transesterification. The acid value, peroxide value and iodine value of rapeseed oil were found to be 0.16 ± 0.35 mg KOH/g, 4.2 ± 0.26 mmol/kg, and 103.5 ± 0.25 g per 100 gram, respectively while specific gravity, sponification value and refractive index were 0.912 ± 0.003, 176.7 ± 0.19 mg KOH/g, and 1.476 ± 0.01, respectively. 3.2. Response surface methodology (RSM) 3.2.1. Fitting the model Relationship between the tested independent variables and
Comments
Fig. 1. Plot of actual yield vs. predicted yield.
620
Biotechnology and Bioprocess Engineering 17: 617-623 (2012)
Table 4. Analysis of variance for response surface quadratic model Source
Fig. 2. Normal probability plot of residuals.
Model Linear A-Catalyst Concentration B-reaction Temperature C-Molar Ratio D-Time Interactions AB AC AD BC BD CD Quadratic A2 B2 C2 D2 Lack of Fit
F value
P-value
40.04