Optimized Data Compression and Denoising with PCA Using a Kurtosis Based Selection Criterion. G. Reishofer1, S. Ropele2, and R. Stollberger3. 1Department ...
Optimized Data Compression and Denoising with PCA Using a Kurtosis Based Selection Criterion G. Reishofer1, S. Ropele2, and R. Stollberger3 Department of Radiology, Medical University Graz, Graz, Austria, 2Department of Neurology, Medical University Graz, Austria, 3Department of Radiology, Medical University Graz, Austria
1
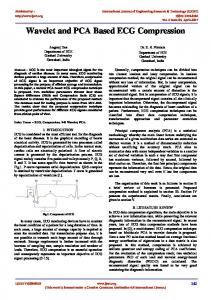
Introduction: Principal Component Analysis (PCA) is a classic technique in data analysis and signal processing. This linear transformation has been used for feature extraction, data compression (1), denoising (2) and as a pre-processing step for Independent Component Analysis (ICA) applications (3). The goal is to find a new data representation with less redundancy which is an optimal compromise between compression factor and information content of the data. Thus far, candidate Principal Components (PCs) were selected manually by skilled operators after visual inspection or by applying a cut-off criterion with a constant threshold. Since the number of PCs which are removed for data compression is crucial, an adaptive, operator independent selection criterion is necessary to guarantee reproducible results. Since the first few PCs represent mixtures of tissue signals and the last few PCs represent noise, the optimum number of PCs to be removed is given if the information content of the reconstructed DSC-MRI time series is a maximum and noise is a minimum. Using more than the optimal number of PCs for reconstruction result in insufficient noise suppression, using less PCs causes a th loss of information due to the removed tissue signal components. In this work we propose a novel approach based on 4 order statistics, to find the optimal number of PCs automatically. Methods: In-vivo DSC-MRI data were obtained from routine examinations on three different systems. A clinical 1.5T MRI scanner (Philips Gyroscan NT, Philips Medical Systems, The Netherlands) with a bird cage head coil and a multi-shot gradient echo EPI sequence with two echoes was used. The scan parameters were FOV/TR/TE1/TE2/α=230-240mm/428.5ms/7.6ms/28ms/45° with an image matrix of 128x85, Rectangular-Field-of-View=70%, slice thickness=6mm. Fifty time points with a temporal resolution of 1.7s were measured. A clinical scanner at 1.5 T (Siemens Symphonie, Siemens Medical, Germany) with an 8 channel head coil (Medical Device, USA) and Single Shot EPI using generalized auto calibrating partially parallel acquisitions (GRAPPA). The scan parameters were FOV/TR/TE/α=230mm/1320ms/28ms/60° with an image matrix of 128x128, slice thickness=5.4mm and parallel imaging factor=2. Sixty time points were acquired with a temporal resolution of 1.32s. For the third setup a 3.0T MRI scanner (Siemens Tim Trio, Siemens Medical, Germany) with an 12 channel head coil (Siemens Medical, Germany) and a Single Shot EPI sequence was used with the following parameters: FOV/TR/TE/α=230mm/1180ms/28ms/60° with an image matrix of 128x128, slice thickness=5mm and a temporal resolution of 1.19s for 60 time points. In a preprocessing step the background was eliminated from the DSC-MRI time series using a threshold technique. The application of PCA on the segmented DSC-MRI resulted in 50 to 60 PCs. Inverting the PCA transformation with a reduced set of n PCs (n = 1,2,…,25), the DSC-MRI time series were reconstructed. Each of the 25 reconstructed time series were subtracted from an original DSC-MRI data set. The calculated differential data were evaluated subsequently using kurtosis as a simple statistical quantity for indicating nongaussianity. All post processing was performed offline on a 2.2 GHz Pentium IV PC. Software for post processing was developed in house and programmed with Interactive Data Language (IDL 6.0, Research Systems Inc., USA). Results: Plotting the kurtosis against the number of PCs which are used for reconstructing the DSC-MRI time series shows a function with a distinct global minimum for all three measurements (Fig. 1). The kurtosis minimum in the differential data was found when reconstructing 8 PCs using the single shot EPI sequence at 3T, 12 PCs for the multi shot GE EPI at 1.5T and 13 PCs using the single shot EPI at 1.5T. A Minimum kurtosis of the differential data means, that only PCs containing noise have been removed before restoring the DSC-MRI time series (Fig 2a). Using only two PCs for reconstructing leads to a remaining fraction of tissue in the differential data and therefore to a higher kurtosis (Fig 2b). If more PCs are used for reconstruction the noise can not be removed and the differential data show a very narrow probability density function with higher kurtosis. The filtering properties of PCA for the optimal number of PCs are shown in Fig. 3 Figure 2: The differential images show reconstructed DSC-MRI data subtracted from the original date using 9 PCs (a) and 2 PC (b) for the reconstruction. While (a) shows the remaining noise, in (b) the remaining tissue components can be observed (marked by the arrows).
Figure 1: Minimum of kurtosis dependent from the number of PCs which were used for reconstruction.
Conclusion: Temporal resolution and SNR have a crucial effect on the information content of the calculated PCs. Common approaches for selecting the number of PCs like the criterion of Jolliffe or Kaiser (4,5) which use the eigenvalues of the covariance matrix as a selection criterion are not suitable because the number of selected PCs is often too small. Setting the threshold to a fixed level to explain a defined quantity of the variances is a user dependent approach. However, the choice of the threshold is subjective and can lead to irreproducible results. The optimized PCs selection criterion is a method to select the optimal number of PCs automatically based on statistical considerations. We showed that the algorithm reliably found the optimal number of PCs for DSC-MRI data from different systems. Thus we recommend the optimized PCs selection criterion as the superior method for selecting PCs.
Figure 3: Concentration time course for DSC-MRI data and PCA filtered reconstructed data for an optimal number of selected PCs.
References: (1) Hyvärinen A, Oja E. A fast fixed-point algorithm for independent component analysis. Neural Computation, 1997;9:1483-1492. (2). Martel AL, Moody AR. The use of PCA to smooth functional MR images. In: Taylor CJ, Noble JA, Brady JM, (editors). Medical Image Understanding and Analysis, Oxford, UK: BMVA. 1997:13-16. (3). G. Reishofer, F. Fazekas, S. Keeling, R. Stollberger. Minimizing Macro Vessel Signal in Hemodynamic Parameter Maps Using Independent Component Analysis. Proc. Intl. Soc. Mag. Reson. Med. (2004);12:364 (4). Jolliffe I. Discarding Variables in Principal Component Analysis. Applied Statistics 1972;21:160173. (5). Kaiser HF.The application of electronic computers to factor analysis. Educ Psychol Meas 1960; 20:141151
Proc. Intl. Soc. Mag. Reson. Med. 15 (2007)
529