International Journal of Computer Science & Information Technology (IJCSIT) Vol 3, No 5, Oct 2011
OPTIMIZED FUZZY LOGIC APPLICATION FOR MRI BRAIN IMAGES SEGMENTATION Indah Soesanti1, Adhi Susanto1, Thomas Sri Widodo1, Maesadji Tjokronagoro2 1
Department of Electrical Engineering and Information Technology, Faculty of Engineering, Gadjah Mada University, Yogyakarta, Indonesia
[email protected] 2
Faculty of Medicine, Gadjah Mada University, Yogyakarta, Indonesia
ABSTRACT In this paper, an optimized fuzzy logic method for Magnetic Resonance Imaging (MRI) brain images segmentation is presented. The method is a technique based on a modified fuzzy c-means (FCM) clustering algorithm. The FCM algorithm that incorporates spatial information into the membership function is used for clustering, while a conventional FCM algorithm does not fully utilize the spatial information in the image. The advantages of the algorithm are that it is less sensitive to noise than other techniques, and it yields regions more homogeneous than those of other methods. Originality of this research is the methods applied on a normal MRI brain image and MRI brain images with tumor, and analyze the area of tumor from segmented images. The results show that the method effectively segmented MRI brain images with spatial information, and the segmented MRI normal brain image and MRI brain images with tumor can be analyzed for diagnosis purpose. In order to identify the area of abnormal mass of MRI brain images with tumor, it is resulted that the area is identified from 8.38 to 25.57 cm2.
KEYWORDS Adaptive Image Segmentation, Optimized Fuzzy Logic, MRI Brain Image, Fuzzy Membership Function
1. INTRODUCTION Image segmentation is one of the most important tasks to extract information in image processing. To satisfy increasing requirement of image segmentation, a variety of segmentation methods have been developed over past several years. FCM (Fuzzy c-means) is unsupervised technique that has been successfully applied to future analysis, clustering, and classifier designs in the fields such as astronomy, geology, medical imaging, target recognition, and image segmentation. An image can be represented in various feature spaces, and the FCM method classifies the image by grouping similar data points in the feature space into clusters. There has been considerable interest recently in the use of fuzzy segmentation methods, which retain more information from the original image than hard segmentation methods (e.g. Bezdek et al. [1], Udupa et al. [2], Pham [3], Masoole and Moosavi [4]). The fuzzy C-means method (FCM), in particular, can be used to obtain a segmentation via fuzzy pixel classification. Unlike hard classification methods which force pixels to belong exclusively to one class, FCM allows pixels to belong to multiple classes with varying degrees of membership. This approach allows additional flexibility in many applications and has recently been used in processing of magnetic resonance image (MRI) [5]. For example, in their segmentation of MRI brain images, Pham et al. [6] thresholded the FCM memberships in order to extract pixels which a high confidence of correct classification. Xu et al. [7] used deformable surfaces that converged to the peaks of the memberships. The FCM method, however, does not address the intensity inhomogeneity artifact that occurs in nearly all MRI [8]-[9]. In case of tumor detection in MRI, Kekre et al. [10] used DOI : 10.5121/ijcsit.2011.3512
137
International Journal of Computer Science & Information Technology (IJCSIT) Vol 3, No 5, Oct 2011
morphological segmentation and proposed vector Quantization method for tumor detection in MRI images. From results it is observed that proposed method gives far better results compared to morphological segmentation. Morphological segmentation extracts other regions with tumor region. Originality of this research is the optimized fuzzy logic method based on FCM clustering applied on a normal MRI brain image and MRI brain images with tumor, and analyze the area of tumor from segmented images.
2. FUNDAMENTAL THEORY 2.1. Magnetic Resonance Imaging Magnetic Resonance Imaging (MRI) is an imaging technique used primarily in medical settings to produce high quality images of the inside of the human body. In order to preview about MRI, in this section we give a brief description of the principles of MRI which are refered to [11]. In MRI, the image is a map of the local transverse magnetization of the hydrogen nuclei. This transverse magnetization in turn depends on several intrinsic properties of the tissue. The MR phenomenon relies on the fundamental property that protons and neutrons that make up a nucleus possess an intrinsic angular momentum called spin. When protons and neutrons combine to form nucleus, they combine with oppositely oriented spins. Thus, nuclei with an even number of protons and neutrons have no net spin, whereas nuclei with an odd number of protons or neutrons possess a net spin. Hydrogen nuclei have an NMR signal since its nucleus is made up of only a single proton and possess a net spin. The human body is primarily fat and water, which have many hydrogen atoms. Medical MRI primarily images the MRI signal from the hydrogen nuclei in the body tissues. The net spin of the nucleus around its axis gives it an angular moment. Since the proton is a positive charge, a current loop perpendicular to the rotation axis is also created, and as a result the proton generates a magnetic field. The joint effect of the angular moment and the self generated magnetic field gives the proton a magnetic dipole moment parallel to the rotation axis. Under normal condition, one will not experience any net magnetic field from the volume since the magnetic dipole moments are oriented randomly and on average equalize one another. When placed in a magnetic field, a proton with its magnetic dipole moment processes around the field axis. The frequency of this precession, v0, is the resonant frequency of NMR and is called the Larmor frequency. The precession frequency is directly proportional to the strength of the magnetic field, i.e. v0 = gB0
(1)
where B0 is the main magnetic field strength, and g is a constant called gyromagnetic ratio which is different for each nucleus (42.56 MHz/Tesla for protons). Given a specimen, the application of a magnetic field B0 would create a net equilibrium magnetization M0 per cubic centimeter, which is aligned to the B0 field. The M0 is the net result of summing up the magnetic fields due to each of the H nuclei and is directly proportional to the local proton density (or spin density). However, M0 is many orders of magnitude weaker than B0 and is not directly observable. By tipping M0 away from the B0 field axis with an appropriate RF pulse having a frequency equals to the Larmor frequency, a longitudinal magnetization component ML and a transverse magnetization component MT is produced. When the RF pulse is turned off, the longitudinal magnetization component ML recovers to M0 with a relaxation time T1, and the transverse magnetization component MT dephases and decays to zero with a relaxation time T2 1. During relaxation, the protons lose energy by emitting their own RF signal with the amplitude proportional to MT. This signal is referred to as the free-induction decay (FID) response signal. T2 indicates the time constant required for the FID response signal from 138
International Journal of Computer Science & Information Technology (IJCSIT) Vol 3, No 5, Oct 2011
a given tissue type to decay. The FID response signal is measured by an RF coil placed around the object being imaged. When MR images are acquired, the RF pulse is repeated at a predetermined rate. The period of the RF pulse sequence is the repetition time, TR. The FID response signals can be measured at various times within the TR interval. The time between which the RF pulse is applied and the response signal is measured is the echo delay time, TE. The TE is the time when the spin echo occurs due to the refocusing effects of the 180 degree refocusing pulse applied after a delay of TE/2 from the RF pulse. The TR and TE control how strongly the local tissue relaxation times, T1 and T2, affect the signal. By adjusting TR and TE the acquired MR image can be made to contrast different tissue types.
2.2. Image Segmentation Segmentation subdivides an image into its constituent regions or objects [12]. The level of detail to which the subdivision is carried depends on the problem being solved. That is, segmentation should stop when the objects or regions of interest in an application have been detected. Segmentation of nontrivial images is one of the most difficult tasks in image processing. Segmentation accuracy determines the eventual success or failure of computerized analysis procedures. For this reason, considerable care should be taken to improve the probability of accurate segmentation. Much past work on medical image segmentation relied strictly on human graphical interaction to define regions, using methods such as manual slice editing, region painting and interactive thresholding. Rajapakse [13] classified the different methods of image segmentation as four main categories. (1) The classical methods such as thresholding region growing and edge based techniques. (2) The statistical methods such as the maximum-likelihood-classifier (MLC). These methods are basically supervised and depend on the prior model and its parameters. Vannier et al. [14] reported satisfactory preliminary results with Bayesian MLC. Ozkan et al. [15] made a comparison between the MLC and the neural network classifier which showed the superiority of the neural network. New methods of segmentation that could be classified as statistical methods have been introduced in the past few years. Hansen [16] used a probabilistic supervised relaxation technique for segmenting 3D medical images. The method introduced the use of cues to guide the segmentation. Those cues marked by the user have the mean and standard deviation as description parameters. (3) The neural networks methods one example of which is the work of Ahmed et al. [17] who used a two stages neural network system for CT/MRI image segmentation. The first stage is a self-organized principal component analysis (SOPCA) network and the second stage consists of a self-organizing feature map (SOFM). The results obtained compare favorably with the classical and statistical methods. (4) The Fuzzy Clustering methods. In [18] a comparison between the fuzzy clustering and neural network techniques in segmenting magnetic resonance images of the brain debated for the need of unsupervised technique in segmentation which was provided using the unsupervised fuzzy cmean algorithm. However the long time taken by the fuzzy c-mean algorithm was documented.
3. FUZZY C-MEANS CLUSTERING The FCM algorithm assigns pixels to each category by using fuzzy memberships. Let X=(x1, x2,.,xN) denotes an image with N pixels to be partitioned into c clusters, where xi represents multispectral (features) data. The algorithm is an iterative optimization that minimizes the cost function defined as follows [19]:
139
International Journal of Computer Science & Information Technology (IJCSIT) Vol 3, No 5, Oct 2011 N
c
J = ∑∑ u ijm || x j − vi || 2
(2)
j =1 i =1
where uij represents the membership function of pixel xj in the ith cluster, vi is the ith cluster center, and m is a constant. The parameter m controls the fuzziness of the resulting partition, and m = 2 is used in this study. The cost function is minimized when pixel close to the centroid of their clusters are assigned high membership values, and low membership values are assigned to pixels with data far from the centroid. The membership function represents the probability that a pixel belongs to a specific cluster. In the FCM algorithm, the probability is dependent solely on the distance between the pixel and each individual cluster center in the feature domain. The membership functions and cluster centers are updated by the following:
u ij =
1 || x j − vi ∑ k =1 || x j − v k c
|| ||
2 /( m −1)
(3)
and N
∑u vi =
m ij
xj
j =1
(4)
N
∑u
m ij
j =1
where uij ∈ [0, 1]. Starting with an initial guess for each cluster center, the FCM converges to a solution for vi representing the local minimum or a saddle point of the cost function. Convergence can be detected by comparing the changes in the membership function or the cluster center at two successive iteration steps. One of the important characteristics of an image is that neighboring pixels possess similar feature values, and the probability that they belong to the same cluster is great. This spatial relationship is important in clustering, but it is not utilized in a standard FCM algorithm. To exploit the spatial information, a spatial function is defined as.
hij =
∑u
(5)
ik k∈NB ( x j )
where NB(xj) represents a square window centered on pixel xj in the spatial domain. A 3 x 3 window was used throughout this work. Just like the membership function, the spatial function hij represents the probability that pixel xj belongs to ith cluster. The spatial function of a pixel for a cluster is large if the majority of its neighborhood belongs to the same cluster. The spatial function in incorporated into membership function as follows: ' ij
u =
u ijp hijq
(6)
c
∑u
p kj
q kj
h
k =1
140
International Journal of Computer Science & Information Technology (IJCSIT) Vol 3, No 5, Oct 2011
where p and q are parameters to control the relative importance of both functions. In a homogenous region, the spatial functions fortify the original membership, and the clustering result remains unchanged. However, for a noisy pixel, this formula reduces the weighting of a noisy cluster by the labels of its neighboring pixels. As a result, misclassified pixels from noisy regions or spurious blobs can easily be corrected. The spatial FCM with parameter p and q is denoted FCMSp,q. Note that FCMS1,0 is identical to the conventional FCM. The clustering is a two-pass process at each iteration. The first pass is the same as that in standard FCM to calculate the membership function in the spectral domain. In the second pass, the membership information of each pixel is mapped to the spatial domain, and the spatial function is computed from that. The FCM iteration proceeds with the new membership that is incorporated with the spatial function. The iteration is stopped when the maximum difference between two cluster centers at two successive iterations is less than a threshold (ε=0,02). After the convergence, defuzzification is applied to assign each pixel to a specific cluster for which the membership is maximal.
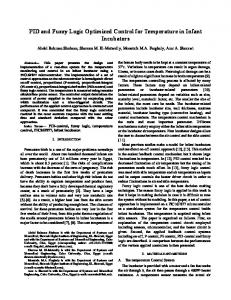
4. EXPERIMENTAL RESULTS 4.1 Segmentation of MRI Brain Image In this research, MRI brain image is segmented using optimized fuzzy logic technique that is incorporated into the spatial information. The technique is a method based on a modified fuzzy c-means (FCM) clustering algorithm. First of all, we have experiment the normal MRI brain image, as shown in Figure 1. And then, we have experiment the MRI brain image with tumor, as shown in Figure 3. In order to test the powerful of the method, we analize the results of image segmentation that are related to noise reduction. Figure 1 shows the 256x256 grayscale original normal MRI1 brain image. Figure 1(a) and (b) show the T1- and T2-weighted MRI1 images, respectively. Figure 2(a) and (b) show the results of the optimized fuzzy logic method that is incorporated into the spatial information with parameters p=1 and q=2.
(a) (b) Figure 1. Original Normal MRI1 Brain images: (a) T1-weighted MRI1 image and (b) T2-weighted MRI1 image.
141
International Journal of Computer Science & Information Technology (IJCSIT) Vol 3, No 5, Oct 2011
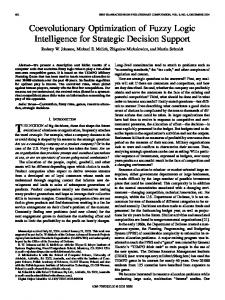
(a) (b) Figure 2. Segmented Normal MRI1 Brain images: (a) Segmented T1-weighted MRI1 image and (b) Segmented T2-weighted MRI1 image. As can be seen in the segmented images in Figure 2, lesion or abnormal mass is not identified, and the ventricular system is not extensive and it is a median. So, the image is a normal brain MRI image.
(a)
(b)
(c)
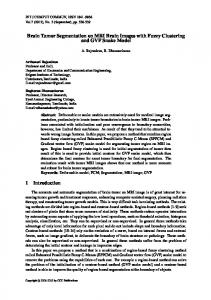
(d) (e) (f) Figure 3. Original MRI brain images with tumor: (a) MRI2, (b) MRI3, (c) MRI4, (d) MRI5, (e) MRI6, (f) MRI7. Figure 3(a) to (f) show the 256x256 original MRI brain images with tumor used for this study [20], while Figure 4(a) to (f) demonstrate the results of segmentation of each images from Figure 3. Figure 3(a) shows an original axial proton density image of MRI2 demonstrating the lesion as solid, with a high signal, while Figure 4(a) shows the result of segmentation of the image. Figure 3(b) and Figure 4(b), MRI3, show the tumor arising in the pons. The fourth ventricle is displaced and slightly enlarged. Figure 3(c), a noncontrast, T2-weighted axial image of MRI4, demonstrates the presence of the tumor and the increased signal on T2 weighting of 142
International Journal of Computer Science & Information Technology (IJCSIT) Vol 3, No 5, Oct 2011
the CSF-filled, resected space. The three planes allow excellent delineation of the residual tumor versus the tumor volume that has been resected. They also allow evaluation of the area of postsurgical charge and disruption of the blood-brain barrier in an area where the tumor has been resected and shows characteristic enhancement.
(a)
(b)
(c)
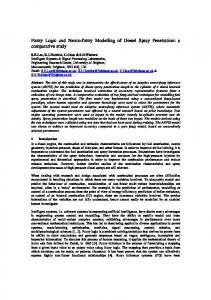
(d) (e) (f) Figure 4. (a) Segmented MRI2, (b) segmented MRI3, (c) segmented MRI4, (d) segmented MRI5, (e) segmented MRI6, (f) segmented MRI7. Figure 3(d) is an axial image of MRI5 demonstrating the tumor. The extent of the tumor can be appreciated by its sharp contrast to the normal surrounding tissue. The ventricular distorsion can also be appreciated. Figure 3(e), MRI6, show tumor involving the thalamic and basal ganglia region of the right. The delineation of the tumor involvement and the normal surrounding brain tissue is very easily done, and there is good tumor demaraction. Figure 3(f), MRI7, demonstrates a large left frontoparietal tumor. The size and surrounding edema are fairly marked. There is also evidence of spread into the midline body of the corpus collosum.
4.2 Analysis of the Area of Tumor Radiologic diagnosis is based on the multiparametric imaging profile (CT, conventional MRI, advanced MRI) [21]. Tumor characterization is difficult because neoplastic tissue is often heterogeneous in spatial and imaging profiles, and for some imaging techniques often overlaps with normal tissue (especially the infiltrating part) [21]. Therefore, in this study we also apply the optimized fuzzy logic method to segment six 256x256 MRI brain images with tumor (i.e. MRI2, MRI3, MRI4, MRI5, MRI6, and MRI7), as shown in Figure 3 [20]. Application of the the optimized fuzzy logic method in segmentation of the images is in order to analysis of the area of tumor. Figure 4 shows the 256x256 segmented MRI2 to MRI7 images, respectively.
143
International Journal of Computer Science & Information Technology (IJCSIT) Vol 3, No 5, Oct 2011
Table 1. Area of tumor Images
Areas (%)
Area (cm2)
MRI2
3.12
8.38
MRI3
6.26
16.83
MRI4
6.28
16.88
MRI5
6.37
17.12
MRI6
6.46
17.37
MRI7
9.51
25.57
Table 1 shows the area of abnormal mass of segmented MRI images. The results are MRI images identified tumors of 8.38 to 25.57 cm2 or 3.12 to 9.51% of the areas in percentage. In the brain tumor, the bigger area the higher grade of tumor.
5. CONCLUSIONS In this research, we use optimized fuzzy logic technique based on FCM clustering that incorporates the spatial information into the membership function to improve the segmentation results. The membership functions of the neighbors centered on a pixel in the spatial domain are enumerated to obtain the cluster distribution statistics. These statistics are transformed into a weighting function and incorporated into the membership function. This neighboring effect reduces the number of spurious blobs and biases the solution toward piecewise homogeneous labeling. The new method use to analyze normal MRI brain and MRI brain images with tumor. We applied the technique on normal MRI brain image and on MRI brain images with tumor. The results showed that the technique effectively segmented Magnetic Resonance Imaging (MRI) brain image with spatial information. And, the segmented a normal MRI brain image and MRI brain images with tumor can be analized succesfully. The area of abnormal mass of MRI brain images with tumor is identified from 8.38 to 25.57 cm2.
REFERENCES [1] [2]
[3]
[4] [5]
[6] [7]
J. Bezdek. L. Hall. and L. Clarke. “Review of MR image segmentation using pattern recognition”. Medical Physics. vol. 20. 1993. pp. 1033–48. J. K. Udupa. L. Wei. S. Samarasekera. Y. Miki. M. A. van Buchem. and R. I. Grossman. "Multiple sclerosis lesion quantification using fuzzy-connectedness principles." IEEE Transactions on Medical Imaging. vol. 16. 1997. pp. 598-609. D.L. Pham. “Unsupervised Tissue Classification in Medical Images using Edge-Adaptive Clustering”. Proceedings of the 25th Annual International Conference of the IEEE EMBS. Cancun. Mexico. Sep. 17-21. 2003. M.G. Masoole and A. S. Moosavi. “An Improved Fuzzy Algorithm for Image Segmentation”. World Academy of Science, Engineering and Technology Vol. 38. 2008. Pp. 400-404. L. Jiang and W. Yang. “A Modified Fuzzy C-Means Algorithm for Segmentation of Magnetic Resonance Images”. Proc. VIIth Digital Image Computing: Techniques and Applications. Sydney 10-12 Dec. 2003. D.L. Pham and J.l. Prince. “Adaptive fuzzy segmentation of magnetic resonance images”. IEEE Trans. in Medical Imaging. 1999. Vol. 18. pp. 737–752. C. Xu. D.L Pham. and J.L. Prince. “Finding the brain cortex using fuzzy segmentation. isosurfaces. and deformable surfaces”. In Proc. XVth Int. Conf. on Inform. Processing in Medical Imaging. (IPMI 1997). pp. 399-404. 144
International Journal of Computer Science & Information Technology (IJCSIT) Vol 3, No 5, Oct 2011 [8] [9] [10]
[11]
[12] [13] [14] [15]
[16] [17] [18]
[19]
[20] [21]
S.R. Kannan. “Segmentation of MRI Using New Unsupervised Fuzzy C Mean Algorithm. ICGSTGVIP Journal. Vol. 5. No.2. Jan. 2005. S. Alizadeh. M. Ghazanfari. and M. Fathian. “Using Data Mining for Learning and Clustering FCM”. International Journal of Computational Intelligence. Vol. 4. No. 2. Spring 2008. H. B. Kekre. T. Sarode. and K. Raut. “Detection of Tumor in MRI Using Vector Quantization segmentation”. International Journal of Engineering Science and Technology. Vol. 2(8), 2010, pp. 3753-3757. A. Wee, C. Liew, and H. Yan. “Current Methods in the Automatic Tissue Segmentation of 3D Magnetic Resonance Brain Images”. Current Medical Imaging Reviews, Vol. 2, No. 1, 2006, pp. 1-13. R.C. Gonzalez and R.E. Woods. “Digital Image Processing”. Prentice Hall, New Jersey, 2008. J.C. Rajapakse. J.N. Giedd. and J.L. Rapoport. “Statistical Approach to Segmentation of Single Channel Cerebral MR Images”. IEEE Trans. on Medical Imaging. Vol.16. No.2. April 1997. M.W. Vannier. C.M. Speidel. and D.L. Rickman. “Magnetic resonance imaging multi spectral tissue classication”. Journal of NIPS. vol.3. Aug. 1991. M. Ozkan. B.M. Dawant. and R.J. Maciunas. “Neural Network_Based Segmentation of Multi_Modal Medical Images. A Comparative and Prospective Study”. IEEE Transactions on Medical Imaging. Vol. 12. No.3. Sep. 1993. pp. 534-544. M.W. Hansen and W.E. Higgins. “Relaxation Methods for Supervised Image Segmentation”. IEEE Trans. on Pattern Analysis and Machine Intelligence. Vol. 19. No. 9. Sep. 1997. M.N. Ahmed and A.A. Farag. “Two stages Neural Network for Medical Volume Segmentation”. Accepted for Publication in the Journal of Pattern Recognition Letters. 1998. L.O. Hall. A.M. Bensaid. L.P. Clarke. R.P. Velthuizen. M.S. Silbger. and J.C. Bezdek. “A Comparison of Neural Network and Fuzzy Clustering Techniques in Segmenting Magnetic Resonance Images of the Brain”. IEEE Transactions on Neural Networks. Vol. 3. No. 5. Sep. 1992. pp. 672-681. K.S. Chuang. H.L. Tzeng. S. Chen. J. Wu. and T.J. Chen. “Fuzzy C-Means Clustering with Spatial Information for Image Segmentation”. Computerized Medical Imaging and Graphics. Vol. 30 (2006). Elsevier. pp. 9–15. J.H. Besese. Cranial MRI. A Teaching File Approach. McGraw-Hill. International Edition. Medical Series. 1991 E.I. Zacharaki. S. Wang. S. Chawla. D. Soo Yoo. R. Wolf. E. R. Melhem. and C. Davatzikos. “Classification of Brain Tumor Type and Grade Using MRI Texture and Shape in a Machine Learning Scheme”. Magnetic Resonance in Medicine. Vol. 62. 2009. pp. 1609–1618.
Authors Indah Soesanti is with the Department of Electrical Engineering and Information Technology. Gadjah Mada University. Yogyakarta. Indonesia. She received B.S. and M.Eng. from Gadjah Mada University. Yogyakarta. Indonesia in 1998 and 2001. respectively. He is currently a Ph.D. student at the Electrical Engineering. Gadjah Mada University. She has more than 7 years of experience in teaching. Her research interests include image processing, signal processing, fuzzy logiz and its application, optimization. and information system. She has published more than six papers in national and international journals. She has also presented more than ten research articles in national and international conferences. Adhi Susanto is a Professor in the Department of Electrical Engineering and Information Technology. Gadjah Mada University. Yogyakarta. Indonesia. He received M.Sc. and Ph.D. from University of California. Davis. US in 1966 and 1986. respectively. He has more than 40 years of experience in teaching and research. His current area of research includes image processing. signal processing. neural networks. wavelets. fuzzy logiz and its application. optimization and control. instrumentation. and information system. He has published more than twenty papers in referred international journals. He has also presented more than fifty research articles in national and international conferences. He has written few books related to his research work. 145
International Journal of Computer Science & Information Technology (IJCSIT) Vol 3, No 5, Oct 2011 Thomas Sri Widodo is a Professor in the Department of Electrical Engineering and Information Technology. Gadjah Mada University. Yogyakarta. Indonesia. He received DEA. and Ph.D. from Universite des Sciences et Techniques du Languedoc. Montpellier 2. France in 1986 and 1988. respectively. He has more than 30 years of experience in teaching and research. His current area of research includes electronics. telecommunication. image processing. signal processing. neural networks. wavelets. fuzzy logiz and its application. instrumentation and control. biomedical engineering. and hypertermia. He has published more than thirty papers in referred international journals. He has also presented more than fifty research articles in national and international conferences. He has written few books related to his research work. He is currently dealing with few projects sponsored by government of Indonesia (the Ministry of Education and the State Ministry of Research and Technology). Maesadji Tjokronegoro is a Professor in the Faculty of Medicine. Gadjah Mada University. Yogyakarta. Indonesia. He received M.S. and Ph.D. from Gadjah Mada University. Yogyakarta. Indonesia in 1981 and 1986. respectively. He has more than 30 years of experience in teaching and research. His current area of research includes radiology. radiotherapy. medical image processing. biomedical engineering. and hypertermia.
146