Georg-August-Universität Göttingen. Platz der Göttinger ... Ole Björn Brodersen, Leif Meier, Matthias Schumann. 2278 ... type process (Meier and Fischer 2006).
MKWI 2010 – Planung/Scheduling und Konfigurieren/Entwerfen
2277
Optimizing the Berth Allocation Problem using a Genetic Algorithm and Particle Swarm Optimization Ole Björn Brodersen1, Leif Meier2, Matthias Schumann1 1Professur
für Anwendnungssysteme und E-Business, Georg-August-Universität Göttingen Platz der Göttinger Sieben 5, 37073 Göttingen 2Procter
& Gamble Service GmbH, Schwalbach am Taunus Frankfurt, Sulzbacher Str. 40 65823 Schwalbach am Taunus Frankfurt Abstract. Large costs arise at a seaport container terminal from the duration of the unloading of vessels and from the time a vessel is waiting to be unloaded. The optimal allocation of vessels to berth space (Berth Allocation Problem) becomes more and more important as its solution is also input to further terminal decision problems. We compare solutions for a realistic data Berth Allocation Problem found by a Composite Heuristic combining a tree search procedure and a pair-wise exchange heuristic with two metaheuristics. We apply Genetic Algorithms as it is widely used and flexible in adaption with promising results in logistics applications and propose a modified Particle Swarm Optimization for combinatorial optimization.
1
Introduction
Today's increasing number of container shipments requires highly efficient logistics processes at container terminals (CT). Forecasts published by the Federal Ministry of Transport, Building and Urban Affairs estimate a four times higher transshipment of standard containers in German ports in 2025 than today (Tiefensee 2007). CT therefore represent an important interface in the global transport chain and have to fulfill two man functions: The transshipment of containers from mode to mode as well as the temporary storage of containers (Saanen 2004). In order to
Ole Björn Brodersen, Leif Meier, Matthias Schumann
2278
improve CT performance, process optimization becomes more and more important, as terminal extensions and technical modifications are highly cost intensive and underlie strategic long term restrictions. The increasing importance of the container flow especially demands for an effective berth management in CT. The Berth Allocation Problem (BAP) defines, where and when vessels will be allocated at the quay. As a result of the decomposition, this decision also has significant influence on subsequent processes and container handling nodes, such as the crane allocation and container storage locations (Meier and Schumann 2007). This paper focuses on the BAP model described by Guan and Cheung (2004) and presents the solutions found by their proposed Composite Heuristic (CH) applied to realistic data sets based on observations of a German port. As the goal of this paper is to improve the provided results we use two different metaheuristics for comparison purposes. As a well-known and in a variety of optimization problems applied solution method we use a Genetic Algorithm (GA). For continuous optimization problems the Particle Swarm Optimization (PSO) shows promising results. Therefore in this work we present a modification of the PSO which is applicable to this kind of combinatorial optimization problem. The remainder of the paper is organized as follows. In Chap. 2 we give a literature review and present the BAP model. Chapter 3 introduces the CH, the GA and the modified PSO. In Chap. 4 we show our experimental setup, present the results and compare each optimization technique used. Finally in Chap. 5 we draw a conclusion.
2
Berth Allocation Problem
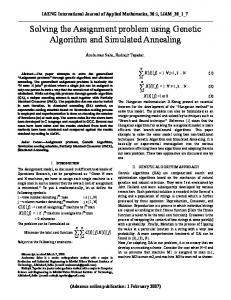
2.1 Literature Review The core processes in container terminal logistics are loading and unloading of vessels, storage of containers and delivery and dispatch of containers within the landside. The main decision areas for management can be derived from these tasks. In the simplest case, results from the problem areas of loading and unloading of containers, berth allocation, assignment of quay cranes to vessels, yardplanning and transport-planning are passed through. Figure 1 shows this idealized type process (Meier and Fischer 2006). Like Kim and Moon (2003), Cordeau et al. (2005), Nishimura et al. (2001) and Lokuge et al. (2004) we concentrate on the BAP, which is a significant part of container terminal processes. In the literature several models for the BAP have been proposed. A comprehensive overview and literature review to CT processes and operations research optimization techniques is given by (Steenken et al. 2004) and again updated in (Stahlbock and Voß 2008). Berth allocation models published differ in assump-
MKWI 2010 – Planung/Scheduling und Konfigurieren/Entwerfen
2279
tions, restrictions and objective functions, especially in considering container storage locations and the estimation of processing times.
Figure 1: Decision areas in container terminals Table 1: Metaheuristics used in literature for the BAP
Author
Year of Publi- Metaheuristic cation
Reference
Nishimura et al.
2001
Genetic Algorithm
(Nishimura et al. 2001)
Kim, Moon
2003
Simulated Annealing
(Kim and Moon 2003)
Dai et al.
2004
Simulated Annealing
(Dai et al. 2004)
Cordeau et al.
2005
Tabu Search
(Cordeau et al. 2005)
Moorthy, Chung
2006
Simulated Annealing
(Moorthy and Chung 2006)
Wang, Lim
2007
Stochastic Beam Search
(Wang and Lim 2007)
Moorthy and Chung (2006) present a model for the home berth allocation as a tactical problem. It considers vessels planned on a weekly arriving basis not to be allocated on a plane, but on a cylinder so that the “wrap around effect (periodicity)” (Moorthy and Chung (2006) is not ignored. The authors consider stochastical influence and try to optimize the trade-off between service quality (in waiting hours) and operational costs (in difference to the preferred berthing location). For
2280
Ole Björn Brodersen, Leif Meier, Matthias Schumann
optimization, the authors use a sequence pair based simulated annealing approach (Moorthy and Chung 2006). Cordeau et al. (2005) use a Tabu Search heuristic for solving the BAP, investigating discrete and continuous model formulations. They consider suboptimal berthing positions by increasing the estimated processing time and try to optimize the service time of all vessels (Cordeau et al. 2005). Another metaheuristic, namely a stochastic beam search algorithm, for solving the BAP is applied by Wang and Lim (2007). They compare their results to results coming from a simulated annealing approach and show promising results. Table 1 summarizes different metaheuristic solution approaches to the BAP ordered by year of its publication. The next section describes the used model for this research.
2.2 Used Model In this paper we focus on the formulation of the BAP model, as it is proposed in (Guan and Cheung 2004). This formulation uses discretized time and space units, allows multiple vessel mooring per berth and considers vessel arrival times. Container storage positions are not considered. Although, the need for integrated optimization arises, fast and efficient optimization techniques for the berth allocation are required, as they may also be used within integrated models as proposed in (Meier and Schumann 2007). The model uses the following decision variables, where ui describes the mooring time of vessel i, vi describes the starting berth section occupied by vessel i and ci describes its departure time. T denotes the regarded time. For each vessel the following information is used and given from the used data set. The processing time pi for vessel i is gained from an estimation function f(TEU, vessel type). The size si of vessel i is measured in the number of berth sections where si ≤ S with S denoting the quaylength. Vessel i's arrival time is denoted by ai and the weight assigned for each vessel is wi. The mathematical formulation with relative vessel positions is then defined as: (1) subject to (2) (3) (4)
MKWI 2010 – Planung/Scheduling und Konfigurieren/Entwerfen
2281
(5) (6) (7) (8) (9) (10) (11) (12)
(13)
To be on the left side of another vessel means that a predecessor's completion time is smaller than the successor's arrival time (see Eq. 12). Analogous being on top of another vessel means that its berthing position is larger than the following vessels' position and its size (see Eq. 13). Figure 2 illustrates a possible solution of the allocation of vessels to berth sections. The hatched areas indicate that the vessels' mooring time is later than its arrival time (u>a). The objective is to minimize the total weighted time in port (TIP) of all vessels (see Eq. 1), also called the flow resp. service time, see (Guan and Cheung 2004; Cordeau et al. 2005).
Ole Björn Brodersen, Leif Meier, Matthias Schumann
2282
Figure 2: Example allocation of vessels to berth sections
The BAP formulation remains similar in publications in the literature, considering vessels as a rectangle in two dimensions operations time and length. Differences occur for example in modeling the quay as a straight line or of more complex shape. In the latter case vessels with specific sizes can berth at specific berth section only. We use a straight line quay of 1700 meters discretized to 170 berth sections. The given data additionally contains the vessel type classification to feeder, medium class or jumbo vessel, which is used for the estimation of the processing time.
3
Optimization Algorithms
3.1 Composite Heuristic Along with the model formulation of the BAP used in this paper the CH was proposed by Guan and Cheung (2004). After obtaining an initial assignment of the vessels to the berth section for each batch, all batches are sequenced according to their exact arrival time. The algorithm cycles through all batches and does some testing: For each pair of vessel rectangles in consecutive batches it is tested if the pairwise exchange heuristic is able to reduce the objective value. In case of a successful reduction this pair is declared as a possible candidate. As long as there are possible candidates, the one with most reduction to the objective value is selected and the exchange is implemented. If there is no candidate the tree search procedure is applied and the vessels are moved left as much as possible.
MKWI 2010 – Planung/Scheduling und Konfigurieren/Entwerfen procedure
2283
CompositeHeuristic
0.Obtaininitialassignmentforeachbatch 1.Sequencebatchesaccordingto their batch arrivaltime 2.forall batches 2.1
2.2 2.3
Bi do foreachpair of vesselswithone in Bi and onein Bi+1 , ifthe pair-wiseexchangeheuristiccan reducetheobjectivevalue, then declarethispair as a candidate. Ifthere isno candidategoto step2.3 Selectthecandidatewiththemaximum reductionand implementtheexchange. Applythetree-searc hprocedure in Bi and movevesselrectanglesto theleftas much as possible. Set i = i + 1 and goto step2.
3.Iftheobjectivevaluecanbereducedin step2, thenseti = 1 and goto step2. Otherwiseterminate. end procedure
Figure 3: Pseudo-code of the CH (Guan and Cheung (2004))
Figure 4: Interaction of PWE and TS within the CH
This is done as long as there are batches left not having been examined. The CH works as described in the following pseudo-code (see Figure 3). For a detailed overview to the simple pair wise exchange (PWE) heuristic and the more complex tree search (TS) procedure we refer to Guan and Cheung (2004). The following Figure 4 shows the interaction of PWE and TS within the CH. Contrary to some earlier published berth allocation models in literature, see e.g. Kim and Moon (2003) and also Nishimura et al. (2001), Guan and Cheung (2004) set aside a location term within the objective function (see Eq. ((1). This can only be useful within an isolated model as it is considered here for the berth allocation, because the operation time of the vessel (assumed to be given in the model)
2284
Ole Björn Brodersen, Leif Meier, Matthias Schumann
strongly depends on the vessels berthing position, so in a non-isolated model, e.g. the terminal environment, this would not lead to satisfying results.
3.2 Genetic Algorithm As the GA is widely applied to different types of problems and showed promising results in logistics applications like the examined BAP (Nishimura et al. 2001) we use it for comparison purposes. The GA is a population-based metaheuristic and belongs to Evolutionary Computation (EC) algorithms, that uses natural evolutionary techniques in order to solve complex optimization problems. Since its introduction by Holland (1998) in the fifties, GA have proved its wide applicability in many areas, for logistics optimization problems as well.
Figure 5: Pseudo-code of the GA (Dorigo and Stützle 2004)
Starting with an initial, not necessarily randomized population, containing n (n>1) individuals, further (fitter) populations will iteratively be generated, using evolutionary elements. Individuals within a population start searching for new solutions at the same time, each of them representing a solution for the optimization problem. Using genetic operators, such as reproduction, recombination and mutation, individuals produce offspring and their quality is measured with the help of a fitness function. This fitness value determines the probability for reproduction. The higher this value is, the higher is the probability of a individual for being selected and therefore being part of the next generation. The recombination (or crossover operator) combines information from two or more individuals and produces some offspring. The mutation operator introduces random modifications to this process. Applying these operators, it is also possible
MKWI 2010 – Planung/Scheduling und Konfigurieren/Entwerfen
2285
to leave local optima, which is an important property for heuristic algorithms. The procedure of the GA is shown in Figure 5. As EC algorithms are widely published, we refer to the literature for a detailed overview for more information, see e.g. (Leguizamón et al. 2007; Reeves 2003; Holland 1998).
3.3 Particle Swarm Optimization For improving the provided results of the described CH and GA we use a metaheuristic, which has not yet been applied to the BAP. The PSO was originally developed by Kennedy and Eberhard in 1995 (Kennedy and Eberhard 1995) for finding solutions for continuous optimization problems and showed promising results. In this chapter we present the main idea of classical PSO and introduce a modified metaheuristic for combinatorial optimization. Classical Metaheuristic Reynolds, Heppner and Grenander studied the behavior of birds (Reynolds 1987; Heppner and Grenander 1990). While Reynolds focused only on the birds' movement, Heppner and Grenander added a place to roost to the model. Additionally on finding their way to the best place to roost the birds were equipped with another behavior: They want to stay in the flock. These two goals are contrary to each other. The more attractive a place to roost becomes for a bird, the higher the wish to land at this point which will cause other birds to go into this direction as well. Based on this idea, Kennedy and Eberhard implemented social behavior to the birds and called them particles, because they are mass- and collision-free. They also enabled a particle to memorize the best position it found so far and to memorize the best position found within the whole swarm. Originating with random positions xi within the solution space the algorithm calculates fitness values f(xi) based on the optimization problem. The particles are represented by their actual position xi, their actual velocity vi and their personal best position yi (Van Den Bergh 2002). After the initialization, the iterative process of optimization begins where the personal best values pbest and the best values within the swarm gbest are updated and new positions, velocities and fitness values are calculated. This process terminates as soon as a previously defined fitness value is obtained or a threshold for the number of iterations is exceeded (Shi 2004). The pseudo-code for this procedure is shown in Figure 6 (Kennedy et al. 2001).
2286
Ole Björn Brodersen, Leif Meier, Matthias Schumann
Figure 6: Pseudo-code of PSO
The personal best position for each particle is obtained with ((14). (14)
With the size s of the swarm the global best position is defined as: (15)
A particles' velocity at time t+1 is given by the influences of the personal best and the global best position: (16)
with influence of social factors 0 ≤ c1,c2 ≤ 2, two uniform distributed random variables r1 ~ U(0,1), r2 ~ U(0,1) and the restriction of velocity in [-Vmax, Vmax]. The factors c1 and c2 regulate the strength of the influence of the personal best and global best position on the calculation of the new velocity. With c2 > c1 the swarm tends to converge in a certain region near the global best particle whereas c1 > c2 leads to a better exploration of the solution space. With the restriction of the solution space within [-xmax, xmax] the particles' position is: (17)
MKWI 2010 – Planung/Scheduling und Konfigurieren/Entwerfen
2287
Metaheuristic for Combinatorial Optimization As the original PSO cannot be applied to a combinatorial optimization problem, we propose a modified heuristic in this chapter which is applied to the mentioned BAP, based on the description of an application of the PSO to university course timetabling problem (Brodersen and Schumann 2007). The swarm characteristics of the algorithm will not be modified and the procedure of the optimization process is similar to the one of the classical PSO. Every particle has its actual position xi(t) and its personal best position ypbest(t). The neighborhood used is global so that at time t every particle knows the global best position ygbest(t-1) from the previous iteration t-1. According to the classical PSO ((14) and ((15) give the personal best and global best position. The new velocity cannot be derived from ((16). It has to be modified to be usable for this special combinatorial problem. Based on a randomly generated allocation of vessels to berth sections the new position xi(t+1) is derived by running different steps on the basis of the actual position: 1. Randomly swap two berth sections for two vessels from within the actual position 2. Randomly copy a berth section from within the personal best position 3. Randomly copy a berth section from within the global best position 4. With a given probability change a vessel's position randomly The iterative process stops when a previous defined number of iterations is exceeded or a defined threshold for a found solution is obtained. Figure 7 shows the process of this modified PSO.
4
Experiments and Results
4.1 Settings We use four realistic data sets with 62, 62, 64 and 59 vessels arriving within a planning horizon of 8 days. The quaylength is set to 1700 meters. Within the data sets each vessel description contains day and hour of arrival, TEU to be processed, size and the vessel's category as feeder, medium or jumbo vessel. The processing time is estimated as a function of TEU and its category. Feeder vessels will be handled by two, medium by three and jumbo vessels by four quay cranes. Each quay crane is expected to reach 20 TEU/h. The batch length for the CH is set to 12h. We apply the exact hourly vessel arrival times given from the data sets for the CH, as we do for both metaheuristics. To compare the optimization methods, we set the maximum number of function evaluations to 50000 for each metaheuristic setup and data set.
2288
Ole Björn Brodersen, Leif Meier, Matthias Schumann
Figure 7: Process of the PSO for combinatorial optimization problems
We set the number of iterations to a value dependent on the used population size, e.g. within the PSO a swarm size of 20 leads to a maximum number of iterations of 2500. To obtain a good estimator for the achieved fitness value for both metaheuristics GA and PSO we set the number of replications to 31. This is not necessary for the CH because there is no stochastic influence. The settings we used for GA can be obtained from Table 2. We try 10 different settings for the GA, using two different selection rates and successively increase the mutation and crossover rate. All experiments for the GA are conducted with a population size of 100. For PSO we use swarm sizes 20, 60 and 100 and use 0.0, 0.5 and 1.0 as probability for in Chap. 3.3 introduced step 4. These settings reflect the character of the canonical PSO.
MKWI 2010 – Planung/Scheduling und Konfigurieren/Entwerfen
2289
Table 2: Parameter settings for GA Setting
Population size
Iterations
Mutation rate
Crossover rate
Selection rate
V1
100
500
20
20
60
V2
100
500
40
40
60
V3
100
500
60
60
60
V4
100
500
80
80
60
V5
100
500
100
100
60
V6
100
500
20
20
80
V7
100
500
40
40
80
V8
100
500
60
60
80
V9
100
500
80
80
80
V10
100
500
100
100
80
4.2 Results In addition to the results of the CH we compare the PSO and GA with the best value found by 50.000 randomly generated solutions. This procedure randomly generates berth sections. The vessels then are shifted left as much as possible. All proposed (meta-)heuristics achieve good results for the objective minimizing the total weighted time in port for all vessels for the given realistic data BAP. While the PSO performs best in all four used data sets the GA does not exceed the results of the CH in three cases. In the fourth case the data seams not to be appropriate for using the CH. As expected the randomly generated solutions were far behind. Table 3 gives an overview of the results provided for all examined parameter settings of all used algorithms in all four data sets. For every algorithm the mean values and standard deviations for 31 replications are shown and best mean values within the class of algorithm are marked bold. Additionally the best mean values found compared to all other results within a data set is marked with "*".
Ole Björn Brodersen, Leif Meier, Matthias Schumann
2290
Table 3: Provided results for all data sets Algorithm (setting) Random CH GA (V1) GA (V2) GA (V3) GA (V4) GA (V5) GA (V6) GA (V7) GA (V8) GA (V9) GA (V10) PSO (20, 0.0) PSO (20, 0.5) PSO (20, 1.0) PSO (60, 0.0) PSO (60, 0.5) PSO (60, 1.0) PSO (100, 0.0) PSO (100, 0.5) PSO (100, 1.0)
mean 2651 2273 2358 2370 2329 2484 2524 2368 2403 2421 2450 2482 2224* 2230 2238 2225 2230 2232 2225 2232 2233
#1
sd 43.65 0 45.22 53.05 56.11 82.52 78.16 39.34 57.36 62.88 65.88 69.96 12.66 12.00 6.89 10.96 11.34 13.47 10.03 10.79 11.21
mean 2417 2078 2164 2169 2132 2294 2291 2162 2201 2231 2266 2268 2034 2034 2033* 2035 2036 2033* 2036 2033* 2034
#2
Data set # sd 39.94 0 49.15 51.10 48.55 57.42 75.89 52.62 55.26 64.40 68.82 59.55 5.47 4.95 5.52 6.46 5.61 6.90 5.21 6.30 7.15
mean 2586 2256 2342 2348 2304 2442 2471 2349 2370 2413 2419 2441 2238 2238 2237 2236* 2236* 2237 2238 2240
2236*
#3
sd 32.35 0 35.97 42.09 42.06 52.62 77.61 36.62 41.02 69.85 61.90 54.73 5.86 6.50 7.09 8.62 7.77 6.31 7.58 6.17 8.53
mean 2429 2346 2177 2197 2223 2314 2361 2169 2227 2298 2298 2307 2069 2068* 2070 2068* 2070 2068* 2070 2068* 2072
#4
sd 45.49 0 48.07 55.19 63.28 87.94 91.39 43.04 44.47 67.73 67.59 56.52 5.02 5.26 4.08 6.54 4.71 7.22 4.02 5.38 4.32
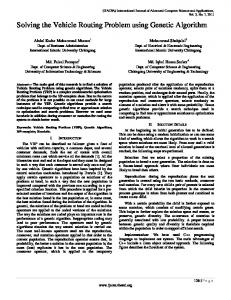
PSO provides best results in every tested data set with small standard deviations whereas standard deviations of the GA are even bigger than those of the randomly generated results. The best values of each algorithm for the different data sets are shown in Figure 8.
Figure 8: Results for best parameter setting of algorithms
MKWI 2010 – Planung/Scheduling und Konfigurieren/Entwerfen
2291
A more detailed view of the results is presented in Figure 9 which shows boxplots of the best found parameter settings of all used algorithms for all used data sets. The random algorithm provides the worst results regarding mean values and standard deviations. The CH provides better results than the GA, especially regarding that the standard deviation of the GA is quite big. In contrast the CH has the advantage of not having to choose from a variety of parameter settings, except from the determination of the batch size. Comparing CH and PSO this advantage is diminished, because PSO on the one hand provides better mean values for all used data sets. On the other hand for all data sets even the maximum values of 31 replications for the best setting of PSO do not exceed the provided results of the CH.
Figure 9: Detailed overview of provided results (boxplots) for all data sets
Ole Björn Brodersen, Leif Meier, Matthias Schumann
2292
5
Conclusion
In this paper we applied a GA and a modified Particle Swarm Optimizer to a realistic data BAP. This problem is part of the CT management problem. We were able to modify the PSO in that way that it is applicable to this kind of combinatorial problem. The results provided by GA and PSO were compared to those of a CH being state-of-the-art for solving the BAP. We could show that the the PSO provides better results than those provided by CH and GA. Comparing both population based metaheuristics we find that PSO converges much faster than the GA and apart from that provides the best results found within the conducted experiments. We found several problems occurring at CH while performing our experiments. The assumptions made in (Guan and Cheung 2004) strongly keep this approach fixed to its isolated model, while GA and PSO are much more flexible in use, e.g. in adding the lost location term within the fitness function. This would be part for a non-isolated approach, which is clearly accepted for future research, see e.g. (Meier and Schumann 2007; Stahlbock and Voß 2008; Steenken et al. 2004). By setting a new arrival time for vessels to the beginning of each batch known information will get lost. Also the question arise, which arrival time should be used within the fitness function. There is no advice or method given in (Guan and Cheung 2004) how to choose the batch size, which has a crucial impact on the CH. Furthermore the authors note that the TS procedure should be limited to 15 vessels. According to the forecast of (Tiefensee 2007) regarding the growth of container handling in ports this seems not to be appropriate for future requirements. In future research it is very likely to have a look at the integration of the BAP into the whole CT processes and problems (Meier and Schumann 2007). Because all problems are interconnected with each other it is a crucial part for finding good solutions that good metaheuristics are applied.
References Brodersen O, Schumann M (2007) Einsatz der Particle Swarm Optimization zur Optimierung universitärer Stundenpläne. Arbeitsberichte des Instituts für Wirtschaftsinformatik, Professur für Anwendungssysteme und E-Business, Universität Göttingen 5. Cordeau J-F, Laporte G, Legato P, Moccia L (2005) Models and Tabu Search Heuristics for the Berth-Allocation Problem. Transportation Science 39(4):526-538.
MKWI 2010 – Planung/Scheduling und Konfigurieren/Entwerfen
2293
Dai J, Lin W, Moorthy R, Teo C-P (2004) Berth Allocation Planning Optimization in Container Terminal. Working paper, Georgia Institute of Technology, Atlanta; National University of Singapore. Dorigo M, Stützle T (2004) Ant Colony Optimization. MIT Press. Guan Y, Cheung RK (2004) The berth allocation problem: models and solution methods. OR Spectrum 1: 75-92. Heppner F, Grenander U (1990) A stochastic nonlinear Model for coordinated Bird Flocks. Krasner S: The Ubiquity of Chaos. Washington: 233-238. Holland JH (1998) Adaption in natural and artificial systems. An introduction analysis with applications to biology, control and artificial intelligence. Ann Arbor, University of Michigan Press. Kennedy J, Eberhart RC (1995) Particle Swarm Optimization. Proceedings of the IEEE international Conference on Neural Networks (Perth, Australia) Piscataway: 1942-1948. Kennedy J, Eberhart RC, Shi Y (2001) Swarm Intelligence. San Francisco. Kim KH, Moon KC (2003) Berth scheduling by simulated annealing. Transportation Research Part B: Methodological 37: 541-560. doi:10.1016/S0191-2615(02)00027-9. Leguizamón G, Blum C, Alba E (2007) Evolutionary Computation. González TF: Handbook of Approximation Algorithms and Metaheuristics: 24-1-24-15. Lokuge P, Alahakoon D, Dissanayake P (2004) Homogeneous neuro-BDI agent architecture for berth scheduling in container. Proceeding of the Institute of Marine Engineering, Science and Technology. Part B, Journal of Marine Design and Operations 6: 17-27. Meier L, Schumann R (2007) Coordination of interdependent planning systems, a case study. Lecture Notes in Informatics, Beiträge der 37. Jahrestagung der Gesellschaft für Informatik e.V. (GI): 389-396. Meier L, Fischer H (2006) Koordination integrierter Logistikprozesse im Hafen. Innovative Methoden und Werkzeuge zur Gestaltung, Steuerung und Kontrolle von Geschäftsprozessen in Dienstleistung, Verwaltung und Industrie (9. Symposium Soft Computing): 23-37. Moorthy R, Chung-Piaw T (2006) Berth management in container terminal: the template design problem. OR Spectrum 28(4): 495-518. Nishimura E, Imai A, Papadimitriou S (2001) Berth allocation planning in the public berth system by genetic algorithms. European Journal of Operational Research 131(2): 282-292.
2294
Ole Björn Brodersen, Leif Meier, Matthias Schumann
Reeves C (2003) Genetic Algorithms. Glover F, Kochenberger GA: Handbook of Metaheuristics: 55-82. Reynolds CW (1987) Flocks, Herds and Schools. A Distributed Behavioral Model. New York. Saanen Y (2004) An approach for designing robotized marine terminals (PhDThesis). Delft University. Shi Y (2004) Particle Swarm Optimization. Yen GG: coNNectionS. The Newsletter of the IEEE Neural Networks Society: 8-13. Stahlbock R, Voß S (2008) Operations research at container terminals: a literature update. OR Spectrum 30(1): 1-52. Steenken D, Voß S, Stahlbock R (2004) Container terminal operation and operations research - a classification and literature review. OR Spectrum 26(1): 3-49. Tiefensee W. (2007) Deutsche Seehäfen weiter auf Wachstumskurs Umschlagsaufkommen wird sich bis 2025 mehr als verdoppeln. Presseerklärung des Bundesministeriums für Verkehr, Bau und Stadtentwicklung (BMVBS) vom 2. Mai 2007 109/2007. Van Den Bergh F (2002) An Analysis of Particle Swarm Optimizers. Pretoria. Wang F, Lim A (2007) A stochastic beam search for the berth allocation problem. Decision Support Systems 42: 2186-2196.