An International Journal of Optimization and Control: Theories & Applications ISSN: 2146-0957 eISSN: 2146-5703 Vol.7, No.1, pp.117-129 (2017) https://doi.org/10.11121/ijocta.01.2017.00373
RESEARCH ARTICLE
Optimizing the location-allocation problem of pharmacy warehouses: A case study in Gaziantep Eren Özceylana *, Ayşenur Uslub, Mehmet Erbaşc, Cihan Çetinkayaa, Selçuk Kürşat İşleyend a
Department of Industrial Engineering, Gaziantep University, Turkey Department of Industrial Engineering, Başkent University, Turkey c General Command of Mapping, Ministry of National Defense, Ankara, Turkey d Department of Industrial Engineering, Gazi University, Turkey
[email protected],
[email protected],
[email protected],
[email protected],
[email protected] b
ARTICLE INFO
ABSTRACT
Article history:
It is a known fact that basic health care services cannot reach the majority of the population due to poor geographical accessibility. Unless quantitative locationallocation models and geographic information systems (GIS) are used, the final decision may be made on pragmatic considerations which can result far from optimal. In this paper, current and possible (or potential) new locations of pharmacy warehouses in Gaziantep are investigated to provide optimal distribution of hospitals and pharmacies. To do so, first of all, geographic information of 10 current and 10 potential pharmacy warehouses, 231 pharmacies and 29 hospitals are gathered using GIS. Second, a set covering mathematical model is handled to determine coverage capability of current and potential pharmacy warehouses and minimize the number of warehouses to be opened. Finally, P-center and P-median mathematical models are applied to open potential warehouses and to assign pharmacies & hospitals to the opened warehouses so that the total distance and the demand’s longest distance to the source are minimized. Developed integer programming (IP) models and GIS software are compared with on a case study. Computational experiments prove that our approach can find new potential pharmacy warehouses which cover wider areas than current warehouses to service pharmacies and hospitals in the city.
Received: 26 July 2016 Accepted: 10 January 2017 Available Online: 20 January 2017
Keywords: P-median P-center Set covering GIS Network analysis
AMS Classification 2010: 90B90, 90B80
1. Introduction In health care services context, pharmacies are the medicine markets that we try to reach quickly in case of any illness. Pharmacists are part of the healthcare team and provide advice to patients, case management, and benefits management. Thus, pharmacists have an important role in helping prevent medication errors and in identifying drug interactions and pharmaceutical care is an important aspect of the spectrum of healthcare. Continuous expansions of the city, development of multi-center urban structure and changes in population density have affected the spatial distribution of needs and demand for pharmacies. The aforementioned challenges make utilization of effective health care services more difficult. Besides rural regions, urban areas may also be unable to get transportation to the *Corresponding
author
117
nearest pharmacy due to mentioned obstacles. While the growth of Internet and mail-order pharmacies might suggest that geographical limits to access are no longer a concern, many rural and urban residents do not have the equipment, technical skills, and/or telecommunications accessibility that these services require [1]. Especially in developing countries, pharmacies play an important role, in providing information and advice on health to low-income people. However, unbalanced distribution of pharmacies with respect to population and resources (such as warehouses and hospitals) would severely limit the accessibility of pharmacy services. Thus, one of the principal reasons for the success of a pharmacy is suitable location and number of existing pharmacies. Despite this, locations and selection of
E. Özceylan et al. / Vol.7, No.1, pp.117-129 (2017) © IJOCTA
118
new pharmacies are too often selected in an unscientific manner. Sometimes pharmacies suffer because they are just outside the flow of traffic [2]. Unless quantitative location-allocation models are used, the final decision may be given on pragmatic considerations which can result far from optimal. Pharmacy distribution depends greatly on geographical location; approximately 35.45% of community pharmacies are found in Istanbul (19.90%), Ankara (8.32%) and Izmir (7.23%), where 30.60% of the population lives. Table 1 indicates top 10 cities in terms of population with number of pharmacies, number of people per pharmacy and number of required pharmacies. The regulation about controlling of number of pharmacies was published in the Turkish official gazette on May 17, 2012. According to published directive, number of pharmacies is determined per 3500 people. As it can be seen from Table 1, there are 4840 pharmacies which serve all people in İstanbul while 4188 pharmacies are enough. So, 652 pharmacies in İstanbul are surplus. As opposite, 75 pharmacies are deficit in Gaziantep which is the 8th most crowded city in Turkey. Totally 1821 pharmacies are unnecessary in Turkey [3]. The most important indicator in Table 1 is that, although there are redundant pharmacies in Turkey, optimal location and allocation of existing pharmacies is lacking. Table 1. Top 10 cities with pharmacies in Turkey [4]. Cities İstanbul Ankara İzmir Bursa Antalya Adana Konya Gaziantep Şanlıurfa Kocaeli Turkey
No. Pharmacies
Population
4840 2023 1759 828 1013 653 711 477 370 431 24319
14657434 5270575 4168415 2842547 2288456 2183167 2130544 1931836 1892320 1780055 78741053
No. People per Pharmacy 3029 2606 2370 3434 2260 3344 2997 4050 5115 4131 3238
No. Required Pharmacies
Gap
4188 1506 1191 813 654 624 609 552 541 509 22498
652 517 568 15 359 29 102 -75 -171 -78 1821
Many factors as proximity to hospitals, proximity to pharmacy warehouses and coverage level are effective in spatial distribution of pharmacies in settlement areas. This distribution is noteworthy in urban places especially in metropolitan areas. Thus spatial distribution of pharmacies affects their accessibility and provided services which must be socially available. To give satisfactory decisions for location and allocation of pharmacies, mathematical models and GISs are the most common tools in literature and practice [5]. Considering this situation, in this paper; current and possible new locations of pharmacy warehouses in Gaziantep are investigated to provide optimal distribution of hospitals and pharmacies. To do so, a two-step approach is followed. First, geographic information of 10 current and 10 potential pharmacy warehouses, 231 pharmacies and 29 hospitals are gathered using GIS. Secondly, set covering, P-center and P-median models are applied to setup potential
warehouses then assign pharmacies and hospitals to the opened warehouses so that the total transportation distance can be minimized. Then this approach is applied to an illustrative case study in Gaziantep. The remainder of the paper is organized as follows. Next section, we provide an overview and a summary of the existing literature of mathematical locationallocation models and GIS on healthcare services. Section 3, describes and gives details about proposed location-allocation models. Section 4 contains both computational experiments and a case study, and finally Section 5 presents our conclusion. 2. Literature review This section presents a brief review on the locationallocation models for healthcare service problems, followed by the same steps for GIS applications. 2.1. Location-allocation models on healthcare services Location-allocation models try to determine the optimal location for facilities and assign customers to these facilities in order to meet their demands. There are many studies in the literature related to facility location problems, which attracts the researchers for more than 50 years. In this context, the studies of Daskin [6], Owen and Daskin [7], Narula [8], Arabani and Farahani [9] can be examined. The locationallocation problems can be classified generally as public location problems (e.g., school, clinics, hospital, ambulance etc.) and private location problems (e.g., retail store, industrial facilities etc.). While cost minimization is important in private location problems, it is more important to ensure the accessibility of the facility in public location problems [10]. The application of location-allocation models in healthcare services are explained in Rahman and Smith [11], Daskin and Dean [12], Rais and Viana [13] and Afshari and Peng [14]. In Rahman and Smith [11], the location-allocation models for healthcare service are gathered in 2 categories such as single level models and hierarchical models. The single level models are used for determining the most suitable places for health care system facilities. P-median, Pcenter, set covering and maximal covering models are evaluated in this perspective. Hierarchical models are problems in which the upper level and lower level facilities are considered together [15]. Mestre et al. [16], Farahani et al. [17] and Teixeira and Antunes [18] can be examined as examples of hierarchical models in healthcare services. A summary of the literature related to the single-level facility location-allocation models are given in Table 2. Also, Harper et al. [28], Abdelaziz and Masmoudi [29] and Mestre et al. [30], suggested stochastic models for planning healthcare facilities. Lovejoy and Li [31], Stummer et al. [32] have proposed multi
Optimizing the location-allocation problem of pharmacy warehouses: A case study in Gaziantep objective approaches in the literature. Table 2. A summary of the literature. Source
Solution Method
Berghmans et al. [19]
P-center and set covering models
Tavakoli and Lightner [20]
Set covering model
Jia et al. [21]
Maximal covering model
Jia et al. [22]
P-median, P-center and covering models
Shariff et al. [23] Valipour et al. [24]
Capacitated maximal covering model Maximal covering model and particle swarm optimization
Jia et al. [25]
Modified P-median model
Kunkel et al. [26]
P-median and capacitated facility location models P-median, P-center, set covering models and mathematical formulation for network reorganization problem
Guerriero et al. [27]
Application Area Determining the number of new healthcare facility in Saudi Arabia Locating/allocating emergency vehicles in Fayetteville, NC Determining the facility locations of medical supplies Optimizing the locations of facilities for medical supplies in Los Angeles New healthcare facility location in Malaysia Determining new healthcare facility locations Determining three location for healthcare facility in China Distribution of health resources in Malawi Public hospital network reorganization in Italy
119
approaches to location and allocation problems in healthcare is still lacking. To the best of our knowledge, the proposed study which applies three different location and allocation models and GIS to pharmacy warehouses location and allocation problem is the first as a case study. The contributions of this paper are twofold and are stated as follows: (i) To apply well-known three location-allocation models to pharmacy warehouses distribution problem, and (ii) To compare IP models and GIS software. In practical side, potential pharmacies offered by the proposed model provide better service quality than the current pharmacies. 3. Location-allocation models Pharmacy logistics is an important issue in healthcare services. Thus, determining the locations of pharmacies and pharmacy warehouses are strategic decisions. In this section, the location-allocation models -which are used in this study to ensure the optimal distribution of the pharmacy warehouses to hospitals and pharmacies-, are described. 3.1. Set covering problem
2.2. GIS applications on healthcare services GIS is a computer based system that collects, stores, analyzes and displays spatial data according to their locations [33]. The most powerful aspect of GIS is performing spatial analyses for getting information in many fields. Network analysis has been used extensively to examine relationships between organizations. This type of analysis can be used to find the shortest routes or to find the service areas of facilities. GIS has become an important tool in healthcare activities such as database management, planning, emergency situations, service area problems etc.[34,35]. It is also used as a decision making system that helps the managers in better planning, utilization of available health resources and improving health care delivery [35, 36]. Lovett et al [37] examined accessibility to surgeries by GIS. High-risk emergency maps are generated by Grekousis and Photis [38]. They analyzed health emergency data and revealing relationships in GIS, in order to show where strokes are likely to occur. Geographic distribution is used to compare GP clinics and musculoskeletal health care clinics in Sanders et al. [39]. Travel distance between women with breast cancer and the nearest mammography facility is analyzed by Huang et al. [40]. Pearce et al. [41] applied GIS to calculate travel time for geographical access to health facilities. Network analysis is used to select rotary air transport or ground transport of a burn care facility by Klein et al. [42], McLafferty [36] provide timely emergency responses for ambulance services. As it seen from the reviewed studies in above, application of mathematical modeling and GIS
G (N, A) is a fully connected network and N is the set of nodes while A is set of edges between these nodes. N consists of nodes, I consists of customers and K consists of potential warehouses. There are distances identified as dik between all node pairs within the network. The set covering problem is identified as a facility location selection problem in a way to reach every cluster at least once in a predetermined time on this network. Farahani et al. [43], Caprara et al. [44] and Li et al. [45] can be examined as set covering problem examples. The formulation of the set covering problem is as follows [46]: Decision variables: yk = 1, if potential warehouse k is opened (∀k ∈ K); 0 otherwise Objective function: Min Z = ∑k∈K yk (1) s. t. ∑k∈K a ik yk ≥ 1 ∀i ∈ I (2) yk ∈ {0, 1} ∀k ∈ K (3) The objective function (1) is to minimize the number of facilities to be opened. Constraint (2) is to provide service from at least one opened warehouse to all pharmacies and hospitals within the predetermined time. Constraint (3) is the integrality constraint of the decision variable. Here, 𝑎𝑖𝑘 is 1, if can be reached from k to i in a predetermined time; 0 otherwise. 3.2. P-median problem On the network which is defined in sub-section 3.1, positive demand identified as wi and transportation costs per unit between all customers identified as cik are taken into consideration. The P-median problem
120
E. Özceylan et al. / Vol.7, No.1, pp.117-129 (2017) © IJOCTA
tries to determine P amount candidate facility that is to open and which customers will be assigned to each facility. The P-median problem was examined in literature for the first time by Hakimi [47]. Kariv and Hakimi [48] proved that the problem is a combinatorial NP-Hard problem. The formulation of the P-median problem is as follows [18]: Decision variables: yk = 1, if potential warehouse k is opened (∀k ∈ K); 0 otherwise xik = 1, if customer i is assigned to potential warehouse k (∀i ∈ I, ∀k ∈ K); 0 otherwise Objective function: Min Z = ∑i∈I ∑k∈K wi cik xik (4) s. t. ∑k∈K xik = 1 ∀i ∈ I (5) xik ≤ yk ∀i ∈ I, ∀k ∈ K (6) ∑k∈K yk = P (7) yk , xik ∈ {0, 1} ∀i ∈ I, ∀k ∈ K (8) The objective function (4) is to minimize total costs. Constraint (5) provides the assignment of each customer to a warehouse, while Constraint (6) provides the assignment of customers to the opened warehouses Constraint (7) determines the number of warehouses which should be opened. Constraint (8) is the integrality constraint of the decision variables. 3.3. P-center problem The P-center problem tries to determine P amount candidate facility that is to open and which customers will be assigned to each facility while minimizing the customer’s longest distance to the facility. The formulation of the P-center problem is as follows [6]: Decision variables: yk = 1, if potential warehouse k is opened (∀k ∈ K); 0 otherwise xik = 1, if customer i is assigned to potential warehouse k (∀i ∈ I, ∀k ∈ K); 0 otherwise Objective function: Min Z = Max(dik xik ) (9) s. t. Constraints (5) to (8) For the linearization of the model the MaxL decision variable is added. The objective function is written as Z = MaxL and MaxL ≥ dik xik and MaxL ≥ 0 constraints are added to the model. 4. Computational experiments In this section, the current and potential locations of pharmacy warehouses in the province of Gaziantep are examined and the results are discussed using mathematical models described in the previous section. Finally, GIS software results and proposed mathematical model’s results are compared. 4.1. Case study This section presents the results of implementing the proposed technique on a city-wide area. Gaziantep is
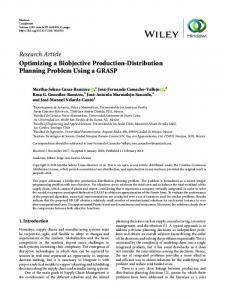
the 8th most crowded city of Turkey. The city has a mean elevation of 706 meters, and in 2015, its population was 1,931,836 with a total acreage of 7,642km2. The city is an important commercial and industrial center for Turkey and it is located at 37°04′North, 37°23′East. The biggest two districts of Gaziantep, namely Şehitkamil and Şahinbey, are considered as our study area (Figure 1).
Figure 1. Location map of the study area.
Firstly, 231 pharmacies, 29 hospitals, 10 current warehouses and potential 10 pharmacy warehouses are determined with GIS then the distances are calculated. The locations of potential pharmacy warehouses are determined by Gaziantep Chamber of Pharmacies. All facilities in the case study are shown in Figures 2 and 3. The spatial positions of every facility (hospitals, pharmacies, current and potential pharmacy warehouses) are defined by geographic coordinates (longitude and latitude). ESRI ArcGIS 10.2 software as a GIS tool is used to calculate the real distances between the facilities in the network.
Figure 2. Considered 29 hospitals and 231 pharmacies in Gaziantep city center.
After determining the all facility locations, road network of Gaziantep is used to calculate distance between facilities rather than top view distances. For instance, Figure 4 shows the network distance between 1st current pharmacy warehouse and 190th pharmacy. While top view distance between two facilities is 2502 meters, network distance getting from the road network of Gaziantep is 2993 meters. The network distances between the all facility types’ are available upon request.
Optimizing the location-allocation problem of pharmacy warehouses: A case study in Gaziantep
121
4.2.1. Solution of set covering problem
The set covering model is primarily solved with the data obtained on the basis of GIS to investigate the coverage ability of three scenarios. To do so, 6 different coverage areas in the range of 1km and 6km are examined. The results are presented in Table 3. Table 3. Results of set covering model using IP. Coverage Scenarios area (m)
Figure 3. Considered 10 current and 10 potential pharmacy warehouses in Gaziantep city center.
Figure 4. Network distance between 1st current pharmacy warehouse and 190th pharmacy.
4.2. Application of location-allocation models In this section, three different location-allocation models named as set covering, P-median and P-center problems are applied to different scenarios in Gaziantep city center. Generated scenarios based on locations of pharmacy warehouses are described in below: Scenario1: This is the situation which considers 10 current pharmacy warehouses in Gaziantep city center. Scenario2: This is the situation which considers 10 potential pharmacy warehouses instead of 10 current pharmacy warehouses in Gaziantep city center. Scenario3: This is the situation which considers 10 current and 10 potential pharmacy warehouses together in Gaziantep city center. In other words, there are 20 pharmacy warehouses in this scenario. Set covering, P-median and P-center models are applied to aforementioned scenarios and results are given below. It is noted that all IP runs were completed on a server with 1.8 GHz Intel Core processor and 4 GB of RAM. The computation time required to solve the model using the GAMS-CPLEX solver is less than 10 CPU seconds.
Scenario1 Scenario2 Scenario3 Scenario1 2000 Scenario2 Scenario3 Scenario1 3000 Scenario2 Scenario3 Scenario1 4000 Scenario2 Scenario3 Scenario1 5000 Scenario2 Scenario3 Scenario1 Scenario2 6000 Scenario3 *Infeasible solution 1000
No. demand points in coverage area * * * * * * * * * * 260 260 * 260 260 260 260 260
No. demand points out of the coverage area * * * * * * * * * * 0 0 * 0 0 0 0 0
Opened warehouses
Number of opened warehouses
* * * * * * * * * * 12-13-15-16 3-8-10-16 * 17-18 17-18 2-9 16-17 2-9
* * * * * * * * * * 4 4 * 2 2 2 2 2
The results given in Table 3 indicate that, IP model cannot find an optimal solution for 1km, 2km and 3km coverage areas. To make a comparison and get a detailed solution, set covering tool of ArcGIS Network Analysis tool is also applied to the problem. Network Analysis tool is based on the well-known Dijkstra's algorithm for finding shortest paths. The classic Dijkstra's algorithm solves a shortest-path problem on an undirected, nonnegative weighted graph. Table 4. Results of set covering model using GIS.
Scenario1
105
No. demand points out of the coverage area 155
Scenario2
164
96
Scenario3
174
86
Scenario1
187
73
Scenario2
234
26
Scenario3
238
22
Scenario1 Scenario2 Scenario3 Scenario1 Scenario2 Scenario3 Scenario1 Scenario2 Scenario3 Scenario1 Scenario2 Scenario3
225 259 259 246 260 260 254 260 260 260 260 260
35 1 1 14 0 0 6 0 0 0 0 0
Coverage Scenarios area (m)
No. demand points in coverage area
1000
2000
3000
4000
5000
6000
Opened warehouses
1-2-4-6-7-8-9 11-12-13-14-1516-17-18-19-20 1-4-7-9-11-12-1314-15-16-17-1819-20 1-3-4-5-9 11-12-13-14-1516-17-18-19-20 4-5-13-14-16-1718-19-20 1-2-3-4-9 12-13-14-16-18-20 1-8-9-13-16-17 3-8-9-10 12-13-15-16 8-10-13-16 3-4-5-9 17-18 17-18 2-9 17-18 9-17
Number of opened warehouses
7 10 14 5 10 9 5 6 6 4 4 4 4 2 2 2 2 2
122
E. Özceylan et al. / Vol.7, No.1, pp.117-129 (2017) © IJOCTA
Figure 5. Set covering problem results obtained by GIS
Figure 6. Comparison of IP (left) and GIS (right) for set covering problem (coverage area is 4000m for Scenario 3).
To use it within the context of real-world transportation data, this algorithm is modified to respect user settings such as one-way restrictions, turn restrictions, junction impedances, barriers, and sideof-street constraints while minimizing a user-specified cost attribute. The performance of Dijkstra's algorithm is further improved by using better data structures such as d-heaps. The d-heap is a priority queue data structure, a generalization of the binary heap in which the nodes have d children instead of 2. In additio, the algorithm needs to be able to model the locations anywhere along an edge, not just on junctions. Table 4
gives the results obtained by ArcGIS Network Analysis tool. According to results of Tables 3 and 4, the following outcomes can be obtained: • It is clear that Scenarios 2 and 3 have wider coverage ability than the Scenario 1 in all coverage area except in 6km. For example, while current pharmacy warehouses (Scenario 1) can cover 246 pharmacies and hospitals, Scenarios 2 and 3 can cover all the demand points in 4km coverage area. This result shows that current warehouses are not enough for supplying hospitals and pharmacies (Figure 5).
Optimizing the location-allocation problem of pharmacy warehouses: A case study in Gaziantep
Table 5. Fixed costs of potential pharmacy warehouses. Potential pharmacy warehouses 1 2 3 4 5 Fixed cost (𝒇𝒌 )($) 8151 7736 6556 6989 5769 6 7 8 9 10 5942 5368 6252 7076 5360
Scenario1
Coverage Percentage (%)
• While IP finds infeasible solutions in some coverage areas (Table 3), GIS provides detailed results for all coverage areas (Table 4). However, obtained number of demand points in and out of coverage areas is the same for both solutions. • In some coverage areas, although IP and GIS cover all demand points, opened pharmacy warehouses can be different. For instance, while IP model opened 3rd, 8th, 10th and 16th warehouses, GIS opened 8th, 10th, 13th and 16th warehouses for 4km coverage area (Figure 6). It means that there are at least two ways on which warehouses will be opened to cover all demand points. • As expected, increasing the coverage area also increases the covered demand points. Increasing the coverage area from 1km to 6km leads to an increment from 40% to 100% coverage percentage for current warehouses (Figure 7).
Scenario2
123
Scenario3
100 80 60 40 20 0 1000
2000
3000
4000
5000
6000
Coverage Area (m)
Figure 7. Coverage percentages in different coverage areas.
In addition to analysis above, set covering problem with fixed costs of potential pharmacy warehouses are considered. To do so, data between 5000$ and 1000$ are generated randomly for each potential pharmacy warehouse (Table 5). A parameter (fk ) which represents the fixed cost of potential warehouse (k) is added to the objective function (Eq. 1) of set covering problem.
Table 6. Results of set covering problem with fixed costs solved by IP. Coverage area(m) 1000 2000 3000 4000 5000 6000
Scenario2 Scenario3 Scenario2 Scenario3 Scenario2 Scenario3
No. demand points in coverage area * * * * * *
No. demand points out of the coverage area * * * * * *
Scenario2
260
0
Scenario3 Scenario2 Scenario3 Scenario2 Scenario3
260 260 260 260 260
0 0 0 0 0
Scenarios
Opened warehouses * * * * * * 12-13-1620 3-8-10-16 17-18 3-4-5-16 16-17 2-9
With fixed-costs Number of opened warehouses * * * * * * 4 4 2 4 2 2
Opened warehouses * * * * * * 12-13-1516 3-8-10-16 17-18 17-18 16-17 2-9
Without fixed-costs Number of opened warehouses * * * * * * 4 4 2 2 2 2
* Infeasible solution
Set covering problem with fixed cost is applied to Scenarios 2 and 3 due to consideration of potential warehouses. The results are presented in Table 6 which also shows the related part of solutions without fixed-costs. As it is seen, all demand points are also covered with fixed costs except in 1, 2 and 3km coverage areas. There are two different results which are shown in bold. While, 20th potential warehouse is opened instead of 15th potential warehouse in Scenario 2 with 4km coverage area; 3rd, 4th, 5th and 16th current and potential warehouses are chosen instead of 17th and 18th potential warehouses in Scenario 3 with 5km coverage area. As expected, considering the fixed costs of potential warehouses causes to select current warehouses instead of potential warehouses in one solution.
4.2.2. Solution of P-median problem
After showing the benefits of potential warehouses, we implement P-median and P-center models to assign current and potential warehouses to demand points (hospitals and pharmacies) so that the total transportation distance is minimized. P-median model is implemented assuming the demands are equal (wi =1). Due to information privacy, demand data of hospitals and pharmacies cannot be obtained. We apply the P-median model for the demand points by setting 1 to 10 values for p. The results of P-median problem obtained by IP and GIS are given in Tables 7 and 8, respectively. As it can be seen from Tables 7 and 8, results are also classified based on three scenarios as set covering problem.
E. Özceylan et al. / Vol.7, No.1, pp.117-129 (2017) © IJOCTA
124
Table 7. Results of P-median problem using IP. P 1 2 3 4 5 6 7 8 9 10
Total Distance (m) 703648.3 549791.0 473911.7 448085.6 431530.3 418835.5 409915.8 401939.2 399889.8 398401.8
Scenario1 Opened Warehouses 10 4-8 5-9-10 1-4-5-9 1-3-4-8-9 1-3-4-7-8-9 1-3-4-6-7-8-9 1-2-3-4-6-7-8-9 1-2-3-4-6-7-8-9-10 1-2-3-4-5-6-7-8-9-10
Scenario2 Opened Warehouses
Total Distance (m) 676557.4 561416.9 446711.5 389665.1 347900.4 322475.6 305611.0 288979.1 272611.1 261275.8
Total Distance (m) 676557.4 549791.0 430234.3 374944.0 330811.2 311459.3 294954.5 278586.5 265841.8 257254.8
15 15-16 11-15-16 12-15-16-17 12-16-17-19-20 12-16-17-18-19-20 12-15-16-17-18-19-20 11-12-15-16-17-18-19-20 11-12-13-15-16-17-18-19-20 11-12-13-14-15-16-17-18-1920
Scenario3 Opened Warehouses 15 4-8 6-8-16 8-10-16-17 8-9-10-16-17 5-10-16-17-18-19 7-10-11-16-17-18-19 7-10-11-13-16-17-18-19 4-6-7-11-13-16-17-18-19 1-4-6-7-11-13-16-17-1819
Table 8. Results of P-median problem using GIS. P 1 2 3 4 5 6 7 8 9 10
Total Distance (m) 703648.3 549791.0 473911.7 448085.6 431530.3 418835.5 409915.8 401939.2 399889.8 398401.8
Scenario1 Opened Warehouses 10 4-8 5-9-10 1-4-5-9 1-3-4-8-9 1-3-4-7-8-9 1-3-4-6-7-8-9 1-2-3-4-6-7-8-9 1-2-3-4-6-7-8-9-10 1-2-3-4-5-6-7-8-9-10
Scenario2 Total Distance (m) 676557.4 561416.9 446711.5 389665.1 352926.1 322475.6 305611.0 288979.1 272611.1 261275.8
Opened Warehouses 15 15-16 11-15-16 12-15-16-17 12-15-16-17-18 12-16-17-18-19-20 12-15-16-17-18-19-20 11-12-15-16-17-18-19-20 11-12-13-15-16-17-18-19-20 11-12-13-14-15-16-17-18-19-20
According to Table 7, all P-median problems are solved optimally. Although, the results obtained by GIS seem similar with the results of IP, all solutions of GIS are not optimal (Table 8). Results which are not optimal are shown with bold in Table 8. Figure 8 indicates the optimal (obtained by IP) and non-optimal (obtained by GIS) solutions for P= 5. As expected, increasing the number of P decreases the total distance between warehouses and demand points in all solutions. Results in Figure 9 show that increasing the number of pharmacy warehouses from 1 to 10, decreases the total travelled distance by 43.38%, 61.38% and 61.98% for Scenarios 1, 2 and 3, respectively. Another outcome can be seen from Figure 9 that potential warehouses provide shorter distance than the current warehouses in all P values except P= 2. While the gap between current and potential warehouses is 3.85% in P= 1, this gap is increased dramatically by 34.42% in P= 10 (Figure 10). On the other hand, Scenario 3 outperforms other scenarios in P-median problem.
Scenario3 Total Distance (m) 676557.4 549791.0 430234.3 374944.0 330811.2 314443.3 301660.6 278586.5 265841.8 257770.8
Opened Warehouses 15 4-8 6-8-16 8-10-16-17 8-9-10-16-17 8-9-10-13-16-17 4-6-8-9-13-16-17 7-10-11-13-16-17-18-19 4-6-7-11-13-16-17-18-19 4-7-11-13-14-16-17-18-19-20
In addition to analysis above, P-median problem is resolved with generated demand data for three scenarios. While demand for pharmacies is randomly generated between 5 and 10 boxes of medicine, range for hospitals is determined as 20 and 30 boxes of medicine. Demand dataset is available upon request from corresponding author. The results of P-median problem with different demand data obtained by IP are given in Table 9. According to Table 9, all P-median problems are solved optimally. As expected, increasing the number of P also decreases the total distance when different demand values exist. In fact, the case with different demand values provides less travelled distance than the case with equal demand values. Improvements (%) in travelled distance are shown in Figure 11. Results in Figure 11 show that embedding different demand values into the P-median model improve the solutions averagely by 6.68%, 8.46% and 8.71% for Scenarios 1, 2 and 3, respectively. It must be noted that changing the demand values of each pharmacy and hospital can yield different results.
Figure 8. Comparison of mathematical model (left) and GIS (right) for P-median problem (P=5).
Optimizing the location-allocation problem of pharmacy warehouses: A case study in Gaziantep
Total distance (m)
Scenario 1
Scenario 2
125
Scenario 3
750000 700000 650000 600000 550000 500000 450000 400000 350000 300000 250000 1
2
3
4
5
6
7
8
9
10
P value Figure 9. Comparison of total distances obtained by IP for P-median problem.
Figure 10. Results of P-median problem obtained by IP (P= 10). Table 9. Results of P-median problem with demand data using IP . P 1 2 3 4 5 6 7 8 9 10
Total Distance (m) 6640359.3 5171164.4 4384727.3 4185826.5 4008892.3 3905634.2 3818425.7 3741018.6 3724589.6 3714122.3
Scenario1 Opened Warehouses 10 4-8 5-6-9 4-5-6-9 3-4-6-8-9 3-4-6-7-8-9 1-3-4-6-7-8-9 1-2-3-4-6-7-8-9 1-2-3-4-6-7-8-9-10 1-2-3-4-5-6-7-8-910
Total Distance (m) 6340796.2 5222308.7 4139945.6 3624850.3 3187588.7 2938938.2 2763719.7 2599057.0 2438867.3 2360164.0
Scenario2 Opened Warehouses 15 15-16 11-15-16 12-15-16-17 11-16-17-19-20 11-16-17-18-19-20 11-12-16-17-18-19-20 11-12-13-16-17-18-19-20 11-12-13-15-16-17-18-19-20 11-12-13-14-15-16-17-18-1920
Total Distance (m) 6340796.2 5171164.4 3986775.3 3464420.1 3013817.0 2813233.8 2648571.2 2485439.7 2379573.6 2316881.7
Scenario3 Opened Warehouses 15 4-8 8-10-16 8-10-16-17 8-9-10-16-17 5-10-16-17-18-19 5-10-13-16-17-18-19 7-10-11-13-16-17-18-19 4-6-7-11-13-16-17-18-19 4-6-7-11-13-16-17-18-19-20
E. Özceylan et al. / Vol.7, No.1, pp.117-129 (2017) © IJOCTA
126
Distance improvement (%)
Improvement in Scenario 1
Improvement in Scenario 2
12 10 8 6 4 2 0 1
2
3
4
5
6
7
8
9
10
P value Figure 11. Distance improvements when different demand values are considered.
4.2.3. Solution of P-median problem
In addition to considered set covering and P-median problems, P-center problem is also investigated to minimize the longest distance between pharmacy warehouses and demand points. Table 10 presents the results of P-center problem obtained by IP. It is noted that P-center problem cannot be solved via GIS because of non-availability of the required tool in the software. According to Table 10; increasing the number of warehouses to be opened, decreases the longest distance between serving warehouses and underserved pharmacy/hospitals. In the current situation (Scenario1), the longest distance between source and demand points is fixed by 5477.8m after opening three warehouses. On the other hand, the longest distance between assigned pharmacy warehouse and demand point is obtained as 3666.7m in Scenarios 2 and 3. Figure 12 illustrates the improvements in terms of longest distance for Scenarios 1 to 3. As it can be seen from Figure 12, the minimum longest distance (5477.8m) is obtained with 3 warehouses (1-3-9) in Scenario 1. On the other hand, Scenarios 2 and 3 provide the minimum longest distance (3666.7m) with 5 warehouses. Although Scenario 1 appears like successful due to succeeding the minimum longest distance with fewer warehouses, it is clear that Pcenter model with 5 warehouses (Scenarios 2 and 3)
leads to shorter longest distance by 33.96% than the current warehouses situation (Scenario 1). The results show that with the suggested new warehouse locations, the current coverage level of pharmacies and hospitals has increased, the total transport distance has reduced substantially and the distance to the demand node, which has the longest distance to the warehouse, has also decreased. 5. Conclusion In this paper, current and possible new locations of pharmacy warehouses in Gaziantep are investigated to provide optimal distribution to hospitals and pharmacies. To do so, firstly geographic information of 10 current and 10 potential pharmacy warehouses, 231 pharmacies and 29 hospitals are gathered using GIS. Secondly, set covering, P-center and P-median models are applied to set up potential warehouses and assign pharmacies and hospitals to the opened warehouses so that the total transportation distance is minimized. Computational experiments on the case study prove that proposed approach can find new potential pharmacy warehouses which cover wider area than current warehouses to support pharmacies and hospitals in the city.
Table 10. Results of P-center problem using IP. P 1 2 3 4 5 6 7 8 9 10
Distance (m) 7321.0 5909.1 5477.8 5477.8 5477.8 5477.8 5477.8 5477.8 5477.8 5477.8
Scenario1 Opened warehouses 6 2-9 1-3-9 1-3-9-10 1-2-3-5-9 1-2-3-4-9-10 1-2-3-4-6-8-9 1-2-3-4-5-7-8-9 1-2-3-4-6-7-8-9-10 1-2-3-4-5-6-7-8-9-10
Distance (m) 7380.1 4747.1 4674.0 3720.9 3666.7 3666.7 3666.7 3666.7 3666.7 3666.7
Scenario2 Opened warehouses 14 17-18 13-17-18 12-13-14-16 12-13-14-16-19 11-12-13-14-16-19 11-12-13-14-16-18-20 11-12-13-14-15-16-18-20 11-12-13-14-15-16-17-18-20 11-12-13-14-15-16-17-18-19-20
Distance (m) 7321.0 4747.1 4674.0 3720.9 3666.7 3666.7 3666.7 3666.7 3666.7 3666.7
Scenario3 Opened warehouses 6 17-18 3-17-18 1-12-13-16 8-13-16-19-20 9-12-13-14-15-16 1-2-3-4-9-13-16 1-2-3-4-5-13-16-18 1-2-4-6-9-13-16-17-18 1-2-4-7-8-9-11-13-16-20
Optimizing the location-allocation problem of pharmacy warehouses: A case study in Gaziantep
127
Figure 12. Results of P-center problem using IP.
Consideration of the study area as city center, testing the proposed approaches with only the hospitals and pharmacies, generalization of the proposed method and determination the locations of potential warehouses are the limitations and shortcomings of the paper. To overcome mentioned shortcomings and direct potential researchers, several extensions to our method are worth further investigation. First, a webbased GIS application can be developed. Second, community health centers can be considered as another demand points besides hospitals and pharmacies. Third, investigated area can be expanded. In this case, heuristics can be required to obtain a near optimal solution, and finally multi-criteria decision making tools can be applied to determine alternative locations.
and two anonymous reviewers for their efforts to improve the quality of this paper. The authors also thank Pharmacy Chambers of Gaziantep for their help and collaboration to collect related data. First author was supported by the BAGEP Award of the Science Academy in Turkey. References [1]
Tekiner, H., Pharmacy in Turkey : past, present, and future. Pharmazie, 69 (6):477-480 (2014).
[2]
Tootelian, D.T., Wertheimer A.I., and Mikhailitchenko, A., Essentials of pharmacy management. Pharmaceutical Press (2012).
[3]
Turkish Pharmacists Association, (2016) Available from:http://dergi.tebeczane.net/public_html/ARSIV -TEBHABERLER/index.html. Accessed 11 Jan 2017.
[4]
Population statistics in 2015,
Acknowledgments The authors express sincere appreciation to the editor
(2016). Available
128
E. Özceylan et al. / Vol.7, No.1, pp.117-129 (2017) © IJOCTA from:http://www.turkstat.gov.tr/PreHaberBultenleri .do?id=6178. Accessed 11 Jan 2017.
[5]
[6]
Dokmeci, V., and Ozus, E., Spatial analysis of urban pharmacies in Istanbul. European Planning Studies, 12:585-594 (2004). Daskin, M.S., Network and discrete Locations: Models, algorithms and applications. Wiley and Sons, New York (1995).
[7]
Owen, S.H., and Daskin, M.S., Strategic facility location: A review. European Journal of Operational Research, 111 (3):423-447 (1998).
[8]
Narula, S.C., Minisum hierarchical locationallocation problems on a network: A survey. Annals of Operations Research, 6 (8):255-272 (1986).
[9]
Arabani, A.B., and Farahani, R.Z., Facility location dynamics: An overview of classifications and applications. Computers & Industrial Engineering, 62 (1):408-420 (2012).
[10] ReVelle, C.S., and Eiselt, H.A., Location analysis: A synthesis and survey. European Journal of Operational Research, 165 (1):1-19 (2005). [11] Rahman, S., and Smith, D.K., Use of locationallocation models in health service development planning in developing nations. European Journal of Operational Research, 123 (3):437-452 (2000). [12] Daskin, S., and Dean, L., Location of health care facilities. Handbook of OR/MS in Health Care: A Handbook of Methods and Applications, 43–76 (2004). [13] Rais, A., and Viana, A., Operations Research in Healthcare: a survey. International Transactions in Operational Research, 18 (1):1-31 (2011). [14] Afshari,H., and Peng,Q., Challenges and Solutions for Location of Healthcare Facilities. Industrial Engineering & Management, 03 (02) (2014). [15] Şahin, G., Süral, H., and Meral, S., Locational analysis for regionalization of Turkish Red Crescent blood services. Computers & Operations Research, 34 (3):692-704 (2007). [16] Mestre, A., Oliveira, M.,D., and Barbosa-Póvoa, A., Organizing hospitals into networks: a hierarchical and multiservice model to define location, supply and referrals in planned hospital systems. OR spectrum, 34 (2):319-348 (2012).
Implementation of Health Facilities in a New City. The Journal of the Operational Research Society, 35 (12):1047-1054 (1984). [20] Tavakoli, A., and Lightner, C., Implementing a mathematical model for locating EMS vehicles in fayetteville, NC. Computers & Operations Research, 31 (9):1549-1563 (2004). [21] Jia, H., Ordóñez, F., and Dessouky, M., Solution approaches for facility location of medical supplies for large-scale emergencies. Computers & Industrial Engineering, 52 (2):257-276 (2007). [22] Jia, H., Ordóñez, F., and Dessouky, M., A modeling framework for facility location of medical services for large-scale emergencies. IIE transactions, 39 (1):41-55 (2007). [23] Shariff, R.S.S., Moin, N.H., Omar, M., Location allocation modeling for healthcare facility planning in Malaysia. Computers & Industrial Engineering, 62 (4):1000-1010 (2012). [24] Valipour, M.T., Nedjati, A., and Kazemi, R., Solving Health Care Facility Location Problems with New Heuristic Algorithm Method. International Journal of Modeling and Optimization,12-14 (2013). [25] Jia, T., Tao, H., Qin, K., Wang, Y., Liu, C., and Gao, Q., Selecting the optimal healthcare centers with a modified P-median model: a visual analytic perspective. International journal of health geographics, 13 (1):1 (2014). [26] Kunkel, A.G., Van Itallie, E.S., and Wu, D., Optimal distribution of medical backpacks and health surveillance assistants in Malawi. Health care management science (2013). [27] Guerriero, Location Calabrian Journal of (2016).
F., Miglionico, G., and Olivito, F., and reorganization problems: The health care system case. European Operational Research, 250 (3):939-954
[28] Harper, P., Planning health services with explicit geographical considerations: a stochastic locationallocation approach. Omega, 33 (2):141-152 (2005). [29] Abdelaziz, F.B., and Masmoudi, M., A multiobjective stochastic program for hospital bed planning. Journal of the Operational Research Society, 63 (4):530-538 (2012).
[17] Farahani, R.Z., Hekmatfar, M., Fahimnia, B., and Kazemzadeh, N., Hierarchical facility location problem: Models, classifications, techniques, and applications. Computers & Industrial Engineering, 68:104-117 (2014).
[30] Mestre, A.M., Oliveira, M.D., and Barbosa-Póvoa, A.P., Location–allocation approaches for hospital network planning under uncertainty. European Journal of Operational Research, 240 (3):791-806 (2015).
[18] Teixeira, J.C., and Antunes, A.P., A hierarchical location model for public facility planning. European Journal of Operational Research, 185 (1):92-104 (2008).
[31] Lovejoy, W.S., and Li, Y., Hospital operating room capacity expansion. Management Science, 48 (11):1369-1387 (2002).
[19] Berghmans, L., Schoovaerts, P., and Teghem, J.,
[32] Stummer, C., Doerner, K., Focke, A., and Heidenberger, K., Determining location and size of
Optimizing the location-allocation problem of pharmacy warehouses: A case study in Gaziantep
129
medical departments in a hospital network: A multiobjective decision support approach. Health care management science, 7 (1):63-71 (2004).
[44] Caprara, A., Toth, P., and Fischetti, M., Algorithms for the set covering problem. Annals of Operations Research, 98 (1-4):353-371(2000).
[33] Bansal, V.K., Application of geographic information systems in construction safety planning. International Journal of Project Management, 29 (1):66-77 (2011).
[45] Li, X., Zhao, Z., Zhu, X., and Wyatt, T., Covering models and optimization techniques for emergency response facility location and planning: a review. Mathematical Methods of Operations Research, 74 (3):281-310 (2011).
[34] Keyser, J.J., Book review. The Journal of Hand Surgery, 39 (8):1649-1650 (2014). [35] Minutha, A., and Sannasiddanannavar, S.S., Planning for public health care services in Nanjangud Taluk a spatial analysis using GIS, Indian Streams Research Journal 4 (2):1-5 (2014). [36] McLafferty, S.L., GIS and health care. Annual review of public health, 24 (1):25-42 (2003). [37] Lovett, A., Haynes, R., Sünnenberg, G., and Gale, S., Car travel time and accessibility by bus to general practitioner services: a study using patient registers and GIS. Social Science & Medicine, 55 (1):97-111 (2002). [38] Grekousis, G., and Photis, Y.N., Analyzing highrisk emergency areas with GIS and neural networks: The case of Athens, Greece. The Professional Geographer, 66 (1):124-137 (2014).
[46] Beasley, J.E., An algorithm for set covering problem. European Journal of Operational Research, 31 (1):85-93 (1987). [47] Hakimi, S.L.,Optimum locations of switching centers and the absolute centers and medians of a graph. Operations research, 12 (3):450-459 (1964). [48] Kariv, O., and Hakimi, S.L., An algorithmic approach to network location problems. II: The pmedians. SIAM Journal on Applied Mathematics, 37 (3):539-560 (1979). Eren Özceylan is an assistant professor in Industrial Engineering Department, Gaziantep University, Gaziantep, Turkey. He received his PhD from Selçuk University, Computer Engineering in 2013. His research focuses on logistics and supply chain management.
[39] Sanders, L.J., Aguilar, G.D., and Bacon, C.J., A spatial analysis of the geographic distribution of musculoskeletal and general practice healthcare clinics in Auckland, New Zealand. Applied Geography, 44:69-78 (2013).
Ayşenur Uslu graduated from the Industrial Engineering Department of Selçuk University, Turkey, in 2014. She received her MS in Industrial Engineering from Gazi University in 2016, Ankara, Turkey. She is research assistant at the Department of Industrial Engineering of the Başkent University, Ankara, Turkey.
[40] Huang, B., Dignan, M., Han, D., and Johnson, O., Does distance matter? Distance to mammography facilities and stage at diagnosis of breast cancer in Kentucky. The Journal of Rural Health, 25 (4):366371 (2009).
Mehmet Erbaş is working at General Command of Mapping in Ankara. His research and teaching interests focus on the topics of the Geographic Information Systems and Remote Sensing Applications.
[41] Pearce, J., Witten, K., Hiscock, R., and Blakely, T., Are socially disadvantaged neighbourhoods deprived of health-related community resources? International journal of epidemiology, 36 (2):348355 (2007). [42] Klein, M.B., Kramer, C.B., Nelson, J., Rivara, F.P., Gibran, N.S., and Concannon, T., Geographic access to burn center hospitals. JAMA, 302 (16):1774-1781 (2009). [43] Farahani, R.Z., Asgari, N., Heidari, N., Hosseininia, M., and Goh, M., Covering problems in facility location: A review. Computers & Industrial Engineering, 62 (1):368-407 (2012).
Cihan Çetinkaya has graduated from the Turkish Military Academy in 2006. He received his MS and PhD in Industrial Engineering Department of Gazi University in 2011 and 2014, respectively. He is an Assistant Professor at the Department of Industrial Engineering at Gaziantep University, Turkey. Selçuk Kürşat İşleyen graduated from the Industrial Engineering Department of Gazi University, Turkey, in 2001. He received his MS and PhD in Industrial Engineering from the same university in 2004 and 2008, respectively. He is Associate Professor at the Department of Industrial Engineering of Gazi University, Turkey.
An International Journal of Optimization and Control: Theories & Applications (http://ijocta.balikesir.edu.tr)
This work is licensed under a Creative Commons Attribution 4.0 International License. The authors retain ownership of the copyright for their article, but they allow anyone to download, reuse, reprint, modify, distribute, and/or copy articles in IJOCTA, so long as the original authors and source are credited. To see the complete license contents, please visit http://creativecommons.org/licenses/by/4.0/.