Keywords: ordinal and binary logistic regression, biking, bicycle road ... Possession of a bicycle does not necessarily mean that its owner would use it.
Urban Transport XIX
573
Ordinal and binary logistic logit models for examination of behavioral, infrastructure and perception factors influencing biking S. Basbas1, V. Tetou1 & I. Politis2 1
Faculty of Rural and Surveying Engineering, School of Technology, Aristotle University of Thessaloniki, Greece 2 Faculty of Civil Engineering, School of Technology, Aristotle University of Thessaloniki, Greece
Abstract In the context of this paper, two logistic regression logit models are developed in order to examine a number of parameters (behavioral, infrastructure and perceptional) that might have an effect on biking potential. Almost 200 bicyclists were interviewed at the city of Thessaloniki, Greece and two models were built; an ordinal logistic model measuring the frequency of biking and a binary logistic model estimating the possibility of perceiving the bicycle road of the city as attractive or not. The ordinal model, indicated that the bicyclist aged between 25–39 years old have less possibilities to stop biking. Additionally, from the odd ratio calculation it was found that people who state that are very well informed about the benefits of biking are more unlike by 65% to use seldom the bicycle road compare to those that state that are just enough informed. Finally, amongst other important outcomes, the binary model predicted that only 7% of those who say that the bike road is safe will not perceived the bicycle road as attractive; the respective proportion for those who say that bike road is not safe is 17%. Keywords: ordinal and binary logistic regression, biking, bicycle road attractiveness.
1 Introduction and brief description of the study area Bicycling is by no-doubt considered a very effective mean, among others, for achieving the goals of sustainable mobility. In order to understand why people
WIT Transactions on The Built Environment, Vol 130, © 2013 WIT Press www.witpress.com, ISSN 1743-3509 (on-line) doi:10.2495/UT130461
574 Urban Transport XIX would like to use a bicycle for their trips, one can start by considering the types of bicyclists. For example, in a study carried out in England [1], four types of bicyclists can be identified on English roads: “responsible bicyclists, lifestyle bicyclists, commuters and hippy-go-lucky bicyclists”. Possession of a bicycle does not necessarily mean that its owner would use it. In a research in Australia it was found that “at least 395,000 unused adult bicycles sold each year after sensitivity analyses” [2]. There are many factors influencing peoples’ decision to cycle. It is well known that the social and demographic characteristics and the built environment play an important role on this decision. For example “Cycling is more popular among male, younger adults, transit users, and those who are physically active and in good health” while “Overall, cycling is only moderately associated with the neighborhood environment”, according to a research in King County, Washington [3]. Safety is also a key factor in cycling, with its weight to vary among different age groups. “The risk for the elderly is about 3 times greater than for the average bicyclist” indicated a research in Sweden [4]. As far as the children are concerned a research in Bergen, Norway indicated that “the risk of getting injured during the first 2 years of cycling is reduced if the children wait to start bicycling until 7 or 8 years of age instead of at 4 or 5 years” [5]. The type of the facility for the bicycle (separated, on-street) is strongly influence the perception of comfort by the bicyclists according to a research in Nanjing, China [6]. Factors like “precipitation, temperature, wind and snow conditions had significant and substantial independent effects on the odds of travel to work by bicycle among a diverse panel of adult bicycle commuters” showed another research in Vermont, USA [7]. Municipalities all over the world try to promote cycling through the design and implementation of relevant policies like the construction of the necessary infrastructure, the introduction of public bicycle share programs, the introduction of a bike-and-ride system etc. It was found in the Netherlands that “municipal policies do have an influence on individuals’ modal choice when considering short distances” [8]. A public bicycle share program is a popular policy addressed to University students. Research results in Valencia, Spain show that such a program “attracted about 19% of a group of university students to become regular users” [9]. Such a program was recently implemented in the campus of the Aristotle University of Thessaloniki. A number of 60 bicycles are available on a daily basis and the fee for 24h use is 4 euros [10]. As far as the bike-and-ride policy a lot could be learned from the respective experience in the Netherlands where “measures have focused to a large extent on feedering trips for which the bicycle is currently hardly used” [11]. Finally, it is important to notice that “Generally ‘cycling’ as an activity was seen as positive, but the actions of some ‘cyclists’ were disliked and for some people this behaviour affected their views about cycling” according to a research in Sydney, Australia [12]. Within the framework of all these findings, the objective of the paper is to identify which, how and in what manner a number of examined factors (behavioral, infrastructure or perceptional) are related with the attractiveness of a
WIT Transactions on The Built Environment, Vol 130, © 2013 WIT Press www.witpress.com, ISSN 1743-3509 (on-line)
Urban Transport XIX
575
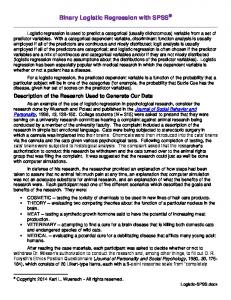
bicycle road which is located at the city of Thessaloniki, Greece and entailment with the potential for biking. The bicycle road of the city of Thessaloniki operates since 2001. A single bicycle lane with a length of 2.9 km was built along the city’s coastal zone and was mainly used for recreational purposes. In 2009, the Municipality of Thessaloniki decided to upgrade and extent the bicycle network. Today, the integrated bicycle network of the city has a total length of 11.7 km, connecting the coastal zone with the inner city. A more technical detail of the bicycle road under consideration can be found at Pitsiava et al. [13]. Figure 1 shows the bicycle road at the coastal zone.
Figure 1:
The bicycle road under examination in the city of Thessaloniki.
Due to the financial crisis in Greece, the demand for biking is very high and therefore a lot of discussion is active in the city whether the specific network is efficient and well designed to serve this demand or not, what are the perception levels of satisfaction and what could be changed so as to attract more people to bike.
2 Undertaken research Based on the literature review discussed at the introductory part of the paper, the objective of this study is to identify which, how and in what manner a number of examined factors (behavioral, infrastructure or perceptional) are related with the attractiveness of the examined bicycle road and the bicycle usage in general. As it will be discussed in the next section, we are measuring the attractiveness by setting up two different regression models, an ordinal and a binary logistic regression model. The two models were built from data derived from a questionnaire survey that was conducted within the framework of the current study. A brief description of the survey follows. 2.1 Questionnaire survey and measurement scale of the variables For the purposes of the study, a self completion questionnaire was randomly distributed to bicycle users. An effort was paid so as to provide them with comprehensible, easy-to-understand and easy-to-answer questions. The study
WIT Transactions on The Built Environment, Vol 130, © 2013 WIT Press www.witpress.com, ISSN 1743-3509 (on-line)
576 Urban Transport XIX employed direct face-to-face interviews; even though an onsite survey method is more costly than other methods (e.g. website or telephone surveys), it provides numerous benefits such as high response rate, reliability of the given answers and absence of missing values [14]. Well-trained undergraduate students were involved in data collection which took place in summer months so as to have a well representative sample [15]. Finally, 201 questionnaires were considered as valid and are used in this study. The questionnaire itself consisted of 31 questions allocated in 3 sections. The first section contained 8 questions regarding the socioeconomic background of the responder, the second section investigated the general characteristics of the responder which are related with the usage of the bicycle road (such as the trip purpose, the daily usage of bicycle, the frequency of using the bicycle road etc.) and finally, the last section examined perceptional characteristics regarding the safety, the security and the attractiveness of the bicycle road. The regression models that have been developed in the study are built either by utilizing the original responses of the participants or by creating (recoding) new variables through the combination of multiple questions. Finally, only 11 variables were used for the analysis and only these are presented and commented. Table 1 show the 11 variables used in this paper together with a short description and presentation of their measurement scale. Table 1:
Coding, description and measurement scale of the variables.
Code Gender
Description Gender of respondent
Age
Age of respondent
income
Income of respondent (thousand euros)
Aw_Bic_Pr
Awareness for Bicycle Benefits
Bic_Eas
Easiness Crossing the Bicycle Road
place
House in or out the CBD
Bic_Attr Car_Avail
Bicycle Road is Attractive Car Availability to make the trip
Bic_Us
Time of Bicycle Usage (minutes)
Bic_Saf
Bicycle Road is Safe
freq
Frequency of Bicycle Road Usage
Values 1: Male, 2: Female 1:6-18, 2:19-24, 3:25-39, 4:40-54, 5:55-64, 6:>65 1:0-0.8, 2:0.8-1.6, 3:1.7-2.4, 4:>2.5 1: no, 2:enough, 3:yes, 4:very much 1: yes, 2: no Household located at (1) or out (2) the CBD 1: yes, 2: no 1: yes, 2: no 1: never, 2:60 1: yes, 2: no 1:>1time/day, 2:1 time/day, 3:4-5 times/week, 4: 3 times/week, 5:1 time/week, 6:1-2 time/month, 7: seldom
Measure Nominal Ordinal Ordinal Ordinal Nominal Nominal Nominal Nominal Ordinal Nominal Ordinal
2.2 Descriptive statistics Table 2 presents the descriptive statistics of the variables that are examined in this study. As the table shows, most of the bicyclist responders were man (68%), aged between 6 and 18 (34%) and 25 and 39 (32%) years old, with low income (69%) with the majority of them (almost 85%) stating that they are aware about the benefits that bicycle can provide. As expected, high rates of car availability WIT Transactions on The Built Environment, Vol 130, © 2013 WIT Press www.witpress.com, ISSN 1743-3509 (on-line)
Urban Transport XIX
Table 2:
577
Descriptive statistics of the variables.
Variable name and interval levels male Gender female Total 6-18 Age 19-24 25-39 40-54 55-64 >65 Total 0-800 € Income 801-1600 € 1601-2400 € >2400 € Total enough Awareness for Bicycle Benefits yes very much Total yes Easiness to Cross the Bicycle Road no Total At the CBD House at or out the CBD Out the CBD Total Yes Bicycle Road is Attractive No Total Yes Car Availability No Total never Time of Bicycle Usage 60 min Total yes Bicycle Road is Safe no Total > 1time/day Frequency of Bicycle Road 1 time/day Usage 4-5 times/week 3 times/week 1 time/week 1-2 time/month seldom Total
Freq. 137 64 201 69 37 65 23 3 4 201 139 47 9 6 201 27 86 88 201 82 118 200 66 89 155 150 51 201 173 28 201 12 15 29 50 94 200 151 49 200 20 42 4 78 26 15 14 199
% 68,2 31,8 100,0 34,3 18,4 32,3 11,4 1,5 2,0 100,0 69,2 23,4 4,5 3,0 100,0 13,4 42,8 43,8 100,0 40,8 58,7 99,5 32,8 44,3 77,1 74,6 25,4 100,0 86,1 13,9 100,0 6,0 7,5 14,4 24,9 46,8 99,5 75,1 24,4 99,5 10,0 20,9 2,0 38,8 12,9 7,5 7,0 99,0
Cum % 68,2 100,0
Skew. ,785
Kurt. -1,397
34,3 52,7 85,1 96,5 98,0 100,0
,607
,001
69,2 92,5 97,0 100,0
1,915
3,507
13,4 56,2 100,0
-,489
-,845
41,0 100,0
-,369
-1,883
42,6 100,0
-,303
-1,933
74,6 100,0
1,140
-,707
86,1 100,0
2,099
2,430
6,0 13,5 28,0 53,0 100,0
-1,075
,169
75,5 100,0
1,195
-,578
10,1 31,2 33,2 72,4 85,4 93,0 100,0
,069
-,664
WIT Transactions on The Built Environment, Vol 130, © 2013 WIT Press www.witpress.com, ISSN 1743-3509 (on-line)
578 Urban Transport XIX to make a trip was observed. Six out of ten, are meeting difficulties to cross the bicycle road, but on the other hand bicycle road seems to be very attractive and safe for them (75% respectively). In addition, 40% of the bicyclists stated that they are biking 3 times per week and almost half (47%) of them revealed that each time they are biking for more than 60 minutes. Last two columns of Table 2, present the values for the skewness and kurtosis of the examined variables, where it can be concluded that all of them are normally distributed since the respective values are lower than “3” [16]. Finally, the response rate for the question regarding the location of the household was low (23% did not give an answer whether their household is located at or outside the Central Business District – CBD), and therefore it was decided to exclude this variable from the regression models since the stepwise procedure for treatment of missing values would further reduce the valid sample.
3 The regression models In order to investigate which and how some of the examined factors may have a cause–effect relationship with the operation of the bicycle road and the attractiveness of the bicycle as a main mode for making a trip, it was decided to test two of the above mentioned variables as dependent variables; the two variables are “the Frequency of Bicycle Road Usage” and the “Attractiveness of the Bicycle Road”. Taking into consideration the measurement scale of these two variables, already presented in Table 1, the two regression models that were built are an ordinal logistic and a binary logistic regression model respectively. The next sections present the overall fitting results, the parameter estimates, the interpetration of the results and the realiability of the models for accurate predictions. 3.1 The ordinal regression model In ordinal logistic regression, the event of interest is observing a particular score or less. For the case of the ordinal dependent variable of Frequency of Bicycle Road Usage, with j=7 categories the following odds are modeled: prob(score of i) i , where i=j-1 prob(score greater than i) The ordinal logistic model for a single dependent variable is then: ln( j ) a j The negative coefficient in the predictor variable, means than larger coefficient indicate an association with larger scores. Before trying to interpret the parameter estimates of the model, it is essential to look at the overal statistical indices that indicate whether the proposed model fits the data well and it is appropriate for estimations. The first rows of Table 3 indicate that the null hypothesis that the location coefficients for all of the variables in the model are zero, is rejected. The difference of the -2log likelihood (the chi square) has an observed signifficant level less than 0.05, meaning that the model with predictors is better than the model without predictors. Table 3
WIT Transactions on The Built Environment, Vol 130, © 2013 WIT Press www.witpress.com, ISSN 1743-3509 (on-line)
Urban Transport XIX
579
also presents the various Pseudo R-Square indices of Cox and Snell, Nagelkerke and McFadden. Finally, the table, gives the results of the Parallel line Test, indicating that the regression coefficients are not the same for all the seven categories (logits) of the dependent variable. Table 3:
Overal fitting indices for the ordinal model.
Model Fitting Information Model -2 Log Likelihood Chi-Square Intercept Only 607,475 Final 548,086 59,389 Pseudo R-Square Cox and Snell ,261 Nagelkerke ,271 McFadden ,092 Test of Parallel Lines Model -2 Log Likelihood Chi-Square Null Hypothesis 548,086 General 325,719 222,367
df
Sig.
19
,000
df
Sig.
95
,000
The following Table 4 presents the parameter (beta) estimates, the standard error (S.E.), the Wald statistic, the signifficance level as well as the exponential for the negative value of the parameter estimate of the variable. From the results of the table above, it is concluded that males do not have statistical different frequency of visiting the bicycle road compare to females. The same outcome regarding the frequency usage of the bicycle road also exists for the case of the different income levels and whether or not the car can be used as alternative mode to make the specific trip. Perception factors such as the safety and the attractiveness as well as the sensation about the easiness to cross the bicycle road also does not seem to have any statistical power for plausible outcomes. The explanatory variables that have a statistical differentiation on measuring the dependent variable are the age, the minutes of biking each time as well as the awareness about the benefits of biking. Taking into consideration the calculations that are essential for the interpretation of an ordinal logistic regression such as the cumulative logit, the cumulative odds, the cumulative proportion and the category probability (not presented in detail in this paper), the following outcomes regarding the effect of these three independent variables to the depended variable can be derived: Regarding the different age intervals: From the odd ratio calculation, it is revealed that the cyclists between 25 and 39 years old are more unlike to visit seldom the bicycle road compare to other age intervals. More specific it was calculated that cyclists aged 25–39 years old have 13% less possibility to visit rarely the bicycle road than those aged between 6-18 years old, 20% compare to those aged between 19 and 24 years old and 26% compare to those aged between 40 and 54. Regarding the minutes biking each time: The odd ratio calculation confirmed the expectation that frequent users of the bike road are those who intent to bike more minutes each time. It was found that people who bike 11–20 minutes
WIT Transactions on The Built Environment, Vol 130, © 2013 WIT Press www.witpress.com, ISSN 1743-3509 (on-line)
580 Urban Transport XIX each time are more unlike by 49% to visit rarely the bicycle road than those biking less than 10 minutes; when the comparison is between those biking 11– 20 minutes and those biking 21–60 minutes the respective possibility of visiting rarely the bicycle road is 78% less. Table 4:
Parameter estimates for the ordinal regression (Model 1). Beta estimates
S.E.
Wald
df
Sig.
Exp(-B)
Threshold [freq = 1]
1,771
1,437
1,518
1
,218
0,170
[freq = 2]
3,368
1,455
5,355
1
,021
0,034
[freq = 3]
3,476
1,457
5,695
1
,017
0,031
[freq = 4]
5,494
1,479
13,809
1
,000
0,004
[freq = 5]
6,454
1,491
18,730
1
,000
0,002
[freq = 6]
7,395
1,510
23,972
1
,000
0,001
Location [Gender=1]
,526
,296
3,150
1
,076
0,591
[Gender=2]
0a
.
.
0
.
[Age=1]
3,033
1,108
7,497
1
,006
0,048
[Age=2]
3,111
1,126
7,628
1
,006
0,045
[Age=3]
2,892
1,088
7,072
1
,008
0,055
[Age=4]
3,122
1,145
7,433
1
,006
0,044
[Age=5]
,738
1,567
,222
1
,638
0,478
[Age=6]
0a
.
.
0
.
[income=1]
,021
,882
,001
1
,981
0,979
[income=2]
,356
,837
,181
1
,670
0,700
[income=3]
1,042
1,041
1,002
1
,317
0,353
[income=4]
0a
.
.
0
.
[Car_Avail=1]
,628
,437
2,062
1
,151
[Car_Avail=2]
0a
.
.
0
.
,337
1,342
1
,247
[Bic_Saf=1]
1,478
[Bic_Saf=2]
0a
.
.
0
.
[Bic_Attr=1]
,025 Beta estimates
,336 S.E.
,005 Wald
1 df
,942 Sig.
[Bic_Attr=2]
0a
.
.
0
.
[Bic_Us=1]
1,798
,609
8,733
1
,003
0,166
[Bic_Us=2]
1,971
,550
12,823
1
,000
0,139
[Bic_Us=3]
1,474
,438
11,302
1
,001
0,229
[Bic_Us=4]
,353 .
,030 .
1 0
,863 .
1,063
[Bic_Us=5]
-,061 0a
[Bic_Eas=1]
,092
,288
,102
1
,750
0,912
[Bic_Eas=2]
0a
.
.
0
.
[Aw_Bic_Pr=2]
1,050
,432
5,913
1
,015
0,350
[Aw_Bic_Pr=3]
,136 0a
,292 .
,215 .
1 0
,643 .
0,873
[Aw_Bic_Pr=4] a
-,391
0,534
Parameter is set to zero because it is redundant.
WIT Transactions on The Built Environment, Vol 130, © 2013 WIT Press www.witpress.com, ISSN 1743-3509 (on-line)
0,976 Exp(-B)
Urban Transport XIX
581
Regarding the level of awareness about bicycle benefits: As shown in Table 4, the only differentiation in terms of statistical significance is considered between those stating that are enough informed about bicycle benefits and those stating that are very much informed about the benefits that biking can provide. From the odd ratio calculation it was found that people who state that are very well informed about the benefits of biking are more unlike by 65% to use seldom the bicycle road compare to those that state that are just enough informed. In order to measure the prediction power of the model, Table 5 present the classification between the observed and the predicted cases. It was decided to classify as frequent users of the bicycle road those people that use to bike up to 4–5 times per week. As it can be seen, the model manages to predict the observed responses in a percentage of 71%. Table 5:
Observed Frequent Usage of Bicycle Road Overall Percentage
Classification table for ordinal regression model. Predicted Frequent Usage of Bicycle Road Yes No 12 53 4 127
Yes No
Percentage Correct 18,46 96,95 70,92
3.2 The binary logistic regression model Binary logistics models are used to predic a categorical (dichotomous) variable, from a set of predictor variables. The prediction is actually measured as the possibility of event to occurre, compare to the posibility this even not to occure. In binary logistic models, the dependent variable regards the logarithm of the odds ratio and therefore the mathematical expression as a generalized linear model can be written as: p ln( i ) 0 11,i 2 2,i ...... N n,i 1 pi In terms of odds, the model above can be written as: pi ( ...... N n,i ) e 0 1 1,i 2 2,i 1 pi Or in terms of the probability of the outcome to be ocurred as: pi
e
( 0 11,i 2 2,i ...... N n,i ) (
...... )
N n,i 1 e 0 1 1,i 2 2,i In the binary logistic model of this paper, the posibility of perceived the bicycle road as attractive or no attractive is estimated. Table 6 present the results of the overall fitting statistical test, the Hosmer and Lemeshow test and the R square tests of Cox and Snell and Nagelkerke. The non rejection of the null hypothesis of Hosmer-Lemeshow test indicates that there is linear relationship between the predictor variables and the log odds of the criterion variable. The outcome therefore, is that the data are fitting the model well and there is no any specification error at the model.
WIT Transactions on The Built Environment, Vol 130, © 2013 WIT Press www.witpress.com, ISSN 1743-3509 (on-line)
582 Urban Transport XIX Table 6:
Overal fitting indices for the binary logistic regression model (2). Model Summary Cox and Snell R Square ,139 Hosmer and Lemeshow Test df 8
-2 Log likelihood 193,321 Chi-square 6,587
Table 7:
Gender(1) Age income Car Avail(1) Bic Saf(1) freq Bic Us Bic Eas(1) Aw Bic Pr Constant
Nagelkerke R Square ,204 Sig. ,582
Parameter estimates for the binary logistic regression (Model 2). Beta estimates
S.E.
,242 ,095 -,439 ,380 ,973 ,009 -,106 1,165 ,609 -3,566
,399 ,195 ,352 ,515 ,396 ,121 ,163 ,405 ,280 1,511
Wald ,368 ,238 1,553 ,546 6,028 ,006 ,426 8,270 4,723 5,571
df 1 1 1 1 1 1 1 1 1 1
Sig. ,544 ,626 ,213 ,460 ,014 ,941 ,514 ,004 ,030 ,018
Exp(B) 1,273 1,100 ,645 1,463 2,645 1,009 ,899 3,205 1,838 ,028
Table 7 presents the parameter (beta) estimates of the binary logistic regression model of the study, the standard error (SE), the Wald statistic, the significance level as well as the exponential of the beta estimates. As it was found also in the first model, differentiations at gender, income levels and whether a car is available for someone to make the specific trip or not, does not seem to have any effect on bicyclist perception regarding the attractivenes of the bike road. No statistical differentiation was also found for the examined variables of age, frequency of bicycle usage and frequency of bicycle road visit. The predictors that found to have a statistical power on dependent variable differentiation are two perceptional indicators (the easiness to cross the bicycle road and whether the bicycle road is safe or not) and one behavioral indicator (level of awareness for bicycle benefits). The explanation of how these three variables are affecting the possibility of perceiving the bicycle road attractive or not, is done in the following paragraphs through the calculation of odds, probabilities of odds and the odds ratio values (the calculations are not presented in this paper). Regarding the perception that it is easy to cross the bicycle road: From the conversion of the odds to probabilities, it is estimated that only 8% of the bicyclists who believe that it is easy to cross the road will consider the bicycle road as non attractive. For those who are meeting difficulties to cross the bicycle road the respective percentage is calculated to 23%. Finally, from the odds ratio calculation, , it can concluded that the model predicts that the odds of perceiving the bicycle road as no attractive are 2.646 times higher for those who believe the bicycle road as not easy to be crossed than for those they believe it is easy. WIT Transactions on The Built Environment, Vol 130, © 2013 WIT Press www.witpress.com, ISSN 1743-3509 (on-line)
Urban Transport XIX
583
Regarding the perception that the bicycle road is safe: From the odd calculation, it is found that those who say that bike road is safe are 0.075 as likely to say that bicycle road is not attractive as to say that it is attractive. Additionally, those who say that bike road is not safe are 0.2 as likely to say that bicycle road is not attractive as to say that it is attractive. The model predicts that only 7% of those who say that bike road is safe will not perceived the bicycle road as attractive; the respective proportion for those who say that bike road is not safe is 17%. Finally, from the odds ratio calculation, it can concluded that the model predicts that the odds of perceiving the bicycle road as no attractive are 2.646 times higher for those who believe the bicycle road as unsafe than for those they believe it is safe. Regarding the level of awareness about biking benefits: From the conversion of the odds to probabilities, it is estimated that 25% of the people who revealed that are very well informed about the benefits of biking, will consider the bicycle road as non attractive. Unexpectedly, the respective percentage for those who are not enough informed about the benefits of biking is only 5%. This result means that people who are very well informed about biking benefits (e.g. have high levels of awareness) do have higher expectations for the bicycle road than those who are not so well informed. From the odds ratio calculation, it was found that the odds of perceiving the bicycle road as no attractive are 1.84 higher for people with high level of awareness about bicycle benefits than for bicyclists with low level. As it was also presented for the first model, Table 8 presents the prediction ability of the second model where it can concluded that the prediction accuracy of the model is 76%. Table 8:
Classification table for binary regression model. Predicted Bicycle Road is Attractive
Observed Bicycle Road is Attractive
Yes
No
Percentage Correct
Yes
137
9
93,8
No
38
12
24,0
Overall Percentage
76,0
4 Conclusions The results presented in this paper as well as the methodology and the tools used, are of great of importance for policy makers and local authorities who already operate or are planning to operate a new bicycle road. In order to have an efficiency investment, such analysis regarding the targeted population as well as the interventions needed to increase the potential for biking should be carefully investigated.
References [1] Gatersleben, B. and Haddad, H., Who is the typical bicyclist? Transportation Research Part F, 13, pp. 41–48, 2010. WIT Transactions on The Built Environment, Vol 130, © 2013 WIT Press www.witpress.com, ISSN 1743-3509 (on-line)
584 Urban Transport XIX [2] Bauman, A. Merom, D. and Rissel, C., “Where have all the bicycles gone?” Are bicycle sales in Australia translated into health-enhancing levels of bicycle usage? Preventive Medicine, 54, pp. 145–147, 2012. [3] Vernez Moudon A., Lee C., Cheadle A.D., Collier C.W., Johnson D., Schmid T.L. and Weather R.D., Cycling and the built environment, a US perspective. Transportation Research Part D, 10, pp. 245–261, 2005. [4] Ekman, R., Welander G., Svanström L., Schelp L. and Santesson P., Bicycle-related injuries among the elderly – a new epidemic? Public Health, 115, pp. 38–43, 2001. [5] Hansen K.S., Eide G.E., Omenaas E., Engesæter L.B. and Viste A., Bicycle-related injuries among young children related to age at debut of cycling. Accident Analysis and Prevention, 37, pp. 71–75, 2005. [6] Li Z., Wang W., Liu P. and Ragland D.R., Physical environments influencing bicyclists’ perception of comfort on separated and on-street bicycle facilities. Transportation Research Part D, 17, pp. 256–261, 2012. [7] Flynn B.S., Dana G.S., Sears J. and Aultman-Hall L. Weather factor impacts on commuting to work by bicycle. Preventive Medicine, 54, pp. 122–124, 2012. [8] Rietveld P. and Vanessa Daniel V., Determinants of bicycle use: do municipal policies matter? Transportation Research Part A, 38, pp. 531– 550, 2004. [9] Molina-Garcia J., Castillo I., Queralt A. and J. Sallis J., Implementation of a bicycle-sharing program: An effective way of introducing cycling as mode of transport, Journal of Science and Medicine in Sport, 15, S34– S126, 2013 [10] Aristotle University of Thessaloniki, www.auth.gr [11] Martens K., Promoting bike-and-ride: The Dutch experience. Transportation Research Part A, 41, pp. 326–338, 2007. [12] Daley M. and Rissel C., Perspectives and images of cycling as a barrier or facilitator of cycling. Transport Policy, 18, pp. 211–216, 2011. [13] Pitsiava M., Basbas S., Gavanas N., Oulis I., The implementation of a cycle network in the city of Thessaloniki-Greece: Evaluation, remedial proposals and policies, 3rd Annual Traffic Management and Bus Priority Conference, Planning and Transport Research and Computation (PTRC), Liverpool, UK., 19–20 July 2011. [14] Lavrakas P., (2008), Encyclopaedia of Survey Research Methods, Sage Publications Inc [15] Tetou V., (2010) Examination of Trip Characteristics of Pedestrian at the coatal zone of the city of Thessaloniki, (in Greek) Thesis conducted and presented in the context of the Post Graduate Program “Techniques and Methods for Analysis, Management and Design of the Urban Space”, Aristotle University of Thessaloniki [16] Dodge Y., (2003), The Oxford Dictionary of Statistical Terms, OUP, ISBN 0-19-920613-9.
WIT Transactions on The Built Environment, Vol 130, © 2013 WIT Press www.witpress.com, ISSN 1743-3509 (on-line)