cross-correlogram of the unit response to amplitude-modulated tones has a latency that is nearly Independent of the stimulus intensity. In addition. the data ...
Hrarm~ Rmwch. Elsevier
17 (1985) 177-189
HRR 00583
Origin of latency shift of cochlear nerve potentials
with sound intensity
*
Aage R. M$ller Depur~~ent of Neurologrcal Surgery, Uniuersi!,~ of Pittsburgh School of Medcrne, (Received
4 October
1984; accepted
9 January
Plttshurgh. PA 15212. U.S. 4
1985)
Compound action potentials were recorded from the round window, in anesthetized rats in response to tonebursts and to continuous tones. The responses to tonebursts were compared to cross-correlograms of the responses to continuous tones that were amplitude modulated by pseudorandom noise. The cross-correlograms were similar in shape to the responses to tonebursts. but the latencies of the two cross-correlogram peaks decreased less when the sound intensity was increased from near threshold values than did the latencies of the peaks in the responses to tonebursta. When an unmodulated tone was added to these stimuli. the latencies of peaks in the response to tonebursts increased as the intensity of the unmodulated tone was increased. However, the effect of an unmodulated tone on the latencies of the peaks in the cross-correlograms was more complex: when the frequency of the unmodulated tone was below that of the modulated tone. there was a decrease in the latency of the peaks in cross-correlograms. This decrease in latency was a function of the intensity of the unmodulated tone, and was similar to the decrease in latency seen when the intensity of a single modulated tone is increased. These results are interpreted as supporting the findings of earlier research, which showed that the cross-correlogram of the unit response to amplitude-modulated tones has a latency that is nearly Independent of the stimulus intensity. In addition. the data indicate that the decrease in the latency of the peaks in the cross-correlograms of the gross response from the round window is a result of nonlinearity of the cochlear frequency analyzer and is not directly related to neural excitation in the cochlea. compound
actton
potential,
cochlear
micromechanics,
cross-correlation
Introduction
It has been shown in numerous studies that the latencies of discharges of auditory nerve fibers and cells in the cochlear nucleus decrease with increasing stimulus intensity. In these experiments, tonebursts or clicks were used as stimuli and the latency values were obtained from post stimulus time (PST) histograms of the responses. It has been shown [7] that if continuous sounds that are amplitude modulated with noise are used as stimuli in such experiments. and if the responses are cross-correlated with the noise that is used to amplitude modulate the sounds, the shape of the resulting integrated correlograms resembles PST histograms of the response to tonebursts. However, the crosscorrelograms obtained in this way and PST histo* Preliminary
results of this study were presented at the Midfor Research in winter Meeting of the Association Otolaryngology, St. Petersburg. Fla.. 1984.
037%5955/85/$03.30
(1: 1985 Elsevier Science Publishers
technique,
pseudorandom
noise
grams are different in one important respect, namely, that the latency of the cross-correlograms of the response to sounds over a wide range of intensities is constant and thus independent of the stimulus intensity, while the latency of the PST histograms decreases with increasing stimulus intensity. When the input to a linear system is cross-correlated with the output, the cross-correlogram becomes an estimate of the first-order Wiener kernel and thus an estimate of the impulse response function ,of a linear system. In the above mentioned study period histograms of the discharges recorded in response to amplitude-modulated sounds of different intensities are obtained [7]. These period histograms, locked to the periodicity of the pseudorandom noise used to modulate the stimulus, were cross-correlated with one period of the pseudorandom noise used to modulate the stimulus sound. Cross-correlograms computed in this way can be considered to be the output of a
B.V. (Biomedical
Division)
17x
system, the input of which is impulses of different amplitudes. In this case the integrated cross-correlograms were compared to the PST histograms of the responses to tonebursts. In a linear system these PST histograms are equivalent to the response to a step function, thus the same as the integrated impulse response. The results of a previous study [7] in which this comparison was made showed that the decrease in latency as a function of stimulus intensity seen when tonebursts or click sounds are used as stimuli is due to an increase in the rate of rise of the generator potential in the cochlear receptor. Similarly, an increase may be seen in the rate of rise of the excitatory postsynaptic potentials (EPSPs) in conjunction with increasing stimulus intensity. Since the rate of climb of the generator potential and the EPSP determines how long it will take for this potential to reach the threshold of firing, the latency of the response becomes a function of the stimulus intensity when transient sounds are used as stimuli. Continuous sounds above threshold, on the other hand, produce continuous generator potentials and EPSPs that repeatedly cross the threshold of firing of a neuron. Amplitude modulation of a continuous sound will only change the probability of the threshold being crossed, thus the response is not delayed for these graded potentials to climb to the firing threshold of a neuron. This means that the latency of the response is independent of the stimulus intensity. In a recent study cross-correlograms were computed of the response from the round window and the response from the cochlear nucleus to stimulation with tones and noise that were amplitude modulated with pseudorandom noise. These responses were obtained by correlating the averaged response with one period of the noise and had waveforms similar in shape to those obtained when the ear was stimulated with clicks or tonebursts [lO,ll]. In contrast to discharges recorded from single nerve fibers or nerve cells, the latencies of the peaks of these cross-correlograms decreased with increasing stimulus intensity, but to a lesser extent than did the responses to tonebursts. Further, when random noise that was amplitude modulated was used as the stimulus, the decrease in latency of the peaks in the cross-correlogram was considerably smaller than that of the response to
bursts of the same noise [lO,ll]. It was hypothesized that the decrease in latency of the cross-correlograms with increasing stimulus intensity was a result of cochlear nonlinearities [ll]. Such nonlinearities have been identified as widening in tuning [8,12,14-171, and recording from single auditory nerve fibers in response to pseudorandom noise has shown that there is a shift of the maximal response of a particular nerve fiber toward lower frequencies [8,9,12]. This shift corresponds to a shift in the location of maximal response on the basilar membrane toward the base of the cochlea. which is consistent with recent findings [4] that a loud sound can change the mechanical properties of the basilar membrane. The shift in the location of maximal response on the basilar membrane results in a shorter travel time and may thus explain the decrease in latency of the round window response to amplitude-modulated tones with increasing sound intensity [10,11]. Recently, van Gisbergen et al. studied phase-locking of single cells in the cochlear nucleus and the integration time in the cochlea and the cochlear nucleus using noise stimuli and cross-correlation techniques [2,3]. In the present study we examine the response to amplitude-modulated tones and noise and compare the obtained cross-correlograms to the responses obtained when the ear was stimulated with short tonebursts. The effects of adding continuous, unmodulated tones to these stimuli were studied. Methods Ten female Sprague-Dawley rats, weighing about 250 g each, were used in this investigation. The rats were anesthetized with urethane (I .5 g/kg bodyweight, administered intraperitoneally) and their heads positioned in a headholder with hollow earbars [5]. The outer ears were deflected and the earbars were positioned over the bony rings of the tympanic membranes. The bulla was opened through a ventral approach to gain access to the round window, and a fine Teflon-coated silver wire was secured in the bone of the bulla and its uninsulated tip was positioned on the round window. The hole in the bulla was then sealed with petroleum jelly and a reference electrode was placed on the cut muscles of the scalp. Sound was delivered through a l-inch con-
179
denser microphone (Briiel & Kjaer type 4131) [5] which led the stimulus to one ear through the hollow earbar of the headholder. The sound consisted of pure tones (generated by a Wavetek generator, type 510) and random noise that was highpass filtered (54 dB/octave). The sounds were amplitude modulated with pseudorandom noise using analog multipliers (Motorola MC 1595L) [6]. The pseudorandom noise was generated by lowpass filtering of a ternary m-sequence generated by a PDP 1 l/60 minicomputer through simulation of a nine-stage shift register with feedback from some of the stages [11,13]. Ternary noise has three levels ( - 1, 0. and + 1) and is of the so-called ‘inverserepeat’ type. The sequence used in the present study was selected according to the theory of Davies [l], had 19 682 steps, and was lowpass filtered using a digital 12-pole Butterworth filter with a cutoff frequency of 10 kHz. The number of samples was reduced to 2 048 by interpolation, and after digital-to-analog conversion (using LPA 11-k processors connected to the computer) the noise was lowpass filtered by an 18 dB/octave lowpass filter with a cutoff frequency of 3.9 kHz. The depth of modulation was 30% RMS. and the sampling interval was 30 ps which gave a noise-period length of 61.44 ms. The recorded potentials were amplified by a Grass type P511K amplifier with filter settings of 10 Hz to 10 kHz and fed into the analog-to-digital converter of the computer. The responses to amplitude-modulated sounds were averaged and stored on computer disks. Circular cross-correlation was computed off-line to a number of delays equal to or less than half of the total number of samples in the averaged sequence. Compound action potentials (CAP) were recorded in response to tone- and noisebursts of 3 ms duration and presented at an interstimulus interval of 100 ms. The rise time was 0.5 ms to 90% of full amplitude and the fall time was 0.5 ms to 10%’ of full amplitude. The same computer was used to average the responses. Results
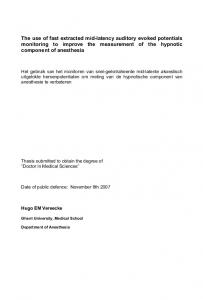
Fig. 1A shows the response recorded from the round window to 3 ms long tonebursts (solid lines) together with cross-correlograms obtained when the stimulus was 4000-Hz continuous,
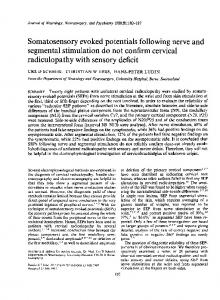
amplitude-modulated tones (dashed lines). Similar graphs for 15 kHz tones and for highpass-filtered noise are seen in Fig. 1B and C. The narrow peak seen in the correlograms at about 0.3 ms represents cochlear microphonics. The cochlear microphonics in response to tonebursts are not present in the averaged response to tonebursts because the stimuli were presented at random phase. From Fig. 1 it is evident that, except for the response to 4-kHz tones (Fig. IA) at intensities around 35 dB above the threshold for tonebursts, the waveform of the cross-correlogram resembles that of the responses to tonebursts. In addition, the earliest peak in the cross-correlogram of the response to a 4000 Hz tone is split in two at a stimulus level of 35 dB above threshold, while the second peak remains unchanged. At 45 dB and higher intensities the second peak in the cross-correlograms almost disappears and the correlograms are dominated by the earlier peak. It may be noted that the latency of the earliest peak in the crosscorrelogram is considerably shorter than that of the N, at low stimulus intensities, and that this difference in latency decreases as the stimulus intensity is increased, although at the highest level tested (65 dB above threshold) the latency of the earliest peak in the correlogram is about the same as that of N,. The abrupt change in waveform is not seen as clearly when the stimuli are 15-kHz tones and the waveform of the CAP remains almost unchanged throughout the stimulus intensity range studied. At about 20-30 dB above threshold the latencies of the CAP and the correlograms are close in value but there is still a detectable difference in latencies at 60 dB above threshold. When highpass-filtered noise is used instead of tones, the pattern is similar to that seen in response to a 15 000 Hz tone (Fig. lC), but at low stimulus intensities the peaks are sharper in the cross-correlograms than they are in the response to noisebursts. For all three different stimuli a clear wave can be seen in the cross-correlograms at sound intensities that are lower than those that give a distinguishable response to tonebursts. The latencies of the peaks in the responses shown in Fig. 1 are shown in graphical form in Fig. 2, where it is clear that the change in latency as a function of stimulus intensity is much less for the peaks in the cross-correlograms than that for
0
,
‘4 CROSS-CORRELATION
A 0
I
0
I
I
l
I
I
I
2
3
4
5
6
7
TIME
I
I 2 TIME
I 3
I
4
I 5
I
I
6
7
IN MILLISECONOS
IN MILLISECONDS
Fig. 1. (A) Responses (CAP) recorded from the round window to stimulation with 3-ms-long, 4000-Hz tonebursts (~together with cross-correlograms of the responses to amplitude-modulated tones of the same frequency f- - - - - -). The stimulus intensities are given in dB above tbreshofd for stimulation with tonebursts. (B) Similar graphs for ISOOO-Hz tones. (C) Similar graphs for highpass-filtered noise (cutoff frequency of 5Mx) Hz, 54 dB/octave).
)
1X1
5000Hz
L
0
I
HP
NOISE
I
I
I
I
I
I
2
3
4
5
6
7
TIME
IN
MILLISECONDS
the peaks in the responses to bursts of tones and noise. The largest difference in the latencies of these two types of responses is seen for highpass-
filtered noise, and the least difference is seen when 4000-Hz tones are used as stimuli. The changes in latency noted for the second peak (N,) are very similar to those for the earliest peak (N,). except when 4000-Hz tones are used as stimuli. It was speculated that the decrease in latency of the peaks in the cross-correlograms which is noted with increasing stimulus intensity might be the result of nonlinearities in the mechanical properties of the basilar membrane. In order to test this, an unmodulated, continuous tone was added to the amplitude-modulated stimulus. This second tone is not involved in producing the response, but as seen from Fig. 3, a 3000-Hz unmodulated tone decreases the latency of the peaks in the cross-correlogram when the stimulus is a 4000 Hz amplitude-modulated tone. The second tone is seen to cause a shift in both peaks in the cross-correlogram and the shift increases with increasing intensity of the unmodulated tone. Adding an unmodulated tone also decreases the amplitude of the cross-correlogram. Fig. 3 also shows the effect of a 3 kHz tone on the CAP recorded in response to 4000-Hz tonebursts that are 10 dB above threshold, and on the cross-correlograms obtained using a continuous amplitude-modulated tone as the stimulus. It is seen that the unmodulated tone affects the CAP and the cross-correlograms differently: while increasing the intensity of the continuous tone increases the latency of both peaks in the response and decreases the amplitude of the response to both tonebursts and continuous tones (cross-correlograms), the effects are much greater on the responses to the former. A clear waveform can be distinguished in the cross-correlogram in response to certain intensities of the continuous tones when no response is distinguishable to tonebursts. There is only a slight change in the waveform of the response to tonebursts or to continuous sounds as a result of adding a continuous tone. The effect of adding an unmodulated tone to the cross-correlograms is seen in more detail in Fig. 4, in which correlograms obtained without the 3000 Hz tone are compared to those obtained at different intensities of the 3000 Hz tone. It is seen that the latency of the two peaks decreases as the intensity of the 3000 Hz tone is increased. These results are obtained consistently when the stimulus
15000
Hz
2.5
CAP
\
2.0
1.5
I .o I
I
I
I
I
0
IO
20
30
40
STIMULUS DB ABOVE
INTENSITY
I
50
I
I
60
70
IN
THRESHOLD
Fig. 2. Same data as Fig. 1. Latencies of the peaks in the CAP ( -) of stimulus intensity (in dB above the threshold for CAP in response
I
I
1
I
I
I
I
I
0
IO
20
30
40
50
60
STIMULUS DE ABOVE
INTENSITY
IN
THRESHOLD
and the cross-correlograms (- - - - - -) are shown as functions to tonebursts of 3 ms duration).
183
5000Hz
C
HP
NOISE
4000Hz 3000Hz
IODB MOD. UNMOD.
N2 2.5 CROSS-
CORRELATION
2.0
NI
a
1.5
..
‘k
‘k.
I/\ --x l.
l-.
CAP
h--
CROSS-CORRELATION
---o-__
--*
I .o
L 0 I
I
I
I
I
I
0
IO
20
30
40
50
STIMULUS DB ABOVE
INTENSITY
IN
THRESHOLD
tone (tonebursts and noise-modulated tones) are 25 dB above the threshold for tonebursts. Similar results were obtained using a 3000 Hz modulated tone and a 2000 Hz unmodulated tone. When an unmodulated tone with a higher
I l
I 2 TIME
1 3
I 4
I 5
I 6
I 7
IN MILLISECONDS
and cross-correlograms Fig. 3. Effect on CAP ( p) (- - - - -) of adding a continuous tone to a 4000 Hz stimulus tone presented 10 dB above threshold. The intensity (in dB above threshold) of the unmodulated tone is given by legend numbers.
frequency than the amplitude-modulated tones is added, different and somewhat more complex results are obtained. Fig. 5 shows cross-correlograms
184
CROSS-CORRELATION 4000Hz
25DB
3000Hz
UNMOD.
MOD.
4000Hz
2508
5000Hz
UNMOD.
MOD.
i*
!
I
1 0
it ”
I 0
I
I
I
I
I
I
I
I
2
3
4
5
6
7
TIME
IN MILLISECONDS
Fig. 4. Effect of adding a continuous unmodulated tone to the cross-correlograms obtained in response to 4000-Hz tones at 25 d% above threshold. Solid lines show cross-~~elo~arns obtamed with a continuous 3000 Hz unmoduiated tone presented simultaneously. ‘Fhe intensity of this tone is given by legend number (in d% above the threshold of the CAP for tonebursts
I
I
I
I
2
3
TIME
I 4
I
I
5
6
I 7
IN MILLISECONDS
Fig. 5. Graph similar to that in Fig. 4 showing the effect of adding a 5000 Hz unmodulated tone to a 4000 Hz unmodulated tone at 25 d% above threshold.
-“---
---
of 3 ms duration); dashed lines are the cross-correlograms obtained in response to the 4000 Hz modulated tone without the unmodulated tone being present.
185
obtained in response to a 4000 Hz tone about 25 dB above threshold when a 5000 Hz continuous tone was superimposed on the stimulus tone (solid lines) compared to the cross-correlograms obtained without the unmodulated tone (dashed lines). Adding this unmodulated 5000 Hz tone results in an increase in the latency of both peaks and, in addition, a change in the waveshape of the cross-correlogram. An additional down-going peak is seen at a delay of about 1.5 ms, perhaps a result of the 5000 Hz (unmodulated) tone being modulated by the pseudorandom noise through nonlinearities in the cochlea. Comparing Figs. 4 and 5 shows that the waveform of the correlogram changes slightly more when a 5000 Hz tone is added than when a 3000 Hz tone was added. The effect on the latency of the peaks in the cross-correlograms of adding a tone to the amplitude-modulated stimulus is summarized in Figs. 6 and 7. which also show how the latencies of the peaks in the CAP are affected by an added tone. While the latencies of peak N, and N, of the CAP increase with the intensity of either the 3000 Hz or the 5000 Hz unmodulated tone, the latency of the peaks in the cross-correlograms decreases. more so when the 3000 Hz unmodulated tone than when the 5000 Hz tone is used. The results shown in Figs. 1-7 are from one single animal. but these results were consistent from animal to animal. Results from two other animals are shown in Fig. 8A and B. In these experiments a 3000 Hz tone was modulated and either a 2000 Hz or a 4000 Hz unmodulated tone was added. It is seen that adding an unmodulated tone to the modulated tone leads to a decrease in the latency of the first peak in the cross-correlogram when the frequency of the unmodulated tone is 2000 Hz; however, the latency increases when a 4000 Hz tone is added. The latencies of the peaks in the compound action potential change only slightly when a 2000 Hz tone is added. Fig. 8C shows similar results: when a 4000 Hz tone, 35 dB above threshold is amplitude modulated and a 3000 Hz unmodulated tone is added, the latency of the first peak in the cross-correlogram decreases. However. when an unmodulated tone of a higher frequency (6000 Hz) is added, there is an increase in the latency. No systematic study was conducted to de-
4000
3.0
Hz
IO DB
2.5
I -co
I
I
15
I
I
I
20
25
30
INTENSITY OF IN DB ABOVE
I
UNMOD. TONE THRESHOLD
Fig. 6. Latencies of the N, (lower curves) and N, (upper curves) peaks in the CAP () and cross-correlograms (- - - - -) shown as a function of the intensity of the added continuous tone. 0, the latencies obtained when a 5000 Hz continuous tone was added to the stimulus (4000 Hz); 0. a 3000 Hz tone was added to the stimulus. The data are the same as those displayed in Fig. 4.
4000
Hz
25DB
3000Hr
IODB
2.5
-m
0
5
IO
INTENSITY IN
I
-co
,
I
I
I
I
20
25
30
35
/
I
2.5 15 INTENSITY DB ABOVE
OF
UNMOD.TONE
40
45
15 OF
DB ABOVE
3000Hr
20
25
UNMOD.
30
35
40
TONE
THRESHOLD
IODEI
B
IN
THRESHOLD
Fig. 7. Graph similar to that in Fig. 6, obtained stimulus (4000 Hz) was 25 dB above threshold.
when
the
termine the range of stimulus frequencies over which a second unmodulated tone could decrease the latency. Nevertheless, little effect was seen when the frequency of the stimulus tone was above 6000 Hz, and the effect on the latencies of a tone with frequencies below the stimulus tone is greatest when the frequency of the tone is close to the stimulus tone.
‘; f
2.0
z F 4 g
Discussion The results of the present study show that the latencies of the peaks in the cross-correlograms of the response from the round window to tones and
I
-m
I
I
I
I
0
5
IO
15
INTENSITY IN
OF
DE ABOVE
I
20
UNMOD. THRESHOLG
I
25 TONE
I
30
I
IX7
_^
4000HZ
-m
30
35
40
45
35
50
INTENSITY IN
06
55 OF
ABOVE
DB
60
UNUOD
65
70
75
80
TONE
THRESHOLD
FIN. 8. (A and B) Results similar to those shown in Figs. 5 and 6. but obtained in two different animals using a 3000 Hz modulated tone and 2000 Hz (e) or 4000 Hz unmodulated tone (0). (C) Results from the same animal as shown in Fig. 88. obtained when a 4000 Hz modulated tone at 35 dB above threshold was used as the stimulus and a 3000 Hz (0) or 6000 Hz unmodulated tone was added (0).
noise that are amplitude modulated with pseudorandom noise decrease less with increasing stimulus intensity compared to the N,, N, peaks of the round window response to tone- and noisebursts. This confirms the results of previous studies [lO,ll]. In addition, the results of this study, as well as those of previous studies [lO,ll], indicate that it is the gradual rise of the generator potential (and EPSP) that makes the latency of the response to transient sounds decrease with increasing stimulus intensity. Because the latency of the peaks in the correlogram of the response to continuous amplitude-modulated tones and noise is less influenced by this gradual increase of the intracellular potential it is less influenced by the stimulus intensity. The finding that a tone added to an amplitudemodulated weak tone can cause a decrease in the latencies of the peaks in the cross-correlograms of the response to the modulated tone may indicate that a tone that does not participate in the generation of the response can, under certain cir-
cumstances, change the micromechanics of the basilar membrane in such a way that the peak of the envelope of the traveling wave of a different tone shifts toward the base of the cochlea. In earlier studies of the response from single auditory nerve fibers to stimulation with broadband noise, it was found that the tuning becomes broader and, particularly, that the center frequency shifts downward. as the stimulus intensity is increased [8.9,12]. This downward shift in frequency can be assumed to be equivalent to a shift in the peak of the envelope of the wave which travels on the basilar membrane toward the base of the cochlea; this in turn has the effect of shortening the distance the wave travels to reach the point of maximal excitation. If such a mechanism does in fact occur, it would explain why the latency of the peaks in the cross-correlograms of the response decrease in response to a weak tone when the intensity of an added tone is increased. The increase in the intensity of an unmodulated tone that is added to a modulated stimulus tone of constant intensity thus seems to be able to cause a decrease in the latency of the peaks in the crosscorrelogram similar to that caused by an increase in the intensity of the stimulus tone. The results of the present study seem to support the hypothesis that the latency of the peaks in the correlograms obtained using continuous amplitude-modulated sounds as stimuli decreases because basilar membrane nonlinearities shift the location of the peak of the envelope of the traveling wave toward the base of the cochlea. Assuming that the decrease in latency caused by the second tone is caused by a change in the mechanical properties of the basilar membrane, the fact that this change becomes less when the frequency difference between the stimulus tone and the added tone is increased indicates that it may be caused by a localized change in the micromechanics of the basilar membrane. Recently, psychoacoustic evidence for such localized changes has been presented by McFadden and Yama [4]. This hypothesis, however, does not explain how a second tone located above the frequency of the stimulus tone can increase the latency of the peaks in the cross-correlograms. It seems unlikely that a tone of a higher frequency can slow the traveling wave for a tone of a lower frequency to account
for the increase in latency. If so, it is evidence of a new facet of cochlear nonlinearity. Since the results of earlier studies in which recordings were made from single nerve cells show that the latency of the cross-correlation is independent of the stimulus intensity, it seems unlikely that the increase seen in the latency when a tone of a higher frequency is added would be caused by changes in neural excitation. Obviously, the process of adding a tone that does not contribute directly to the response also alters the neural excitation in the hair cells, but how this can increase the latency is not clear. In interpreting the findings of the present study it is important to consider the generator of the peaks in the CAP and the cross-correlograms. Basically, the first peak in the cross-correlograms of the response to an amplitude-modulated tone represents the phase-locking (synchrony) of the neural discharges in a population of auditory nerve fibers to the envelope (modulation) of the sound. The second peak may be assumed to represent phase-locking of cochlear nucleus cells in a similar way. The population of nerve fibers that contribute to the first peak in the cross-correlogram consists of fibers with characteristic frequencies distributed around the frequency of the stimulus tone. Adding an unmodulated tone of a different frequency will not only reduce the number of nerve fibers that contribute to the response, but may also cause a change in the population that contributes to the response. Thus, when a tone of a lower frequency than the stimulus tone is added, it may be assumed that the synchrony to the envelope of the stimulus tone of more fibers with characteristic frequencies below the frequency of the stimulus tone will be suppressed than will fibers with characteristic frequencies that are higher than the frequency of the tone. It is then these low-frequency fibers that contribute more to the response, shifting the location of fibers synchronized to the envelope of the stimulus tone towards the base of the cochlea by the mechanism of synchrony suppression. In the same way, a tone of a frequency that is higher than the stimulus tone may shift the population of fibers that contribute to the phase-locked response towards the apex. This may explain why an increase in latency time is seen when an unmodulated tone of a frequency
that is higher than that of the stimulus tone IS added. However, this does not explain why no similar shift in latency is seen in the N, peak in the CAP response to tonebursts. It is generally assumed that the N, peak in the CAP represents firing that is phase-locked to the transient (toneburst) that is used as the stimulus. Thus, neither of these hypotheses explains why the latency of the response to transient sounds (tonebursts) behaves differently from that of the peaks in the cross-correlograms. Tonebursts are likely to be subjected to frequency filtering by the basilar membrane in a way similar to that in which continuous tones are frequency filtered. Acknowledgments Part of this research was supported by a grant from the National Institutes of Health (No. 1 ROI NS21378-01). The author is grateful to Drs. J.J. Eggermont and R.L. Smith for valuable criticism and suggestions.
References
7
8
9
10
Davies, W.D.T. (1970): System Identification for SelfAdaptive Control. Wiley-Interscience. London. Gisbergen, J.A.M. van, Grashuis, J.L.. Johannesma, P.I.M. and Vendrik, A.J.H. (1975): Neurons in the cochlear nucleus investigated with tone and noise stimuli. Exp. Brain Res. 23, 387-406. Gisbergen, J.A.M. van, Grashuis, J.L.. Johannesma, P.I.M. and Vendrik, A.J.H. (1975): Statistical analysis and interpretation of the initial response of cochfear nucleus neurons to tonebursts. Exp. Brain Res. 23, 407-423. McFadden, D. and Yama, M.F. (1983): Upward shifts in the masking pattern with increasing masker intensity. J. Acoust. Sot. Am. 74, 1185-1189. Moller, A.R. (1969): Unit responses in the cochlear nucleus of the rat to pure tones. Acta Physiol. Stand. 75, 530-541. M$lIer, A.R. (1973): Statistical evaluation of the dynamic properties of cochlear nucleus units using stimuli modulated with pseudorandom noise. Brain Res. 57, 443-456. Moller, A.R. (1975): Latency of unit responses in the cochlear nucleus determined in two different ways. J. Neurophysiol. 38, 812-821. Mdller, A.R. (1977): Frequency selectivity of single auditory nerve fibers in response to broadband noise stimuli. J. Acoust. Sot. Am. 62, 135-142. M#ler, A.R. (1978): Responses of auditory nerve fibers to noise stimuli show cochlear nonlinearities. Acta Otolaryngol. 86, l-8. MoIIer, A.R. (1981): Latency in the ascending auditory
189 pathway determined using continuous sounds: Comparison between transient and envelope latency. Brain Res. 207, 184-188. 1 I Mgller. A.R. (1981): Neural delay in the ascending auditory pathway. Exp. Brain Res. 43, 93-100. 12 Moller, A.R. (1983): Frequency selectivity of phase-locking of complex sounds in the auditory nerve of the rat. Hearing Res. I I. 267-284. 13 Moller, A.R. (1983): Use of pseudorandom noise in studies of frequency selectivity: The periphery of the auditory system. Biol. Cybernetics 47. 95-102.
14 Pfeiffer. R.R. and Kim, D.O. (1975): Cochlear nerve fiber responses: Distribution along the cochlear partition. J. Acoust. Sot Am. 58, 867-869. 15 Rhode, W.S. (1971): Observations of the vibration of the basilar membrane in squirrel monkeys using the Mossbauer technique. J. Acoust. Sot. Am. 49. 1218-1231. 16 Rhode, W.S. and Robles, L. (1974): Evidence from Mossbatter experiments for nonlinear vibration in the cochlea. .I. Acoust. Sot. Am. 55, 588-596. I7 Zwislocki, J.J. (1980): Five decades of research on cochlear mechanics. J. Acoust. Sot. Am. 67. 167991685.