OS-Based Sensor Node Platform and Energy Estimation Model for Health-Care Wireless Sensor Networks Francisco J. Rinc´on1 , Michele Paselli2 , Joaqu´ın Recas1 , Qin Zhao2 , Marcos S´anchez-Elez1 , David Atienza1,3 , Julien Penders2 and Giovanni De Micheli3 1
DACYA/Universidad Complutense, Madrid, Spain. E-mail:
[email protected], {jrecas, marcos}@fis.ucm.es,
[email protected] 2 IMEC-NL, Eindhoven, The Netherlands. E-mail: {name.surname}@imec-nl.nl 3 LSI/EPFL, Lausanne, Switzerland. E-mail: {name.surname}@epfl.ch ∗
Abstract Accurate power and performance figures are critical to assess the effective design of possible sensor node architectures in Body Area Networks (BANs) since they operate on limited energy storage. Therefore, accurate power models and simulation tools that can model real-life working conditions need to be developed and validated with real platforms. In this paper we propose a sensor node platform designed for health-care applications and a validated simulation model based on event-driven operating system simulation that can be used to accurately analyze performance and power consumption in BANs composed of multiple nodes. Thus, this model can be employed to tune the node architecture and communication layer for different working conditions, applications and topologies of BANs. In this paper we validate the proposed simulation model on different reallife applications and working conditions. Our results show variations of less than 4% between the presented simulation framework and measurements in the final platforms.
1
Introduction
Wireless Sensor Networks (WSN) [2] consist of a number of spatially-distributed sensor nodes connected through a wireless network to cooperatively monitor physical magnitudes. Latest enhancements in ultra-low-power processing architectures [6] and scavenging mechanisms [8, 4] have enabled the design of low-cost, small and lightweight sensor nodes, leveraging their usage in emerging application fields such as biomedical monitoring [3]. In this case WSNs are more commonly referred as Body Area Networks (BANs). ∗ This work is partially supported by the Spanish Government Research Grant TIC 2005-5619 and the Swiss FNS Research Grant 20021-109450/1.
BANs should work autonomously and avoid maintenance, operating on very limited resources, such as batteries or energy scavengers. Replacement of power supplies in patients can be a very tedious and unpleasant task, especially if the nodes are for implantable devices. In addition, they should be adaptable and tunable for different applications. The development of efficient sensor nodes for multiple BAN applications implies optimizations at different layers of abstraction, namely, hardware, application software and Operating System (OS)-middleware (e.g., Media Access Control (MAC), task scheduler, etc.). Moreover, optimal values of individual node parameters are heavily affected by network-level parameters [3], such as the network topology or total number of active nodes in the network. Hence, the sensor node architecture can only be correctly developed and tuned for each working environment when the complete BAN can be modeled and accurate power and performance figures can be extracted. In this paper we propose a versatile OS-based sensor node platform targeting ultra-low-power BANs. It includes a porting of the TinyOS operating system [1] to enable a fast reconfiguration of the type of biomedical application to be executed in each working environment. Moreover, to enable a larger efficiency in the architectural tuning process of the node for different configurations of BANs, we also present a complete performance/energy simulation framework that models the interaction of the different layers of its architecture (i.e., hardware, OS and application). This framework relies on TOSSIM [7], an event-driven TinyOS simulator, to accurately model the functionality of the microcontroller, the radio device and communication between nodes at the physical level of WSNs. Our results show that the proposed simulation framework achieves performance and energy estimations of real-life BANs made of our OSbased sensor nodes with differences of 4% in average.
The paper is organized as follows. In Section 2, we overview related work in BAN design and modeling. In Section 3, we describe the hardware and software architecture of our health-care sensor node. The proposed OS-based performance/power modeling framework is presented in detail in Section 4. Then, in Section 5 we evaluate the accuracy of the proposed model for selected application scenarios. Finally, Section 6 summarizes the main conclusions.
2
biopotential monitoring [10]. One of these nodes is capable of monitoring up to 24 channels Electroencephalogram (EEG) and 1 channel Electrocardiogram (ECG). Deploying few of these nodes in a wireless sensor network enables the monitoring of vital signs in different locations on the body. A typical configuration would consist of a biopotential node on each limb to monitor muscle activity, one on the chest to monitor cardiac activity, and one on the head for brain activity.
Related Work
Research on Body Area Networks has received increasing interest in the last few years. We here highlight some of the most recent and relevant achievements in platforms, embedded OS and modeling framework for BANs. The CodeBlue [11] system consists of a set of devices that collect heart rate (HR), oxygen saturation (SpO2), and EKG data and relay it over a 100m range wireless network to any number of receiving devices (e.g., PDAs, laptops, or ambulance terminals). The data can be displayed in real time and integrated into the pre-hospital patient care record. The sensor devices themselves can be programmed to process the vital sign data, e.g., to raise an alert condition when vital signs fall outside of normal parameters. Besides the development of new platforms and OS, a part of the research on WSN is focused on the development of energy models and efficient power simulation tools. A number of instruction-level simulators for sensor network nodes have been developed, such as Atemu [5] and Simulavr [12]. However, the overhead required to simulate sensor nodes at the instruction level considerably limits the scalability. Other simulation environments, such as SensorSim [9] and SENS [14] incorporate a simple power usage and battery model, which are difficult to validate against actual hardware and real applications. PowerTOSSIM [13] is a power modeling extension to TOSSIM [7]. It provides an accurate and fast per-node estimate of power consumption. PowerTOSSIM employs a code-transformation technique to estimate the number of CPU cycles by counting the execution of basic blocks and mapping them to clock cycles of the microcontroller. However, several issues affect the accuracy of PowerTOSSIM for real-life BANs. First, it needs an accurate mapping from the basic blocks to binaries, since the modeling is based on basic block level. Second, some low level components and network communication effects are ignored or significantly simplified during the mapping and simulation of the complete BAN, which may affect the accuracy of the estimations.
3
3.1
Hardware Architecture
The high level architecture of the system is partitioned in three main blocks which perform the main operations: sensing, processing and transmitting the data to a collecting device (PC or PDA). The sensing part relies on a 25-channel ultra-low-power ASIC (Application Specific Integrated Circuit) to extract the biopotential signals. The processing capability is provided by a TI MSP430F149 low-power microcontroller. This small 16-bit RISC microcontroller has a very low active power (0.6 nJ/instruction), fast wakeup from stand-by to active mode (6 µs) and an on-chip 12-bit analog-to-digital converter. It also includes 60 KB of flash program memory and 2 KB of RAM. The wireless communication is based on the Nordic nRF2401, a low-power single-chip 2.4 GHz transceiver. This component has the lowest power consumption in its category, with only 10.5mA at an output power of -5 dBm and 18 mA in receive mode. Built-in power down modes allow to switch-off the radio when not used. Another interesting feature of this radio chip is the ShockBurst mode. The ShockBusrt technology uses an onchip FIFO to clock in data at a low data rate and transmit at a very high rate thus enabling extreme power reduction. Another advantage of this mode is the reduction of the processing in the microcontroller, because the radio chip also checks the address and CRC (Cyclic Redundancy Check) of the receiving packet.
3.2
Software Architecture
The software architecture of the platform has been specifically designed to match the simulation environment. As depicted in Figure 1 we chose a layered modular approach in which each platform component is a separate software block. This allows to easily replace hardware related blocks (e.g. radio, microprocessor, etc.) with their correspondent models in the simulator without modifying the upper layers (communication protocols, application, etc.). The node includes an embedded operating system, TinyOS, on top of which the entire software architecture is built.
Body Area Network Architecture
The energy model we developed is based on the BAN platform developed at IMEC Nederland. The platform features miniaturized low-power wireless sensor nodes for 2
Application
BS
SB
R
SB
SN
RB
SSRi
RB
TinyOS kernel
µC driver
ASIC driver
Radio nRF2401
µC MSP430
25-ch ASIC
TinyOS
TinyOS is an embedded operating system for wireless sensor networks. Its small footprint makes it suitable for ultralow-power microcontrollers, which usually have very small embedded memories. While a porting for the TI MSP430 microcontroller is already available within the TinyOS community, new drivers have been developed to port the radio module and the 25 channel EEG/ECG ASIC to the operating system. 3.2.2
R
RB
SSRj
Si
Sj
slots: one for the transmission of beacons (SB), and the other is kept free for the slot requests (ES). In order to be included in the network a node must perform a SSR and the base station will create a new slot (Si ), assign it to the node, and inform all the other nodes of the updated cycle time. The node performs a SSR on a random time, minimizing the risk of a collision of 2 requests within the same ES. The main difference with the previous case is that the TDMA cycle is not fixed but it depends on the network size.
Figure 1. OS-Based EEG/ECG 24+1ch sensor node architecture overview 3.2.1
Si
SB
Figure 2. Static TDMA timeline
MAC Radio driver
R
BS
SB
SN
RB
ES
SB
ES
SB
ES
R
SB
RB
SSRi
RB
SSRj
Si
RB
ES
R
R
Si
Sj
Figure 3. Dynamic TDMA timeline
4
Communication protocols
Energy modeling framework
There are two main sources of energy consumption in the node, the microcontroller and the radio. Typically the radio consumes from 50% to 90% of the total energy budget. Thus, an accurate energy model of the radio is mandatory for an effective analysis of the whole platform. For some applications however, power consumption of the microcontroller might not be negligible. Thus we decided to include it in our model. After locating the major causes of energy waste in our platform, we modeled and implemented them using TOSSIM [7]. In the following subsections we describe separately the two energy models: the microcontroller and the radio.
The networking stack of a BAN is one of the most critical parts in terms of reliability and power consumption. Therefore, some early efforts were spent in order to design an energy-efficient MAC layer that we could easily tune for a wide range of applications. We chose to implement a TDMA protocol (Time Division Multiple Access), which allows several users to share the same frequency channel by dividing the timeline into different time-slots. Each node has a slot assigned, and can use it to exchange data with the base station. The timing of the protocol is regulated by the base station, which periodically broadcasts synchronization signals (beacons) to all the nodes. In order to have a wide range of possibilities we implemented both a static TDMA, intended to networks in which the number of nodes is known in advance, and a dynamic TDMA, which can adjust himself at run-time depending on the network size. Figure 2 depicts the timeline of our static TDMA. The base station (BS) sends beacons in the SB slots and receives data from the nodes the rest of the time (R). In order to be included in the network, a sensor node i must firstly perform a request for a slot (SSRi ) to the base station and it will get a slot (Si ) when the base station accepts the request. The number of available slots is fixed and once reached the limit no other nodes are accepted in the network. Figure 3 shows the timeline of our dynamic TDMA protocol. At startup the base station timeline is divided in two
4.1
Microcontroller Model
The microcontroller is supposed to consume a very small amount of energy, which may explain why most models discard its contribution. In our model the microcontroller is not simulated at the bit level, because it would increase too much the simulation time, but we rely on PowerTOSSIM to detect whether the microcontroller is in active mode or in sleep mode. Consequently we calculate the power consumption as E = IVdd tcycle , where tcycle is the time the microcontroller spends in each of the power states. Depending on the application, the TinyOS scheduler calculates in which of the 5 available power save modes the microcontroller will be put during the inactive periods. Because of the relative complexity of the applications considered here, 3
5
the scheduler only used the first low power mode, which will be referred as the power saving mode in following discussions. We retrieved from measurements that, if supplied at 2.8V, the microcontroller drains a current of 2 mA in active mode and 0.66 mA in power saving mode. These values were used in the formula mentioned above.
4.2
Case studies
We use a 5-nodes BAN as a application case to test our modeling framework. Power numbers given below refer to the ECG node of such a BAN system, as this is the most commonly monitored vital sign. In order to validate our energy model, we tested its accuracy varying the communication protocol (MAC) and the application running over the sensor nodes. These two parameters strongly affect power consumption; therefore they are good candidates to prove the accuracy of the power estimations of our simulator. The energy model takes into account only radio and microcontroller because the power consumption of the 25-ch ASIC is constant and equal to 10.5 mW at 3.0 V. Therefore we did not include this value in the validation described in the following sections, even if not negligible.
Radio and Physical Communication Model
The other component modeled is the radio. As described in 3.1 our test platform exploits the ShockBurst mode and therefore we included it in our model. The model is based on experimental values. When supplied with 2.8V the radio drains 24.82 mA in RX mode, 17.54 mA in TX mode. The contribution of the stand-by current is neglected because lower than the resolution of our measurement set-up (< 100 µA). Besides the operational power consumption, we consider the following energy losses in our radio model: - Collisions: when two packets are transmitted at the same time and collide, they become corrupted and must be discarded and transmitted again. TOSSIM models collision as a logical or and assumes that all the packets reach the destination without errors, therefore it is impossible to detect whether a collision has happened. In our case we modeled the CRC functionality embedded in the Nordic radio chip, so that a packet can be discarded if the integrity check fails. - Idle listening: it happens when the radio is listening to the channel to receive possible data. The waste of energy due to this factor can be very high, especially in applications where there is no data to send during large periods. The power consumed for idle listening is taken into account by TOSSIM, and no improvement was found necessary. - Overhearing: this is produced when a node receives packets that are intended to other nodes. The node that is overhearing consumes energy receiving the packet and discarding it. Usually when a packet is received it is sent to the microcontroller, which will take care of checking the address, CRC, etc. This is not the case for the Nordic radio, which embeds a CRC and destination address check that we also included in the model. In this way, a packet is forwarded to the microcontroller only if the destination address of the packet corresponds to the local address. - Control packet overhead: sending, receiving and listening for control packets consume energy. Since control packets do not carry data, they reduce the throughput. Depending on the networking stack (including MAC, routing protocols, etc.) the energy consumption due to control packets can be non-negligible. Therefore we included in our model all the control packets that are transmitted and received so we can estimate accurately the energy consumption of our sensor nodes.
5.1
ECG streaming application
Electrocardiogram (ECG) monitoring is certainly one of the most interesting applications in the field of biomedical monitoring. A huge amount of information can in fact be extracted from the ECG signal, such as heart rate, heart rate variability, etc. In the first test application, a 2-channel ECG signal is extracted from a node placed on the body and transmitted to the base station. The base station receives streaming ECG data, which can be processed to obtain all the needed information. For this application, two sets of experiments were conducted. In the first case our static TDMA implementation was used to build a network of 5 nodes. Then we fixed the transmission payload of each node to 18 bytes per TDMA cycle and we considered the sampling frequency as a parameter. As the sampling frequency increases, the TDMA cycle must be reduced to avoid the overfilling of the radio payload. For example, for a sampling frequency of 55 Hz per channel we can use a TDMA cycle of 120ms, while for a sampling frequency of 205 Hz per channel the cycle must be decreased to 30 ms. Consequently, since the TDMA cycle is closely related to the duty cycle of the radio, the power consumption increases with the sampling frequency, as shown in table 1. All the values refer to the energy spent by a node in a period of 60 s. We can notice that the average estimation error is around 6%, both for the radio and the microcontroller. Also, because of precise requirements of the 24ch ASIC we had to run the microcontroller at the maximum speed, and therefore its energy consumption is not negligible with respect to the radio. This justifies the importance of having a good energy model for the microcontroller.
4
F (Hz) Cycle (ms) 205 30 105 60 70 90 55 120 Avg err
E Radio (mJ) Real Sim 540.6 502.9 267.7 252.9 177.2 167.9 132.2 126.2 5.6%
µC (mJ) Real Sim 170.2 161.2 131.6 135.9 119.4 127.6 113.7 123.5 6.0%
erwise, it returns a positive value that indicates how many samples ago a beat was detected in that channel. For example, if it returns 74, it means that the sample that we gave to the algorithm to be processed 74 calls ago was a beat. In this case, we can extract that a heart beat occurred 74*5ms=370ms ago, as each sample is taken every 5 ms. When the algorithm returns a value different from 0, a packet is sent to the base station to inform it about the detected beat. In order to be able to compare the Rpeak with the previous streaming application the same type of experiments were conducted. For the static TDMA we used the same setting as the first set of measurements, with the only difference that we could not change the sampling frequency since it is fixed by the Rpeak algorithm. Therefore we chose the TDMA cycle as the parameter. As input for the Rpeak algorithm we used an ECG signal with a heart rate of 75 beats/min. Table 3 shows the results for a simulation of 60 s. Comparing the results with the ECG streaming application we can notice that the radio energy consumption can be reduced up to 20%, and that our model can detect the improvement with a very good accuracy (Average error = 2.2%). The model also gives a good estimation of the microcontroller power consumption (Average error = 2.1%).
Table 1. Simulator estimations for ECG streaming application and static TDMA In the second set of experiments we considered a network with a variable number of nodes, based on our dynamic TDMA implementation. In this case the time slot for each node was fixed to 10 ms and we considered as parameter the number of nodes in the network. As in the previous case, the number of nodes affects the TDMA cycle length, and consequently the power consumption. In particular, as the number of nodes increases new slots are added to the TDMA cycle, and therefore the duty cycle of the radio is reduced. The sampling frequency is set accordingly to the TDMA cycle, so that a packet of 18 bytes is sent every cycle. Table 2 shows the energy results of the second set of measurements over a period of 60 s. As in the previous case, the average estimation error is below 6%, showing a good behavior of the simulator also for more advanced TDMA schemes. # nodes Cycle (ms) 1 20 2 30 3 40 4 50 5 60 Avg err
E Radio (mJ) Real Sim 628.5 665.6 451.4 496.5 356.9 354.8 298.4 281.8 263.9 249.5 5.5%
Cycle (ms) 30 60 90 120 Avg err
E µC (mJ) Real Sim 165.9 178.1 140.2 147.6 137.4 142.6 130.4 132.3 122.9 129.9 4.7%
E µC (mJ) Real Sim 153.3 145.41 139.8 137.0 135.5 134.3 133.1 132.8 2.1%
Table 3. Simulator estimations for Rpeak application and static TDMA For the dynamic TDMA we again considered the number of nodes as parameter and we performed the measurements with a constant sampling frequency of 200 Hz. Table 4 shows the results. Again, the load on the radio is decreased, and our model can detect it with an accuracy of 4%.
Table 2. Simulator estimations for ECG streaming application and dynamic TDMA
5.2
E Radio (mJ) Real Sim 446.3 455.4 228.5 229.6 159.0 154.4 113.1 116.7 2.2%
Rpeak application #nodes Cycle (ms) 1 20 2 30 3 40 4 50 5 60 Avg err
Adding a local preprocessing algorithm allows in general to have a lower load on the radio channel with a small increase of the microcontroller workload. This allows the node to save power. It is then of a major interest to investigate whether the energy simulator can detect the improvement in the power usage. The Rpeak application detects when a heart beat occurs in any of the channels. The main program takes samples from each channel at 200Hz. For each sample, it calls an algorithm that returns 0 if the current sample is not a beat. Oth-
E Radio (mJ) Real Sim 507.1 494.9 405.6 373.1 305.5 299.9 255.7 246.0 222.1 210.5 4.3%
E µC (mJ) Real Sim 150.7 153.0 144.3 141.3 141.0 137.2 138.6 135.9 136.3 134.5 3.3%
Table 4. Simulator estimations for Rpeak application and dynamic TDMA Finally, the simulations highlight the added value of in5
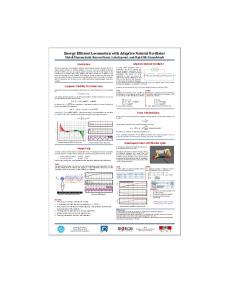
cluding a preprocessing algorithm on the sensor node instead of keeping it on the base station. Let us assume that we want to perform the Rpeak algorithm on a 2 channels ECG signal. If the algorithm runs on the base station the ECG node must stream data to the base station at 200 Hz per channel. Referring to the previous measurements this means that, for a network of five nodes based on a static TDMA, we need a cycle time of 30 ms. The total energy consumption over a period of 60 s is 710.8 mJ. Moving the Rpeak algorithm on a sensor node allows to decrease the TDMA cycle as a heart beat occurs with a lower frequency. If we refer to the case of a 120 ms TDMA cycle in table 3 we can notice that the total energy can be reduced to 246.2 mJ, with a energy save of 65%. Figure 4 shows the two cases with the respective estimations. This emphasizes the interest of having a platform which is directly coupled to an energy estimation model. Tuning the application running over the nodes can now be realized through simulation of the complete network. Results presented in this paper suggest that this can be performed with good accuracy.
development process. In this paper we have presented a novel OS-based sensor node platform designed for BANs and an accurate simulation model that can be used to analyze energy and performance of complete networks made of a variable number of our sensor nodes. The simulation model has been validated with a sensor node for biomedical applications. The results show the accuracy of the proposed model, with an average error of 4%.
References [1] D. Culler. Tinyos: Operating system design for wireless sensor networks. Sensors, pages 41–49, May 2006. [2] D. Culler, D. Estin, and M. Srivastava. Overview of sensor networks. Computer, pages 41–49, August 2004. [3] J. Feng, F. Koushanfar, and M. Potkonjak. Systemarchitectures for sensor networks issues, alternatives, and directions. ICCD, 00:226, 2002. [4] J. Hsu, J. Friedman, V. Raghunathan, A. Kansal, and M. B. Srivastava. Heliomote: Enabling self-sustained wireless sensor networks through solar energy harvesting. In ACMIEEE International Symposium on Low Power Electronic Design (ISLPED), 2005. [5] M. Karir. atemu-sensor network emulator / simulator / debugger. http://www.ist.umd.edu/CSHCN/research/atemu. [6] J. Lach, D. Evans, J. McCune, and J. Brandon. Powerefficient adaptable wireless sensor networks. In International Conference on Military and Aerospace Programmable Logic Devices (MAPLD), 2003. [7] P. Levis, N. Lee, M. Welsh, and D. Culler. Tossim: Accurate and scalable simulation of entire tinyos applications. In SenSys, August 2003. [8] J. A. Paradiso and T. Starner. Energy scavenging for mobile and wireless electronics. Pervasive Computing, IEEE, 4(1):18–27, 2005. [9] S. Park, A. Savvides, and M. Srivastava. Sensorsim: A simulation framework for sensor networks. In In Proceedings MSWIM, August 2000. [10] J. Penders, B. Gyselinckx, N. de Vicq, and T. Torfs. Body area networks for multi-modal biomedical monitoring. In pHealth, June 2007. [11] C. B. Project. http://www.eecs.harvard.edu/ mdw/proj/codeblue/. [12] T. Roth. Simulavr: an avr simulator. http://www.nongnu.org/simulavr/. [13] V. Shnayder, M. Hempstead, B. Chen, G. Allen, and M. Welsh. Simulating the power consumption of large-scale sensor network applications. In SenSys, 2004. [14] S. Sundresh, W. Kim, and G. Ahga. Sens: A sensor, environment and network simulator. In In Proceedings 37th Annual Simulation Symposium, 2004.
800.0 700.0 600.0
uC 170.2
uC 161.2
E (mJ)
500.0 400.0 300.0
Radio 540.6
Radio 502.9
200.0
uC 133.1
uC 132.8
100.0
Radio 113.1
Radio 116.7
0.0 Real
Sim ECG streaming
Real
Sim Rpeak
Figure 4. Estimation of ECG streaming application vs Rpeak application
6
Conclusions
In the last few years, WSNs for Health-Care applications (BANs) have experienced a great evolution. The driver of such an evolution is the possibility to have multi-functional autonomous systems, which are able to perform complex functions without any need of battery replacement. The task of testing applications, improving sensor nodes and optimizing BAN parameters will benefit from an accurate simulation tools and models. With this kind of tools, we can study the impact of some parameters (e.g. topologies, communication protocols, etc.) without waiting for the final implementation of the nodes, considerably speeding up the 6