Oscillatory synchronization requires precise and balanced feedback inhibition in a model of the insect antennal lobe Dominique Martinez LORIA, Campus Scientifique - BP 239 54506 Vandoeuvre-Les-Nancy, France Phone: +33 383-59-30-72 Fax: +33 383-41-30-79 Email:
[email protected]
1
Abstract
In the insect olfactory system, odor-evoked transient synchronization of antennal lobe (AL) projection neurons (PNs) is phase-locked to the oscillations of the local field potential (LFP). Sensory information is contained in the spatiotemporal synchronization pattern formed by the identities of the phase-locked PNs. The aim of the paper is to investigate the role of feedback inhibition from the local neurons (LNs) in this coding. First, experimental biological results are reproduced with a reduced computational spiking neural network model of the AL. Second, the low complexity of the model leads to a mathematical analysis from which a lower bound on the phase-locking probability is derived. Parameters involved in the bound indicate that PN phase-locking depends not only on the number of LN-evoked inhibitory postsynaptic potentials (IPSPs) previously received, but also on their temporal jitter. If the inhibition received by a PN at the current oscillatory cycle is both perfectly balanced (i.e. equal to the mean inhibitory drive) and precise (without any jitter), then the PN will be phase-locked at the next oscillatory cycle with probability one.
1
Introduction
Oscillations are very often observed in recorded electrical signals such as electroencephalograms (EEGs) or LFPs (Buzsaki and Draguhn, 2004; Wang, 2003; Kopell, 2003). These oscillations seem to play an important role in the coding of sensory information by provid2
ing a ’clock’ or temporal frame of reference for the encoding neurons. In the hippocampus of rats for example, place cells exhibit phase-dependent firing activity relative to the EEG theta oscillation (O’Keefe, 1993; Huxter et al., 2003). In the olfactory system of insects, AL projection neurons are phase-locked to the LFP oscillation (Laurent et al., 1996). Several studies have shown that inhibitory feedback shapes oscillatory synchronization, e.g. (Wang and Buzsaki, 1996; Whittington et al., 2000; B¨orgers and Kopell, 2003). These studies however have focused on macroscopic network properties, such as the emergence of oscillations and global synchronization, and did not consider the fact that some neurons exhibit phase-locked activity while others do not. How does the received inhibition affect the probability of individual neurons to be phase-locked to the simultaneously recorded field potential ? To address this question we shall use a simplified computational model of the insect AL that allows for analytic calculations. The first structure of the insect olfactory system, the AL, is formed by a small network of excitatory PNs and inhibitory LNs (see figure 1A). Only PNs project to the Mushroom Body, a higher brain structure where the LFP is recorded. In the presence of an olfactory stimulus, subsets of PNs fire in synchrony giving rise to LFP oscillations in the mushroom body. Neither global properties of the LFP oscillatory activity (e.g. the mean frequency) nor the phase of the PN or LN activity relative to the LFP have been found to convey information about odor identity (Laurent, 1996; Friedrich et al., 2004) and intensity (Stopfer et al., 2003). In contrast, the identities of the phase-locked PNs evolve in time in an odorspecific manner (Laurent and Davidowitz, 1994; Laurent et al., 1996; Wehr and Laurent, 1996; Laurent, 1999). Figure 1B clarifies the significance of phase locking in this context. 3
Both experimental and modeling studies support the functional relevance of fast LN-PN inhibition in this coding. First, when the GABAergic synapses are pharmacologically blocked, synchronization is disrupted and insects are no longer able to discriminate between similar odors (Stopfer et al., 1997; Hosler et al., 2000). Second, a recent biologically detailed model of the locust AL has shown that LN mediated inhibition can effectively control the transient synchronization of the PNs (Bazhenov et al., 2001b). This model is however difficult to analyze mathematically because of its high complexity. We propose a simplified computational spiking neural network AL model that leads to analytic calculations concerning the role of feedback LN-PN inhibition on PN phase locking. In section 2, we show that our model reproduces the transient synchronization patterns observed in modeling and experimental studies (Wehr and Laurent, 1996; Bazhenov et al., 2001b). In section 3, we derive a lower bound on the PN phase-locking probability. In section 4, we demonstrate the validity of this bound with simulation results.
2
A simplified computational spiking neural network model of the insect AL
Description of the model Our AL model is built on earlier work from Bazhenov et al. (2001b). It is a sparsely and randomly connected network of theta neurons (Ermentrout, 1996; Hoppenstead and Izhikevich, 2002) coupled via simple exponential synapses.
4
The state variable θ of a theta neuron obeys the following equation dθ = (1 − cos θ) + (1 + cos θ)αJ dt
(1)
where J is the total input current and α > 0 is a constant characterizing the neuron current-frequency response curve. Such a theta neuron can be considered as a point (cos θ, sin θ) moving on the unit circle (Ermentrout, 1996; Hoppenstead and Izhikevich, 2002) for which a spike occurs whenever θ crosses π. When J > 0 and constant, the neuron fires regularly at a frequency given by
√
αJ/π. By using the transformation v = tan(θ/2) the
theta model becomes the quadratic integrate and fire model. The schematic architecture of our AL network is depicted in figure 1A. We did not consider interconnections between PNs because they have a negligible influence both in our model and in Bazhenov et al. (2001b). Thus, the only synaptic current of a PN comes from the LNs and is given by IPsyn N (t) = −g
X i
f
H(t − tfi )e−(t−ti )/τ
(2)
where H is the Heaviside function, g ≥ 0 and τ are the strength and the time constant of the inhibitory synapses respectively, and tfi , i = 1, 2 · · ·, is the set of firing times of all the LNs that project to this particular PN. For clarity purposes, details about the model are omitted here and we refer to appendix A1 for a detailed justification of the parameters used in the model regarding the neurons, the network and the stimulus.
5
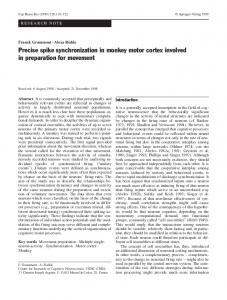
Simulation of the model In the presence of a stimulus, the network shows the following repeated characteristic behavior: a quasi-synchronized PN spike volley followed immediately by a similar LN spike volley and a silent period (see figure 2, Panel A). In subplot (j), each PN spike is represented by a dot whose size indicates the amount of inhibition the PN has received at the previous oscillatory cycle. In the simulations performed, the PNs receiving zero or one IPSP are not phase-locked. Moreover, dividing the strength of the inhibitory LN-PN synapses by a factor 10 resulted in a loss of PN synchronization and LFP oscillation (see figure 2, Panel B). Therefore a strong inhibitory feedback from the LNs is necessary for oscillatory synchronization to take place. In order to study the role of feedback inhibition, we adapted the analysis reported by Laurent et al. (1996) and Bazhenov et al. (2001b), by assigning to each PN spike a phase (−π, +π) relative to its closest LFP peak (zero phase = positive peak of the LFP). Note that the LFP is artificially generated in our simulations as the average of the PNs’ θ variables so that there is no phase lag between the peak of the LFP and the mean firing time T of the PN population. Figure 3 shows the results of this analysis for 20 different runs of the AL network and a particular PN (see figure caption for details). Transient synchronization of the PN relative to the LFP oscillation can be seen in Fig. 3 at the top. Clearly, the PN fires precisely and is phase-locked with the second, third, fourth and tenth oscillatory cycles, whereas it is not with the other cycles. As in Wehr and Laurent (1996), the output of this PN can be represented as the binary vector (0, 1, 1, 1, 0, 0, 0, 0, 0, 1), in which the
6
kth bit corresponds to synchronization or desynchronization at the kth oscillatory cycle. Depending on their particular connectivity with the set of active LNs, different PNs show different patterns of synchronization. Time evolution in these patterns is induced by a change over time in the PNs’ inhibitory drive (see Fig. 3, 2nd row). As in Bazhenov et al. (2001b), lateral inhibition and firing rate adaptation leads to a complex competition between LNs in our network so that the LNs that are active at a given oscillatory cycle are not necessarily the same that are activated at other cycles (see figure 2, Panel A). To illustrate this effect we reran simulations without any LN firing rate adaptation. In this condition, the subset of active LNs does not change any longer (see figure 2, Panel C). As a consequence of the fixed inhibitory drive, the subset of phase-locked PNs becomes time invariant, a PN being either synchronized or desynchronized at all oscillatory cycles (see Fig. 4). This stable state is reached very quickly, just after one oscillatory cycle. The number of phase-locked PNs increases with the probability p of connection and the number of activated neurons which reflects the odor concentration (model assumption in Appendix A1). As an example, about 24% of the PNs are phase-locked when the odor activates 33% of the neurons and p = 0.3. As shown in Fig. 4, a phase-locked PN produces a single spike per oscillatory cycle and the phase locking pattern is reproducible across repeated trials, in agreement with previous work (Laurent, 1996; Wehr and Laurent, 1996). These observations confirm that our model can reproduce the transient synchronization patterns seen both in experimental data (Wehr and Laurent, 1996) and in the original model of Bazhenov et al. (2001b). Furthermore, as seen in figure 3 (2nd and 3rd rows), the synchronization of a PN to the current cycle seems to depend not only on the number 7
of inhibitory spikes received at the previous cycle, as suggested by Bazhenov et al. (2001b), but also on the temporal jitter in their arrival times. This point will be developed in the next section.
3
Mathematical analysis
Firing times of inhibited PNs The previous simulations suggest that the firing time of a PN is constrained by the inhibition it has previously received. We first consider a PN receiving a single IPSP of strength g at a time tf . From Eq. (2) and appendix A1, the total input current, for t ≥ tf , is given by J(t) = I − ge−(t−t
f )/τ
where τ is the synaptic decay time and I = I ext − I th (for PNs, I adapt = 0). The PN is not allowed to fire until the inhibition has worn away sufficiently so that the total input current becomes positive. B¨orgers and Kopell (2003) have shown that the firing time T 1 of a theta neuron receiving a single strong inhibitory spike is relatively independent of the initial condition θ(t = 0). Provided g is large enough, trajectories in the phase plane (θ, J) are all attracted towards a given trajectory so that they all reach approximately the same point (π, J ? ) at firing time; see Fig. 5C in (B¨orgers and Kopell, 2003) for an illustration. The result is an almost complete loss of the initial condition θ(t = 0). Whatever the initial condition might be, the total input current is approximately equal to J ? at the firing time 8
T1
J ? ≈ J(T1 ) = I − ge−(T1 −t
f )/τ
and thus T1 ≈ τ ln g − τ ν(I) + tf where ν(I) = ln(I − J ? ). In order to obtain expressions for the firing time of a PN we have generalized B¨orgers and Kopell’s (2003) study to the case of a theta neuron receiving k strong inhibitory spikes of strength g at times tfi , i = 1 · · · k, as in eq. (2). Without loss of generality, we consider that the neuron fires after tfk . At the firing time Tk , the total input current is approximately equal to J ? J ? ≈ J(Tk ) = I −
k X
f
ge−(Tk −ti )/τ
i=1
and thus, the firing time of a PN which received k inhibitions is Tk ≈ τ ln(kg) − τ ν(I) + τ ln
k f 1X eti /τ k i=1
(3)
Note that by using Jensen’s inequality, one obtains Tk ≥ τ ln(kg) − τ ν(I)+ < tf > which means that Tk is larger than the synchronization time of the population receiving a single spike of strength kg at the mean time < tf >=
9
1 k
f i=1 ti .
Pk
Let us consider that the firing times tfi of the LNs are drawn randomly from an unknown probability density function with mean µLN and standard deviation σLN . The only random variable in Eq. (3) is thus X = τ ln
k f 1X eti /τ k i=1
√ where the mean and standard deviation are given by X ≈ µLN and σX ≈ σLN / k. These expressions for X and σX were found by considering the fact that the variance of the sum of k iid random variables, each with variance σ 2 , is kσ 2 , and that the mean and standard deviation of a function y = g(x) of a random variable x approximately depend only on the mean ηx and standard deviation σx of x : ηy ≈ g(ηx ) and σy ≈ |dg/dx|x=η σx (eq. 5-53 and 5-56 in Papoulis, 1984). Therefore the firing times of the PNs which received k inhibitions are randomly distributed with variance
2 E[(Tk − T k )2 ] = σX ≈
2 σLN k
(4)
and mean
T k ≈ τ ln(kg) − τ ν(I) + X = T 1 + τ ln k where T 1 is the mean firing time of a PN that received a single LN inhibitory spike 10
(5)
T 1 ≈ τ ln(g) − τ ν(I) + µLN
(6)
Phase-locking probability of inhibited PNs As we have seen in section 2, PNs that do not receive any inhibition are not phase-locked. Therefore we consider here only the PNs that receive some amount of inhibition. The mean firing time of these inhibited PNs is T = E[T ], where E is the expected value taken over the probability density function fT (T ). Because a PN receives at each oscillatory cycle a discrete number of LN-evoked IPSPs, the probability density function of its firing time fT (T ) can be expressed as a mixture of conditional densities
fT (T ) =
X
k≥1
pk fT (T |k)
where pk is the probability that an inhibited PN receives exactly k inhibitions and f T (T |k) is the conditional density offiring time T given k LN-caused IPSPs. Expression for pk is given in appendix A2. From the above mixture model, T is given by
T =
X
pk T k
(7)
k≥1
Replacing Eq. (5) in (7) yields T ≈ T1 + τ
X
pk ln k
k≥1
≈ T 1 + τ ln 11
(8)
a where is the mean inhibitory drive. For our model, we have = p NLN with p the a the number of active LNs. Approximation in eq. (8) probability of connection and NLN
is obtained by considering E[ln k] ≈ ln E[k] for k concentrated near its mean. This is a a valid assumption here because the variance of k corresponds to p(1 − p)NLN , which is small a because NLN is not too large.
We further consider that a PN receiving k LN-evoked IPSPs at the current oscillatory cycle will be phase-locked at the next cycle if its firing time Tk is within a temporal window of ±² ms around the ensemble mean T (see also figure 1 B). The Chebychev inequality provides a lower bound on the probability that an inhibited PN is phase-locked
P (|Tk − T | < ²) ≥ 1 −
E[(Tk − T )2 ] ²2
(9)
Using Eqs. (4),(5) and (8) it can be shown that E[(Tk − T )2 ] = E[(Tk − T k )2 ] + (T k − T )2 ≈
2 σLN k 2 + τ 2 (ln ) k
(10)
Eqs. (9) and (10) provide a lower bound on the probability that a PN receiving exactly k inhibitions is phase-locked. The first and second terms in the right hand side of (10) represent the contribution of the temporal jitter σLN and the number k of LN-evoked IPSPs at the previous oscillatory cycle, respectively. The received inhibition is said to be precise when σLN is small, such that the first term in (10) can be neglected. The inhibition is said to be balanced when k is near the mean inhibitory drive , such that the second 12
term in (10) can be neglected. When the inhibition is both balanced and precise then the phase-locking probability is close to one. The temporal jitter of the PNs spikes is given with (10) and
σP2 N
a NLN
=
X
k=1
pk E[(Tk − T )2 ]
(11)
An alternate expression for σP2 N is found by considering the number k of received IPSPs as a random variable with mean and variance σk2 . In Eq. (3), we now have a sum of a random number k of independent random variables (recall that the times of single IPSPs 2 ). By applying the formulae of the are independent random variables, with variance σLN
variance of a random sum and of a function, we found
σP2 N ≈
2 σLN σ2 + τ2 k 2
(12)
We see that σP2 N vanishes when the received inhibition is both perfectly balanced (k =, 2 σk2 = 0) and precise (σLN = 0), indicating perfect synchronization of the PN population.
When the inhibition is balanced for all the PNs, then pk = 1 for k = and pk = 0 otherwise, so that Eqs. (11) and (10) together become equivalent to Eq. (12) with σ k2 = 0. 2 When the inhibition is precise, Eq. (12) with σLN = 0 is similar to Eq. (4.20) in (B¨orgers
and Kopell, 2003).
13
4
Numerical results
The bound derived in Eqs. (9) and (10) allows one to predict which PNs will be phasedlocked at the next oscillatory cycle and which will not. This prediction only requires knowledge of the number and the jitter of the IPSPs received by individual PNs at the current LFP oscillation. It depends however on a specific choice for ². Experimental observations suggest that phase-locked PN spikes occur within a ±5 ms window (Laurent, 1999; Laurent et al., 2001). PN spikes are received by kenyon cells (KCs) in the Mushroom Body. As shown in appendix A3, the estimated firing probability for a KC receiving PN spikes within a ±5 ms window is close to the one experimentally found in (Perez-Orive et al., 2002). Therefore, in the following we choose ² = ±5 ms to determine whether a PN is phase-locked or not. As shown in figure 5, the phase-locking probability given by eqs. (9) and (10) when σ LN = 0 is an asymmetric bell-shaped function centered on the mean inhibitory drive . We consider that a given PN is phase-locked when this probability is higher than a given √ threshold Pth . It is easy to check that this will happen for k ∈ ( exp(−² 1 − Pth /τ ),
exp(² 1 − Pth /τ )). For the values used in our AL model, i.e. τ = 10 ms and ² = 5 ms, and for Pth = 0.3 –this threshold value was taken from (Wehr and Laurent, 1996)– we obtain k ∈ (0.66 , 1.52 ). Clearly, the range of inhibitory drive k that allows PN phase-locking grows with the mean inhibition . Therefore, PNs are more likely to be synchronized when a large number of LNs are active in the network. Figure 6 A compares the lower bound (eqs. 9 and 10) to the phase-locking probability
14
estimated by the simulation of our AL model. The lower bound was computed using eqs. (9) and (10) in which values for σLN and < k > at each oscillatory cycle are given by the simulation of the AL model. The bound has the same behavior as the estimated probability. Moreover it is predictive: the binary code obtained by assigning +1 for phase-locked PNs each time the bound exceeds 0.3 (Wehr and Laurent, 1996) and 0 for non phase-locked PNs, is the same as the one obtained in the simulation of our AL model (Fig. 3). Figure 6 B compares the standard deviation σP N of the firing times for the PNs computed by using eq. (10) and (11), to the one estimated by simulation. The number of active LNs a ) and the temporal jitter (σLN ) is similar to the values encountered in the simulations (NLN
of our AL model in section 2. From Fig. 6 B we see that σP N > σLN in almost all cases, indicating that PN phase-locking requires precise inhibition. Moreover, the close match between theoretical and experimental σP N values shows that the approximations made in section 3 for deriving eq. (10) are valid. In the locust AL the standard deviation of the phase, relative to the LFP oscillations, was found to be 52◦ for the PNs and 26◦ for the LNs (Laurent and Davidowitz, 1994). For 20 Hz LFP oscillations, this corresponds to σ P N ≈ 7 ms and σLN ≈ 3.8 ms, indicated by a star in Fig. 6 B. The apparent discrepancy between the σP N value derived from (Laurent and Davidowitz, 1994) and our results is probably explained by the fact that the mathematical analysis in section 3 did not take into account the PNs that do not receive any inhibition. Therefore, the σP N values computed with eq. (10) and (11) are likely to be underestimated. The period of the LFP oscillations is given in Eq. (8), where the mean inhibitory drive is a a = p NLN , with p the probability of connection and NLN the number of active LNs.
15
Because the number of activated glomeruli increases with odor concentration, the percentage of neurons receiving the stimulus reflects the odor concentration (model assumption in Appendix A1). Therefore, as odor concentration increases more LNs are active and is higher. From Eq. (8), T grows as ln and thus the frequency of the LFP oscillations should be quite robust to changes in odor concentration. This is indeed verified with simulation results from the AL model presented in figure 7 A. Moreover, as seen both in Eq. (8) and Fig. 7 A, the period of the LFP oscillation depends linearly on the decay time of the inhibitory synapses. This is in agreement with previous results, e.g. (Chow et al., 1998). As seen above, the range of inhibitory drive that allows PN phase-locking grows with and more PNs are synchronized when increases. Thus the oscillations of the LFP increase at high concentrations. This is verified in figure 7 B where the LFP becomes a pure oscillatory signal, as the percentage of neurons activated by the stimulus increases.
5
Discussion
In this paper, we outline a mathematical method for predicting PN phase-locking from feedback inhibitory input. To the best of our knowledge, this was never characterized analytically although both experimental and modeling studies have revealed the relevance of GABAergic inhibition in the synchronization of PNs (MacLeod and Laurent, 1996; Stopfer et al., 1997; Hosler et al., 2000; Bazhenov et al., 2001b). The phase-locking probability given by Eqs. (9) and (10) depends both on the number k and the temporal
16
jitter σLN of LN-evoked IPSPs. A PN will be phase-locked at the next oscillatory cycle with probability one if the inhibition received at the current cycle is both perfectly balanced (zero deviation from mean inhibition k =) and precise (zero jitter σ LN = 0). Precise inhibition is consistent with experimental data from the locust AL for which σ LN < 4 ms (Laurent and Davidowitz, 1994). Other studies have reported that phase-locked and precisely timed inhibition can be necessary for sensory coding, e.g. in the auditory system (Brand et al., 2002). In the mouse olfactory bulb however, inhibitory feedback from granule cells (GCs) is not precise. The standard deviation of the normalized phase of the IPSPs received by a mitral cell (MC), relative to the respiratory cyle, was found to be 0.09, see Fig. 6B2 in (Margrie and Schaefer, 2003). This corresponds to σGC ≈ 22 ms (respiration cycle of 250ms). Despite the jitter in their received IPSPs, MCs exhibit an oscillatory synchronized activity (Kashiwadani et al., 1999) and this synchronization is attributed to inhibitory feedback from the GCs (Lagier et al., 2004). From Eqs. (9) and (10), we see that the temporal jitter σGC contributes negatively to the MC phase-locking probability through 2 the ratio σGC /k (small ratio implies higher probability). Because of the large number of
GCs in the bulb (in the order of 106 ), the number k of IPSPs received by a particular MC at each oscillatory cycle is expected to be large. Thus there is no requirement to have precise inhibition (σGC small) in order for the MCs to be phase-locked. For oscillatory synchronization, the mouse olfactory bulb probably needs to maintain a large number of GCs. As shown in (Gheusi et al., 2000), a dramatic reduction in the number of GCs by about 40% leads to impaired odor discrimination. When the number of inhibitory cells is small, as it is the case in the locust AL (300 LNs for 830 PNs), oscillatory synchronization 17
requires precise inhibition. In our model, precision of LN firing comes from the phasic nature of excitation resulting from synchronized PNs. Synchronous LN activity can be further reinforced by the use of lateral LN-LN inhibition (see Fig. 8 D) and by the dense connectivity from PNs to LNs, found to be higher than 80% in (Jortner et al., 2003). The phase-locking probability is an asymmetric bell-shaped function centered on the inhibition received on average by the PNs. The inhibition k received by a particular PN is said to be balanced when it does not deviate too much from . If a PN receives either a fairly large or a fairly small amount k of inhibition relative to the mean inhibitory drive < k >, then it is likely that it will fire very far-away from the other PNs. In such a condition, the inhibition is not balanced and the PN is not phase-locked. The range of k allowing phase-locking grows with so that more PNs are expected to be synchronized when more LNs are activated by the stimulus. This finding is in agreement with numerical observations indicating a correlation between the amount of received inhibition and the synchronization of PNs (Bazhenov et al., 2001b). It is also consistent with experimental data showing that both LN and PN oscillatory power increases with odor concentration (Stopfer et al., 2003). Our mathematical study is based on two basic assumptions. First, we consider only one spike per neuron at each oscillation cycle. This is justified by experimental observations showing that when a PN is phased-locked, it usually produces a single spike per oscillatory cycle (Laurent, 1996; Wehr and Laurent, 1996). Second, we consider PN phase-locking as a Markov process so that only information about the inhibition received at the current oscillatory cycle is sufficient for predicting whether or not a given PN will be phase-locked 18
at the next cycle. This assumption is common and has been already made in more abstract AL models like the DNF (Quenet and Horn, 2003) or the DAL (Holub et al., 2002). Both of these AL models consist of networks of binary units with one-step discrete temporal dynamics. A discrete temporal dynamics is consistent with experimental data showing that the firing probability of a PN during a given cycle is coupled to its firing probability in a different cycle of the same trial (Wehr and Laurent, 1996). The Markov assumption is valid for the fast LN-PN inhibition considered in our model because the time constant of the inhibitory synapse (10 ms) is much lower than the period of the LFP oscillation (50 ms). Both experimental and modeling results have shown that PN synchronization is generated by fast GABAergic inhibition while slow PN temporal patterning comes from another distinct inhibitory mechanism (MacLeod and Laurent, 1996; Bazhenov et al., 2001a). The Markov assumption however would not be appropriate for studying slow LN-PN inhibition for which the time constant is much higher than the period of the oscillation.
Appendix A1. Parameters used for the AL model Stimulus : The dose response curve of an olfactory glomerulus in insects and mammals has a sigmoid shape (Meister and Bonhoeffer, 2001; Wachowiak and Cohen, 2001; Wang et al., 2003; Sachse and Galizia, 2003). For simplicity, we consider a binary glomerular response (active or inactive) as in (Ng et al., 2002). In the insect AL, both PNs and LNs
19
receive inputs from the glomeruli. Because the number of activated glomeruli increases with odor concentration (Ng et al., 2002; Sachse and Galizia, 2003), the percentage of neurons in our network receiving the external input mimic odor concentration. Unless otherwise specified, the input is applied to 33% of the neurons chosen at random. For each one of these activated neurons, the input consists of a constant current I ext = 0.75 with added gaussian noise (0.1 standard deviation) of 600 ms duration (stimulus onset randomly chosen between 0 and 30 ms), see Fig. 8 A. Neurons : In the locust, PNs fire classical Sodium action potentials but LNs do not. When stimulated by a constant current, LNs produce Calcium-like spikelets whose frequency decreases during the duration of the stimulation (Laurent et al., 1993). We simulated the conductance based models of PNs and LNs from Bazhenov et al. (2001b) and found that their firing frequency in response to a constant input current can be arbitrarily low (type I excitability). In order to reduce complexity we choose to use the quadratic integrate-andfire model or the equivalent non-diverging theta model, both of which are known to be very good approximations of any type I neuron around the threshold (Ermentrout, 1996; Hoppenstead and Izhikevich, 2002). The equation for the theta neuron is given by Eq. (1) where the total input current is J = I − I adapt + I syn I = I ext − I th where I ext is the external current and I th denotes the threshold, i.e. the minimal current required for repetitive firing. I adapt and I syn are the adaptation and synaptic current, respectively. Parameters α and I th of the theta neurons have been fitted 20
such as to obtain the same frequency-current response than their equivalent conductance based neuron without firing rate adaptation (see Fig. 8 B). PNs and LNs have a threshold of 0.53 and 0.79 respectively, which means that the LNs are less excitable than the PNs. The constant α was 0.05 for a PN and 0.1 for a LN. In (Bazhenov et al., 2001b), the LN has an adaptation current but the PN does not. We therefore introduced in our LN theta model a slow adaptation current whose form was given by (Izhikevich, 2000). For PNs, I adapt = 0. For LNs, I adapt increases of a fixed step equal to 0.05 whenever the cell fires and then relaxes exponentially towards zero with a decay rate of 200 ms. The frequency-current response of the adapting LN is shown in Fig. 8 B and responses of PN and LN to current pulses of different amplitude are shown in Fig. 8 C. A more realistic shape for the LN Ca 2+ spikes, similar to the one in (Bazhenov et al., 2001b), can be obtained by introducing an additional parameter β such that Eq. (1) becomes dθ/dt = (1 − cos θ)β + (1 + cos θ)αJ. When J > 0 and is constant, the firing frequency is given by
√ αβJ/π while the spike
width can be adjusted by the ratio α/β; see bottom trace in Fig. 8 C and (B¨orgers and Kopell, 2003) for a discussion about the spike width in the theta neuron. However, because simulation results were not dependent on a particular shape of the LN spikes, the simpler LN model given by Eq. (1) was used. Network : The AL network is a sparsely and randomly connected network with the same probability p = 0.5 of connection from LNs to PNs, PNs to LNs and between LNs. We did not consider interconnections between PNs because they seem to have a negligible influence in the original model of (Bazhenov et al., 2001b). Neurons are coupled via simple exponential synapses. When two neurons are connected, the connection strength is 0.05 21
between a PN and a LN, -0.5 between a LN and a PN and -0.1 between two LNs. The time constant is 5 ms and 10 ms for the excitatory and inhibitory synapse, respectively.
A2. Probability that an inhibited PN receives exactly k inhibitions In presence of a stimulus, the number of active LNs changes over time (see e.g. 2 A). a be the number of LNs that are active at the current LFP oscillation and p Let NLN
the probability of connection from LNs to PNs (p = 0.5 for the AL model). Then the probability that a PN receives k inhibitions from the LNs with k ≥ 0 is simply given by a the binomial distribution with parameters NLN and p a NLN PP N (X = k) = k
Ã
!
a
pk (1 − p)NLN −k
The probability that an inhibited PN receives exactly k inhibitions with k ≥ 1 is actually a conditional probability that can be found using Bayes rule pk = PP N (X = k|k ≥ 1) =
PP N (X = k) 1 − PP N (X = 0)
A3. Firing probability for a KC receiving PN spikes within a ±5 ms window Experimental observations suggest that PN spikes occur within a 5 ms window when they are phase-locked (Laurent, 1999). In order to check if this value could be used for estimating the lower bound, we have simulated a conductance based model of a KC given in (Ikeno 22
and Usui, 1999) with k input spikes generated with a uniform distribution in a ² = ±5 ms window. The synaptic currents have been modeled as double exponentials with parameter values (peak current, decay and rise time constants) given in (Su and O’Dowd, 2003). The conditional probability for the KC to fire given k input spikes phase-locked at ² = ±5 ms has been estimated as the average over 200 runs which gives P f (k) = 0 for k < 3, P f (3) = 0.79 and P f (k) = 1 for k > 3. Assuming nKC random connections from the PNs, the probability for a KC of receiving such phase-locked k PN spikes is given by the binomial distribution Ã
nKC P (k) = k
!
PPk N (1 − PP N )nKC −k
where PP N is the probability of a PN to be phase-locked. Finally, the probability of a KC to fire is simply PKC =
nX KC
P (k)P f (k)
k=0
We consider nKC = 15 (it is known that 10 ≤ nKC ≤ 20 for the locust), PP N ≈ 0.1 (Wehr and Laurent, 1996) and P f (k) estimated as above for ² = ±5 ms. We find PKC = 0.16 which is in agreement with the KC response probability of 0.1 found experimentally in (Perez-Orive et al., 2002). Therefore, ² = ±5 ms appears to be a correct value for determining if a PN is phase-locked.
Acknowledgments This work was supported by a Cooperative Research Initiative from INRIA and by the European Network of Excellence GOSPEL (General Olfaction and Sensing Projects on a 23
European Level).
References Bazhenov, M., Stopfer, M., Rabinovich, M., Abarbanel, H., Sejnowski, T., and Laurent, G. (2001a). Model of cellular and network mechanisms for odor-evoked temporal patterning in the locust antennal lobe. Neuron, 30:569–581. Bazhenov, M., Stopfer, M., Rabinovich, M., Huerta, R., Abarbanel, H., Sejnowski, T., and Laurent, G. (2001b). Model of transient synchronization in the locust antennal lobe. Neuron, 30:553–567. B¨orgers, C. and Kopell, N. (2003). Synchronization in networks of excitatory and inhibitory neurons with sparse, random connectivity. Neural Computation, 15:509–538. Brand, A., Behrend, O., Marquardt, T., McAlpine, D., and Grothe, B. (2002). Precise inhibition is essential for microsecond interaural time difference coding. Nature, 417:543–547. Buzsaki, G. and Draguhn, A. (2004). Neuronal oscillations in cortical networks. Science, 304:1926–1929. Chow, C., White, J., Ritt, J., and Kopell, N. (1998). Frequency control in synchronized networks of inhibitory neurons. Journal of computational neuroscience, 5:407–420.
24
Ermentrout, B. (1996). Type 1 membranes, phase resetting curves, and synchrony. Neural computation, 8:979–1001. Ermentrout, B. (1998). Linearization of f-i curves by adaptation. Neural computation, 10:1721–1729. Friedrich, R., Habermann, C., and Laurent, G. (2004). Multiplexing using synchrony in the zebrafish olfactory bulb. Nature Neuroscience, 7:862–871. Gheusi, G., Cremer, H., McLean, H., Chazal, G., Vincent, J.-D., and Lledo, P.-M. (2000). Importance of newly generated neurons in the adult olfactory bulb for odor discrimination. PNAS, 97:1823–1828. Holub, A., Laurent, G., and Perona, P. (2002). A digital antennal lobe for pattern equalization: analysis and design, volume 15. Advances in Neural Information Processing Systems. Hoppenstead, F. and Izhikevich, E. (2002). Canonical neural models in Brain theory and neural networks, 2nd Ed. MIT Press, Cambridge, MA. Hosler, J., Buxton, K., and Smith, B. (2000). Impairment of olfactory discrimination by blockade of gaba and nitric oxide activity in the honey bee antennal lobes. Behavioral neuroscience, 114:514–525. Huxter, J., Burgess, N., and O’Keefe, J. (2003). Independent rate and temporal coding in the hippocampla pyramidal cells. Nature, 425:828–832.
25
Ikeno, H. and Usui, S. (1999). Mathematical description of ionic currents of the kenyon cell in the mushroom body of honeybee. Neurocomputing, 26-27:177–184. Izhikevich, E. (2000). Neural excitability, spiking and bursting. International Journal of Bifurcation and Chaos, 10:1171–1267. Jortner, R., Mazor, O., and Laurent, G. (2003). Local connectivity in the locust antennal lobe. CNS abstract. Kashiwadani, H., Sasaki, Y., Uchida, N., and Mori, K. (1999). Synchronized oscillatory discharges of mitral/tufted cells with different molecular receptive ranges in the rabbit olfactory bulb. Journal of Neurophysiology, 82:1786–1792. Kopell, N. (2003). We got rhythm: dynamical systems of the nervous system. Notices of the AMS, 47:6–16. Lagier, S., Carleton, A., and Lledo, P.-M. (2004). Interplay between local gabaergic interneurons and relay neurons generate γ oscillations in the rat olfactory bulb. The Journal of Neuroscience, 24:4382–4392. Laurent, G. (1996). Dynamical neural assemblies. TINS, 19:489–496. Laurent, G. (1999). A systems perspective on early olfactory coding. Science, 286:723–728. Laurent, G. and Davidowitz, H. (1994). Encoding of olfactory information with oscillating neural assemblies. Science, 265:1872–1875.
26
Laurent, G., Seymour-Laurent, K., and Johnson, K. (1993). Dendritic excitability and a voltage-gated calcium current in locust nonspiking local interneurons. Journal of Neurophysiology, 69:1484–1498. Laurent, G., Stopfer, M., Friedrich, R., Rabinovich, M., Volkovskii, A., and Abarbanel, H. (2001). Odor coding as an active, dynamical process: experiments, computation and theory. Annu. Rev. Neurosci., 24:263–297. Laurent, G., Wehr, M., and Davidowitz, D. (1996). Temporal representations of odors in an olfactory network. The journal of Neuroscience, 16:3837–3847. MacLeod, K. and Laurent, G. (1996). Distinct mechanisms for synchronization and temporal patterning of odor-encoding neural assemblies. Science, 274:976–979. Margrie, T. and Schaefer, A. (2003). Theta oscillation coupled spike latencies yield computational vigour in a mammalian sensory system. Journal of Physiol., 546:363–374. Meister, M. and Bonhoeffer, T. (2001). Tuning and toppography in an odor map on the rat olfactory bulb. The journal of neuroscience, 21:1351–11360. Ng, M., Roorda, R., Lima, S., Zemelman, B., Morcillo, P., and Miesenbock, G. (2002). Transmission of olfactory information between three populations of neurons in the antennal lobe of the fly. Neuron, 36:463–474. O’Keefe, J. (1993). Phase relationship between hippocampal place units and the eeg theta rythm. Hippocampus, 3:317–330.
27
Papoulis, A. (1984). Probability, random variables, and stochastic processes, second edition. McGraw-Hill Book Co., New York. Perez-Orive, J. (2004). Neural oscillations and the decoding of sensory information. PhD thesis, California Institute of Technology. Perez-Orive, J., Mazor, ., Turner, G., Cassenaer, S., Wilson, R., and Laurent, G. (2002). Oscillations and sparsening of odor representations in the mushroom bodies. Science, 297:359–365. Quenet, B. and Horn, D. (2003). The dynamic neural filter: a binary model of spatiotemporal coding. Neural Computation, 15:309–329. Sachse, S. and Galizia, C. (2003). The coding of odour-intensity in the honeybee antennal lobe: local computation optimizes odour representation. European journal of neuroscience, 18:2119–2132. Stopfer, M., Bhagavan, S., Smith, B., and Laurent, G. (1997). Impaired odor discrimination on desynchronisation of odor-encoding neural assemblies. Nature, 390:70–74. Stopfer, M., Jayaraman, V., and Laurent, G. (2003). Intensity versus identity coding in the olfactory system. Neuron, 39:991–1004. Su, H. and O’Dowd, D. (2003). Fast synaptic currents in drosophila mushroom body kenyon cells are mediated by α-bungarotoxin-sensitive nicotinic acetylcholine receptors and picrotoxin-sensitive gaba receptors. The Journal of Neuroscience, 23:9246–9253.
28
Wachowiak, M. and Cohen, L. (2001). Representation of odorants by receptor neuron input in the mouse olfactory bulb. Neuron, 32:723–735. Wang, J., Wong, A., Flores, J., Vosshall, L., and Axel, R. (2003). Two-photon calcium imaging reveals an odor-evoked map of activity in the fly brain. Cell, 112:271–282. Wang, X.-J. (2003). Neural oscillations. pages 272–280. Wang, X.-J. and Buzsaki, G. (1996). Gamma oscillation by synaptic inhibition in a hippocampal interneuronal network model. The journal of neuroscience, 16:6402–6413. Wehr, M. and Laurent, G. (1996). Odour encoding by temporal sequences of firing in oscillating neural assemblies. Nature, 384:162–166. Whittington, M., Traub, R., Kopell, N., Ermentrout, B., and Buhl, E. (2000). Inhibitionbased rhytms: experimental and mathematical observations on network dynamics. Int. J. of Psychophysiol., 38:315–336.
29
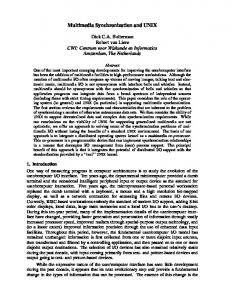
Fig. 1: Panel A: The insect AL as an excitatory-inhibitory network. Local neurons (LNs) are inhibitory cells (I-cells) and Projection neurons are excitatory cells (Ecells). Although connections between PNs may be present in the locust, they do not seem to play a significant role on PN phase-locking (Bazhenov et al., 2001b) and for simplicity are not considered in our AL model. Panel B: PN phase-locking. The LFP is recorded in the Mushroom Body, a higher structure where the PNs project. The oscillations of the LFP define a ’clock’ of a 50 ms period corresponding to 20 Hz oscillations for the locust AL. Ticks depict individual PN spikes. Phase-locked PNs fire in the ascending phase of the mushroom body LFP with a consistent phase lag of -70◦ (Laurent and Davidowitz, 1994) corresponding to a mean firing time T of the PN population occurring approximately 10 ms before the peak of the LFP. This phase lag is probably due to the conduction time between the AL and the Mushroom Body, see chapter 4 in (Perez-Orive, 2004). We consider that phase-locked PNs are those which fire within a temporal windows of ±² ms around the PN mean firing time T , typically ²=5 ms (Laurent, 1999; Laurent et al., 2001). If one assigns bit 1 or 0 to phase-locked or non phase-locked PNs (see e.g. Laurent, 1996) then the population vectors formed by PN#1 and 2 and the three oscillatory cycles is (10, 01, 11).
30
Fig. 2: Simulations of our AL model (30 LNs and 90 PNs). Panel A corresponds to the simulation of an intact network. Subplot (i) represents the time evolution of the LFP (the LFP is taken as the average of the PNs’ variables θ). Subplot (j) is the raster plot of the PN spikes (the size of a dot is proportional to the number of LN-evoked IPSPs received by the PN at the previous oscillatory cycle). Subplot (k) is the raster plot of the LN spikes. Panel B corresponds to the simulation of a network with weak inhibitory LN-PN synapses. Panel C corresponds to the simulation of a network without LN firing rate adaptation.
31
Fig. 3: Temporal analysis of PN#1 over 20 simulations of the 90-30 network with different initial conditions θ(t = 0) and different input currents due to the noise. For repeated trials, the stimulus was applied to the same 33% ”random set” of neurons. Each column corresponds to a given oscillatory cycle (from 1 to 10). The first row at the top shows the phase of each PN spike relative to its closest peak of the LFP (the phase of a given spike relative to the ith peak of the LFP is plotted as a dot in the ith box). The 2nd row shows the inhibitory drive, i.e. the mean number of LN-evoked IPSPs received by PN#1 at the previous oscillatory cycle. The 3rd row shows the standard deviation of the temporal jitter (in ms) of these LN-evoked IPSPs. Inhibitory drive and temporal jitter are estimated as averages over the 20 runs. The 4th row at the bottom represents the binary code obtained by assigning +1 at the ith bit if at least 80% of the spikes belonging to the ith box is within a ±5 ms windows around the ensemble mean of the PN population.
32
Fig. 4: Network without LN firing rate adaptation. When LN frequency adaptation is blocked, the subset of phase-locked PNs becomes time invariant, a PN being either synchronized or desynchronized at all oscillatory cycles. The first two rows at the top are for a phase-locked PN. The last two rows at the bottom are for a desynchronized PN. Each box corresponds to an oscillatory cycle (from 1 to 10). The phase of each spike is represented as a dot across repeated trials. The inhibitory drive is the mean number of IPSPs received by the neuron at the previous oscillatory cycle estimated as the average over 20 trials.
33
Fig. 5: Phase-locking probability vs. deviation from mean inhibition. In case of precise inhibition (σLN = 0) the phase-locking probability given by eqs. (9) and (10) is an asymmetric bell-shaped function centered on the mean inhibitory drive received by the PNs at the previous oscillatory cycle. We consider that a PN is phase-locked if this probability is higher than 0.3 (Wehr and Laurent, 1996) which gives a synchronization range of k ∈ (0.66 , 1.52 ).
34
Fig. 6: Panel A: Lower bound vs. estimated phase-locking probability. The plain curve represents the phase-locking probability estimated by simulation over 20 runs (refer to PN#1 in Fig. 3). The dotted curve represents the lower bound computed by using Eq. (9) and (10). Panel B: Temporal jitter. Standard deviation σP N of the firing times for the PN population vs. standard deviation σLN of the firing times for the LN population. Curves represent the σP N computed using eq. (11) and (10) and appendix A2. The mean a with p being the probability of connection inhibitory drive is given by < k >= p NLN a being the number of active LNs. Points represent experimental values for σP N and NLN
estimated as average over 20 runs with standard deviation. Circles, squares, diamonds and cross marks are for = 2, 3, 4 and 5, respectively. The value indicated by a star was derived from (Laurent and Davidowitz, 1994) (see text). The identity line is represented in the graph.
35
Fig.
7: Effects of odor concentration on the LFP. The percentage of neurons
activated by the stimulus reflects the odor concentration (model assumption in appendix A1). Panel A. LFP frequency vs. odor concentration for different decay rates of the inhibitory LN-PN synapse. The LFP frequency is given by the frequency of the maximum Fourier component in the power spectrum computed on the unfiltered signal. Panel B. Signal to Noise Ratio (SNR) vs odor concentration. The SNR is defined as the ratio of the sum of the powers of the fundamental and all harmonic frequencies to the total power. The fundamental frequency of the signal is given by the frequency of the maximum Fourier component in the LFP power spectrum. When the SNR is one the signal is considered as a pure oscillatory signal.
36
Fig. 8: Panel A. External input. Time evolution of I ext applied to PN #1. I ext = 0.75 with added gaussian noise (0.1 standard deviation) of 600 ms duration. Stimulus onset is th necessary for randomly taken between 0 and 30 ms. The minimal currents IPthN and ILN
repetitive firing of PNs or LNs are indicated by the dashed lines. Panel B. Firing rate vs. applied current for a PN (left) and a LN (right). Circles are for the simulations of the conductance based models from (Bazhenov et al., 2001b) and plain curves are for the simulations of the corresponding fitted theta models. As expected, theta neurons are good approximation of type I conductance based models around the threshold (Ermentrout, 1996; Hoppenstead and Izhikevich, 2002) and firing rate adaptation linearizes the LN frequency response (Ermentrout, 1998). Panel C. Responses of PN and LN to current pulses of different amplitude. From top to bottom, I ext = 0.55, 0.53, 0.85, 0.82 and 0.82. Bottom trace was obtained by introducing an additional parameter β in Eq. (1). The result is a more realistic shape for the LN Ca2+ spikes, similar to the one in (Bazhenov et al., 2001b). Panel D. Lateral LN-LN inhibition leads to synchronized LN activities even in presence of desynchronized PNs. Raster plots of LN spikes corresponding to the simulation of Fig. 2B with LN-LN inhibition (bottom) and without LN-LN inhibition (top).
37
A
B T LNs
2T
3T
LFP
(I−cells)
PN#1 Iext PNs (E−cells)
Output PN#2
T −ε
T+ε
Figure 1: D. Martinez / NC ms 3104
38
Time
A
LFP
0
(i) −1 0
100
200
300
400
500
600
100
200
300
400
500
600
100
200
300
400
500
600
PN
80 60 40 20 0
0
(j)
LN
30 20 10 0
0
(k) Time (ms)
C
LN
LN
PN
PN
LFP
LFP
B
Time (ms)
Time (ms)
Figure 2: D. Martinez / NC ms 3104
39
10
inhibitory drive
trial number
20
0
−π +π
4 2
Jitter (ms)
0 8 4 0
0
1
1
1
0
0
0
0
Figure 3: D. Martinez / NC ms 3104
40
0
1
trial number inhibitory drive trial number inhibitory drive
10
−π +π
0 4 2 0
10
−π +π
0 4 2 0
Figure 4: D. Martinez / NC ms 3104
41
0.3
Phase−locking probability
1
0
1.52
0.66 1
2
k / Figure 5: D. Martinez / NC ms 3104
42
A 3
Probability and lower bound
2
1
0
−1
−2
−3 2
3
4
5
6
7
8
9
10
LFP oscillatory cycle
B
σ
PN
(ms)
8
= 2
7
3
6
4 5
5 4 3 2 1 0
0
1
2
3
σ
4
LN
5
6
7
8
(ms)
Figure 6: D. Martinez / NC ms 3104
43
LFP frequency (in Hz)
A 30
B
25
20
15
10 30
40
50
60
70
80
90
100
Number of activated neurons (in %) 1
0.8
SNR
τ=10ms τ=6ms τ=4ms
0.6 0.4
τ = 4 ms τ = 6 ms τ = 10 ms
0.2 0 10
20
30
40
50
60
70
80
Number of activated neurons (in %)
Figure 7: D. Martinez / NC ms 3104
44
90
100
A
B
Input current PN#1
1 Ith LN
16
PN
LN
(without firing adaptation)
12
LN
F(Hz)
Ith PN
(with firing adaptation)
4 Ith PN 0 0
Time (ms)
0 0.5
600
C
0.6
Ith LN Input current
D
PN
LN
PN
LN
LN
LN 2π 0
100 ms
100
Time (ms)
Figure 8: D. Martinez / NC ms 3104
45
0.9
1