Hyeun Cho b. ; Yon Kyu Choi b a. Department of Environmental Engineering, Yonsei University at Wonju. Wonju. Korea b. Waterworks Research Institute. 130-1 ...
This article was downloaded by:[2007 Yonsei University Central Library] [2007 Yonsei University Central Library] On: 8 March 2007 Access Details: [subscription number 769136881] Publisher: Taylor & Francis Informa Ltd Registered in England and Wales Registered Number: 1072954 Registered office: Mortimer House, 37-41 Mortimer Street, London W1T 3JH, UK
Ozone: Science & Engineering The Journal of the International Ozone Association
Publication details, including instructions for authors and subscription information: http://www.informaworld.com/smpp/title~content=t713610645
Effect of Ozone and GAC Process for the Treatment of Micropollutants and DBPs Control in Drinking Water: Pilot Scale Evaluation a
a
a
b
Kyoung Suk Kim ; Byung Soo Oh ; Joon Wun Kang ; Deuk Mo Chung ; Woo b b Hyeun Cho ; Yon Kyu Choi a Department of Environmental Engineering, Yonsei University at Wonju. Wonju. Korea b Waterworks Research Institute. 130-1 Kuui-2Dong, Seoul. Korea To link to this article: DOI: 10.1080/01919510590909066 URL: http://dx.doi.org/10.1080/01919510590909066 Full terms and conditions of use: http://www.informaworld.com/terms-and-conditions-of-access.pdf This article maybe used for research, teaching and private study purposes. Any substantial or systematic reproduction, re-distribution, re-selling, loan or sub-licensing, systematic supply or distribution in any form to anyone is expressly forbidden. The publisher does not give any warranty express or implied or make any representation that the contents will be complete or accurate or up to date. The accuracy of any instructions, formulae and drug doses should be independently verified with primary sources. The publisher shall not be liable for any loss, actions, claims, proceedings, demand or costs or damages whatsoever or howsoever caused arising directly or indirectly in connection with or arising out of the use of this material. © Taylor and Francis 2007
Downloaded By: [2007 Yonsei University Central Library] At: 09:22 8 March 2007
Ozone: Science and Engineering, 27: 69–79 ISSN: 0191-9512 print / 1547–6545 online Copyright # 2005 International Ozone Association DOI: 10.1080/01919510590909066
Effect of Ozone and GAC Process for the Treatment of Micropollutants and DBPs Control in Drinking Water: Pilot Scale Evaluation Kyoung Suk Kim,1 Byung Soo Oh,1 Joon Wun Kang,1 Deuk Mo Chung,2 Woo Hyeun Cho,2 and Yon Kyu Choi2 1 2
Department of Environmental Engineering, Yonsei University at Wonju, Wonju, Korea Waterworks Research Institute, 130-1 Kuui-2Dong, Seoul, Korea
To improve the quality of water supplied to the City of Seoul in Korea, a pilot-scale evaluation of how the conventional treatment process could be upgraded was conducted. Three candidate processes were evaluated and compared: a conventional process (consisting of coagulation, sedimentation, and rapid sand filtration) plus GAC (Train A); a conventional process plus ozone and GAC (Train B); and a process consisting of coagulation, sedimentation, intermediate ozone, sand filtration, and GAC (Train C). Treatment efficiency of the unit process and overall treatment trains were evaluated using several parameters such as turbidity, dissolved organic carbon (DOC), UV absorbance at 254 nm (UV254), specific ultraviolet absorbance (SUVA), micropollutants (pesticides, benzenes, and phenols), disinfection by-products (trihalomethanes (THMs), haloacetic acids (HAAs) and aldehydes), and total organic halogen (TOX). Results showed that ozone and/or GAC was effective for removing micropollutants and controlling chlorinated by-products such as THMs and HAAs. However, any synergistic effect of ozonation (adsorption and biodegradation) on GAC was observed due to the low concentration of aldehydes in raw and process water. Keywords
Ozone, GAC, Disinfection By-Products, Micropollutants, Seoul Waterworks
INTRODUCTION Advanced drinking water treatment system integrated with ozone and/or granular activated carbon (GAC) has been widely used in drinking water treatment utilities in Korea, accounting for about 20% of the entire public water supply. However, this advanced treatment process Address correspondence to Joon Wun Kang, Yonsei University at Wonju, 234 Maeji, Wonju, 220-710, Korea. E-mail: jwkang@ dragon.yonsei.ac.kr
has not yet been adopted in the drinking water treatment plants located at the area under the control of Seoul Metropolitan Government in Korea. Recently, the Waterworks Research Institute has been developing reliable treatment technology to upgrade the quality of tap water by removing trace organic pollutants, minimizing the formation of disinfection by-products (DBPs) and inactivating microorganisms. The main regulations for pesticides in Korean drinking water include five kinds; cabaryl, diazinon, fenitrothion, malathion, and parathion, which come under the regulation for drinking water quality, and limit their concentrations to 70, 20, 40, 250, and 60 mg/L, respectively. As well as pesticides, other trace organic compounds are also regulated in Korea, for example benzene and phenol, at 5 and 10 mg/L, respectively. Therefore, an analytical technique, capable of the simultaneous determination of a large number of chemicals, is needed to evaluate the removal of micropollutants from drinking waters (Kadokami et al., 1995). In this research, the evaluation of the candidate process trains was performed by detecting diverse micropollutants. In the numerous countries, including Korea, chlorination of drinking water has been the most widely used method, since the 19th century, of disinfection for the inactivation of pathogenic organisms. However, chlorinated by-products such as trihalomethanes (THMs) and haloacetic acids (HAAs) pose human health risk and have become a matter of great concern (Bryant et al., 1992; Sylina et al., 2000). These by-products, which are potential carcinogens, are regulated by the U.S. Environmental Protection Agency (USEPA) under the Disinfectants/ DBP rule (D/DBPR) (Pontius, 1999). In Korea, the total THMs and HAAs concentrations in drinking
Ozone: Science and Engineering
February 2005
69
Downloaded By: [2007 Yonsei University Central Library] At: 09:22 8 March 2007
water have been regulated since 1990 and 2003, respectively, both at the level of 100 mg/L. Recently, a number of drinking water utilities have switched from using chlorine to alternative disinfectants such as ozone, chlorine dioxide, and chloramines to comply with regulations (Federal Register, 1979, 1998). The objective was to control THMs and HAAs, but the alternative disinfectants produced other disinfection by-products. This study is designed to investigate any enhanced performance of ozone and GAC in overall treatment trains to reduce DBPs and precursors of DBPs. It also hopes to enable research to improve tap water quality and to meet the forthcoming stringent drinking water standard with the following specific objectives: (1) to measure toxic micropollutants present in raw water source from Han-river, and to compare the removal efficiency of the candidate process trains; (2) to determine the optimal point of ozone application (intermediate-, or post-ozonation) for reduction of DBP precursors such as trihalomethanes formation potential (THMFP), haloacetic acids formation potential (HAAFP), and total organic halogen formation potential (TOXFP); and (3) to identify and
RW
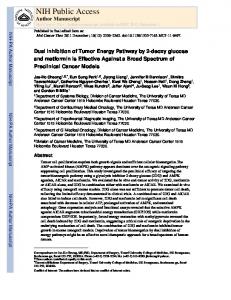
quantify organic by-products produced from oxidation, and their control by GAC. MATERIALS AND METHODS Pilot Plant Process Pilot-scale experiments were conducted using Han-river as water source. The pilot plant (capacity: 30 m3/day) was installed at the Waterworks Research Institute. The pilot system was designed to test various process schemes consisting of a series of processes such as coagulation/sedimentation (coag./sed.), sand-filtration (SF), ozone, and GAC adsorption. The scheme shown in Figure 1 shows the candidate process-trains to be evaluated for the most suitable treatment process. Train A was comprised of a typical conventional scheme (coagulation, sedimentation, and filtration) plus GAC adsorption. Trains B and C included a process of ozonation prior to and post the sand filtration process. The purpose was to evaluate the effectiveness of the ozone process in the existing conventional treatment system and/or the most appropriate point of ozone application for selection of the most suitable treatment process.
Sed
Coag
(a) SF
GAC
O3 O3
SF
GAC
GAC (c)
(b)
(a) Conventional + GAC Process (Train A) (b) Intermediate Ozonation (Train B) (c) Post-Ozonation (Train C) FIGURE 1 Schematic diagram of the pilot system (capacity: 30 m3/day). (RW: raw water, Coag: coagulation, Sed: sediment, SF: sand filtration, GAC: granular activated carbon, O3: ozonation).
70
Ozone: Science and Engineering
February 2005
Downloaded By: [2007 Yonsei University Central Library] At: 09:22 8 March 2007
TABLE 1. Operational Conditions and Specification for Each Unit Process
Process Coagulation (x2) Sediment (x2) Sand-Filtration (x2) Ozone Intermediate Post GAC
Operation Factors Alum dose 2mg/L as Al3+
Capacity 0.52 m3 Capacity 3.77 m3
Contact time 172 min
Filtration rate 120 m/day Applied ozone dose (Dissolved ozone residual) 2 mg/L (0.2�mg/L) 1 mg/L (0.3�0.5 mg/L) GAC Bed size 2.5 m
The operating conditions and specifications of each process are shown in Table 1. Water Characteristics The influent raw water to the pilot plant was supplied from upstream Han-river after chlorination at the water intake. Typical water quality characteristics of raw water during the test period (August 2001–August 2002) were: (1) the pre-chlorinated raw water (chlorine dose 5�10 mg/L), contained chlorinated by-products such as THMs (10�18 mg/L) and HAAs (28�36 mg/L); (2) the pH was neutral (6.9 ± 0.3); (3) the temperature ranged from 1.2 to 25 �C, depending on the season; (4) the UV absorbance at 254 nm (UV254) measured using a 1-cm quartz cell was 0.028�0.042 cm-1; (5) the dissolved organic carbon (DOC) content (1.2�2.9 mg/L); (6) and specific ultraviolet absorbance (SUVA) values (2.2�2.4 L/mg-m) were relatively low. Raw water was pre-chlorinated to control the algae growth causing the taste and odor, which are gradually increased during a period of water shortage. Analytical Methods Water samples were collected from various locations for analysis of DOC, UV254, THMs, THMFP, HAAs, HAAFP, total organic halogen (TOX), TOXFP, and micropollutants. For THMs and HAAs, four kinds of THMs (chloroform, bromodichloromethane, dibromochloromethane, and bromoform), and six kinds of HAAs (monochloroacetic acid, dichloroacetic acid, trichloroacetic acid, bromochloroacetic acid, monobromoacetic acid, and dibromoacteic acid)were analyzed. The pH was measured with a pH meter (Model 420A, Orion, Thermo Electron Corp. San Jose, CA, USA). DOC was measured with TOC analyzer (Dohrmann DC-180, Tekmar-Dohrmann, Mason, OH, USA) after the sample was filtered through a 0.45-mm cellulose nitrate membrane filter (Whatman Inc., Clifton, NJ, USA). UV absorbance
Contact time 24 min
Column height 1m
Column I.D 300 mm
Contact time
Column height
Column I.D
8 min 8 min
4.6 m 4.6 m EBCT 15 min
100 mm 100 mm Column I.D 150 mm
was measured with UV/VIS spectrophotometer (Varian Cary 3C, Varian Inc., Palo Alto, CA, USA) in a 1-cm quartz cell. SUVA is the ratio of UV254 to the concentration of DOC in the water, i.e., UV254(cm-1)/DOC(mg/L)·100. DBPs Measurements DBPFP, including THMs and HAAs formation potential, was measured after a 24-h incubation period at room temperature (23±2 �C) and addition of approximately 4% sodium hypochlorite solution (NaOCl; Aldrich) to the water sample (chlorine dose: 10 mg/L). Then, ammonium chloride (NH4Cl) was added to quench residual chlorine for analysis of THMs and HAAs. These analytical methods were based on EPA Methods 501 and 552.2 (US EPA, 1992, 1995), with slight modification. THM concentrations were analyzed using purge and trap system (LSC-2000, Takmar) on a Varian 3600CX gas chromatography equipped with an RTX-5 column (30 m · 0.32 mm · 0.25 mm) with ECD detection. For the analysis of HAAs, samples were extracted using MTBE extraction followed by derivatization of acidic methanol (Yuefeng, 2001). The extract was injected onto DB 1701 (30 m · 0.25 mm · 0.25 mm) column of GC (Varian 3600 CX) with ECD detection. TOXFP concentrations were measured after the identical incubation conditions with THMFP and HAAFP using a TOX analyzer (Dohrmann DX-2000). Aldehydes were analyzed based on the method described by Glaze et al. (1989). A 5-mL water sample was used for the derivatization by adding 0.5 mL PFBOA-HCl (o-(2,3,4,5,6-pentafluorobenzyl)-hydroxylamine hydrochloride) solution. After the derivatization and heating for 2 h, the samples were extracted with n-hexane and injected into GC/ECD (Varian 3600 CX). Micropollutants To investigate the removal efficiency of micropollutants from the tested processes, an analytical method for
Ozone: Science and Engineering
February 2005
71
1.2
3.0 Turbidity (NTU) DOC UV254
1.0
2.0
0.6
1.5
0.4
1.0
0.2
0.5
0.0
SUVA (L/mg-m)
C/Co
0.8
0.0 RW
Co ag/Sed
SF
GAC
(a) Train A 3.0
1.2 Turbidity (NTU) DOC UV254
1.0
2.5
0.8
2.0
0.6
1.5
0.4
1.0
0.2
0.5
SUVA (L/mg-m)
C/Co
SUVA
0.0
0.0 RW
Coag/Sed
RESULTS AND DISCUSSION
Ozone(I)
SF
GAC
(b) Train B 3.0
1.2 Turbidity (NTU) DO C UV254
1.0
2.5
SUVA
0.8
2.0
0.6
1.5
0.4
1.0
0.2
0.5
SUVA (L/mg-m)
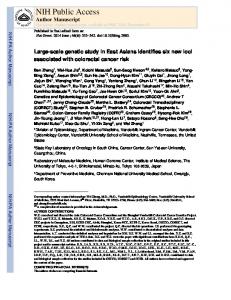
Effect of Ozone on DOC and UV254 Removal Figure 2 compares the treatment efficiency of the three candidates of treatment trains consisting of conventional unit processes and GAC and/or ozone. Turbidity, DOC, UV254, and SUVA were measured for the comparison. From the fractional removal values of C/Co before and after SF shown in Figure 2(a), it could be seen that SF alone would hardly remove DOC and UV254,but with GAC process, higher removal rates of DOC and UV254 could be achieved. From Figures 2(b) and 2(c) UV254 was found to be substantially reduced by ozonation using small ozone dose (1�2 mg/L). However, DOC was hardly removed with ozonation. Comparing the overall efficiency of the three treatment trains using these water quality parameters, train A (conventional process + GAC) achieved almost the same performance with trains B and C, in which both ozone and GAC were used. SUVA values can provide insights into the characteristics of natural water such as aromatic contents per unit concentration of organic carbon, hydrophobicity, and molecular weight distribution of DOC (Karanfil et al., 2002). SUVA can be effectively used to evaluate the treatment efficiency of unit process. In this research, the water tested had a relatively low SUVA value (2.2�2.4 L/mg-m), indicating that the water contained hydrophilic, and low-molecular-weight materials. Figure 2 shows that SUVA was decreased by 20% only after coag./sed. This result is in accordance with White et al (1997), whose research reported that the removal of DOC with low SUVA (�3 L/mg-m) was typically less 72
2.5
SUVA
C/Co
Downloaded By: [2007 Yonsei University Central Library] At: 09:22 8 March 2007
simultaneous detection of 300 chemicals in water at ppt level was used (Kadokami et al., 1993, 1995). This method, developed by Kadokami et al. has been successfully tested for evaluation of several pilot-scale studies (Kang et al., 1997). With a single injection of extract on GC/MS, this method can identify and quantify several micropollutants at trace levels including pesticides, phenols, benzenes, and aliphatic compounds. After pH adjustment to 7 using phosphate buffer, 500-mL water sample was extracted with 40 mL of dichloromethane. After the second extraction of the water sample, the extracts were combined and dehydrated with anhydrous sodium sulfate and concentrated to a few mL with a Kuderna-Danish (KD) concentrator and Snyder column. Hexane (0.7 mL) was added to the concentrate and was re-concentrated to 1 mL. Prior to injection volume of 1 mL in a DB-5MS column (30 m · 0.25 mm, J&W Scientific), mixed internal standard solution (4-chlorotoluene-d4, naphthalene-d8, biphenyl-d10, phenanthrene-d10, and perylene-d12) was added to the concentrate for quantitative analysis by GC-Ion trap MS (Varian GC 3400, Saturn 2000 MS). The oven temperature was set at 508C isothermal for 2 minutes, elevated to 3008C at 88C/min, and held at 3008C for 8 min.
0.0
0.0 RW
Coag/Sed
SF
Ozone(P)
GAC
(c) Train C FIGURE 2 Comparison of the three treatment lines for removal of turbidity, DOC, UV254, and SUVA. [Turbidity]o = 8.3�12.7 NTU, [DOC]o = 1.2�2.9 mg/L, [UV254]o = 0.028�0.042 cm-1, [SUVA]o = 2.2�2.4 L/mg-m.
than 30% by coag./sed. In train C, the ozone process largely decreased the SUVA value; SUVA decreased by 30% with only 1 mg/L ozone dose. This means that the process could alter hydrophobic to hydrophilic and high-molecularweight to low-molecular-weight organic matter (Karanfil et al., 2002). Removal Efficiency of Micropollutants To investigate and compare the removal efficiency of micropollutants for the three treatment trains, the raw
Ozone: Science and Engineering
February 2005
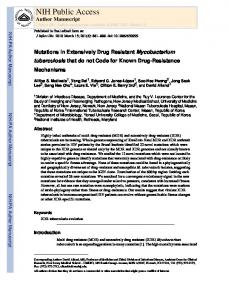
Removal Efficiency of THMs, HAAs, and Their Precursors Several researchers have shown that ozonation and GAC adsorption can reduce the precursors of chlorinated by-products (Ching et al., 2002; Glaze et al., 1982; Owen et al., 1998). This study examined the effect of ozone and GAC on the destruction of THMs, HAAs, and their precursors. The removal trends of THMs, HAAs, and their precursors along the treatment trains are shown in Figure 4. Since the influent water supplied to the pilot plant had been pre-chlorinated (chlorine dose: 5�10 mg/L) at the water intake and contacted along the transmitting pipeline for 5 h, the influent water already contained pre-formed THMs (about 10�15 mg/L) and HAAs (about 20�35 mg/L). It is interesting to note that the level of THMs increased along the three treatment trains after coag./sed., and even
B enzenes P h e n o ls P e s tic id e s
1 .4 1 .2
C/Co
1 .0 0 .8 0 .6 0 .4 0 .2 0 .0 RW
Coag/Sed
SF
GAC
(a) Train A B enzenes P h e n o ls P e s tic id e s
1 .4 1 .2
C/Co
1 .0 0 .8 0 .6 0 .4 0 .2 0 .0
RW
Coag/Sed
Ozone(I)
SF
GAC
(b) Train B B enzenes P h e n o ls P e s tic id e s
1 .4 1 .2 1 .0 C/Co
Downloaded By: [2007 Yonsei University Central Library] At: 09:22 8 March 2007
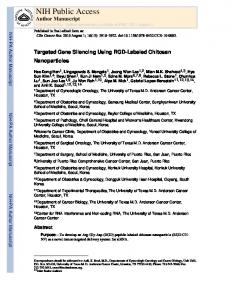
and treated water samples taken at each sampling point were concentrated and analyzed GC/MS according to the method developed by Kadokami et al. (1995). With a single injection on GC/MS, this method can simultaneously identify and quantify over 300 kinds of micropollutants most frequently found in rivers and treated water. From the raw water (pre-chlorinated water) and treated process water, six kinds of pesticides (fenobcarb, isoprothiolane, diazinon, fenitrothion, iprobenfos, flutolanil), and five kinds of phenolic compounds (phenol, 2,4-dimethylphenol, pentachlorophenol, 4-methyl-2,6-di-tbutylphenol, 2,6-di-t-butyl-4-ethylphenol), and six kinds of benzenes (pentamethylbenzene, pentachlorobenzene, styrene, 1,2-dichlorobenzene, 1,3,5-trichlorobenzene, hexachloropropylene) were detected at low concentration level (ppt level). Instead of using individual compound, the sum of each compound in classified groups was considered for the process evaluation. The sum of pesticides, phenols, and benzenes were approximately 2.2, 0.4, and 0.5 mg/L, respectively. Figure 3 shows the removal trend of micropollutants for each unit process along the treatment trains. The figure also compares the overall removal efficiency of the three proposed trains. It is evident that the coag./ sed. and SF alone were ineffective to remove pesticides, phenols, and benzenes, but these constituents could be completely removed either by ozonation and/or GAC. This result also demonstrated that choice of a single unit process, ozone or GAC, was enough to remove micropollutants, but not necessarily to use both units in series. However, it should be noted that almost all reactions between ozone and organic compounds may cause the partial destruction, producing a variety of ozone byproducts. Likewise, several reports have demonstrated that ozonation of phenol and pesticides would also form diverse by-products, occasionally resulting in compounds that are more toxic (Gould and Wever, 1976; Reynolds et al., 1989). Therefore, the series type ozone and GAC units could be considered for both removing the micropollutants and eliminating the ozone by-products.
0 .8 0 .6 0 .4 0 .2 0 .0 RW
Coag/Sed
SF
Ozone(P)
GAC
(c) Train C FIGURE 3 Comparison of micropollutants removal efficiency for the treatment trains. [pesticides]o= 2.2 mg/L, [phenols]o =0.4 mg/L, [benzenes]o= 0.5 mg/L. Ozone dose in Train B = 2.0 mg/L, Train C = 1.0 mg/L.
after intermediate-ozone unit. This is because THM formation reaction had not yet been terminated within the 5-h reaction time but was still progressing along the process lines. It seems that the rate of THMs removal might be smaller than that of formation under this operational condition. On the other hand, an increasing pattern of HAAs was not observed. However, HAAs present in the water passing through the ozone unit were hardly removed by ozonation. This could have been the result of ozone having a very low reactivity toward singly bonded compounds and aromatics substituted with electron-withdrawing groups (-COOH, -NO2) (Bruno et al., 1991; Rice, 1987– 1988). As Figure 4 indicates, ozone might effectively remove HAA and THM precursors in both processes, Train B and Train C.
Ozone: Science and Engineering
February 2005
73
Downloaded By: [2007 Yonsei University Central Library] At: 09:22 8 March 2007
µg/L
µg/L
80
80
70
HAA HAAFP
60
70
THM THMFP
60
50
50
40
40
30
30
20
20
10
10 0
0 RW
Coag/Sed
SF
RW
GAC
Coag/Sed
SF
GAC
(a) Train A 80
80
70
70 HAA HAAFP
60 50
50
40
40
30
30
20
20
10
10
0 RW
Coag/Sed Ozone(I)
SF
THM THMFP
60
GAC
0 RW
Coag/SedOzone(I)
SF
GAC
(b) Train B 80
80
70
HAA HAAFP
60
THM THMFP
70 60
50
50
40
40
30
30
20
20
10
10 0
0 RW
Coag/Sed
SF
Ozone(P)
RW
GAC
Coag/Sed
SF
Ozone(P)
GAC
(c) Train C FIGURE 4 Comparison of HAAs, THMs, and their precursors removal for the treatment trains. Applied ozone dose in Train B = 2.0 mg/L, Train C = 1.0 mg/L.
74
Ozone: Science and Engineering
February 2005
Downloaded By: [2007 Yonsei University Central Library] At: 09:22 8 March 2007
For detailed investigation of the ozone effect on their precursor removal, the concentrations of net precursors determined by subtracting the pre-formed THMs or HAAs from their precursors were plotted in Figure 5. The results showed that ozone could effectively remove precursors regardless of point of ozone application even with a small ozone dosage (1�2 mg/L). From the results shown in Figures 4 and 5, ozone should be applied prior to the chlorine application for DBP control since ozone is no longer effective in removing THMs and HAAs once they have pre-formed. The applicable position of the ozone process, to mainly consider for the control of the chlorinated by-products, should be determined depending on the characteristics of targeted raw water, especially those of chemicals (Bryant et al., 1992).
In the case where the raw water contains high amounts of ammonia nitrogen or algae, as with the water used in this study, pre-chlorination is a necessary requirement. It would therefore be suitable to apply an intermediateozonation process such as the Train B. On the other hand, if a significantly high level of chlorinated by-product formation potential is observed in the raw water, the replace of the pre-chlorination with the ozone process is strongly recommended, as both an alternative disinfectant and eliminator for precursors of chlorinated by-products. For suitable control of DBP and DBP precursors in treatment process, UV254 and DOC parameters were proposed to use and those values were overlaid with the plot of DBP precursors in Figure 5. The removal pattern of UV254 along the treatment train followed the same
µg/L
C/Co 1.2
30 HAAFP-HAA THMFP-THM UV254 DOC
25
1.0
20
0.8
15
0.6
10
0.4
5
0.2 0.0
0 RW
Coag/Sed
SF
GAC
(a) Train A µg/L
µg/L
C/Co
35 HAAFP-HAA THMFP-THM UV254 DOC
30 25
1.2
35
1.0
30
0.8
C/Co 1.2 HAAFP-HAA THMFP-THM UV254 DOC
25
1.0 0.8
20
20
0.6
0.6 15
15 0.4
10 5 0 RW Coag/Sed Ozone(I)
SF
0.4
10
0.2
5
0.0
0
GAC
(b) Train B
0.2 0.0 RW Coag/Sed SF
Ozone(P) GAC
(c) Train C
FIGURE 5 Comparison of net-precursors (HAAFP-HAAs and THMFP-THMs) removal for the treatment trains. Ozone dose in Train B = 2.0 mg/L, Train C = 1.0 mg/L.
Ozone: Science and Engineering
February 2005
75
Downloaded By: [2007 Yonsei University Central Library] At: 09:22 8 March 2007
removal trend of precursor removal, but not the DOC profiles showing deviation. This result indicated that UV254 parameter could be effectively used as an indirect monitoring tool for DBP control. The removal efficiency of UV254 and DOC during ozonation is in accordance with previous researches (Chang and Singer, 1991; Singer and Chang, 1989). The reference results and the data in this study indicate that ozonation does not lead to complete mineralization of the organic compounds present in natural water but rather to the transformation of high-molecularweight organic compounds into smaller-molecular-weight organic compounds. The detailed relationship between DBP precursors (HAAFP, THMFP, and TOXFP) and parameters (DOC and UV254) are discussed later in this paper. TOX represents the concentration of total organic halogens in the water sample. The analysis of organic halides as a group parameter can be used as a collective
parameter and as a surrogate for potentially harmful halogenated organic substances in drinking water (Pourmoghaddas and Stevens, 1995). In Figure 6, TOX and TOXFP were compared with the sum of HAAFP and THMFP (DBPFP) along the treatment trains. The concentration of TOX and TOXFP in the pre-chlorinated raw water were 107�194 and 164�249 mg/L, respectively. The fractions of DBPFP at influent raw water were no more than 60% of the TOXFP, which means that several other halogenated by-products could be present after water chlorination. It was noted that in Trains B and C, the ozone processes showed 3% and 10% removal efficiencies for TOXFP, while DBPFP was removed up to 30% and 33% after ozonation; the ratios of the DBPFP to TOXFP concentrations eliminated by the ozone process were found to be 4.1 and 1.4 mg/mg in Trains B and C, respectively. The portion of DBPFP varied to a greater extent than that of the TOXFP, which was probably
µg/L 250
TOX TOXFP HAAFP+THMFP
200 150 100 50 0 RW
Coag/Sed
SF
GAC
(a) Train A 250
250 TOX TOXFP HAAFP+THMFP
200
200
150
150
100
100
50
50
0
TOX TOXFP HAAFP+THMFP
0 RW
Coag/Sed Ozone(I)
SF
GAC
(b) Train B
RW
Coag/Sed
SF
(c) Train C
FIGURE 6 Removal trend of TOX, TOXFP, and DBPFP (sum of HAAFP and THMFP).
76
Ozone: Science and Engineering
February 2005
Ozone (P) GAC
Downloaded By: [2007 Yonsei University Central Library] At: 09:22 8 March 2007
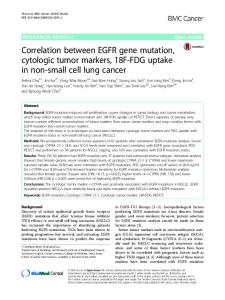
because the by-products formed from the ozonation of the DBP precursors from ozone were not totally free from the TOX precursors bondage. This result implied that ozone might only alter the characteristics of organic matter transforming DBPFP, which is readily oxidizable by ozonation, to a part of the TOX precursors, which are resistant to complete mineralization during ozonation. Relationship Between TOXFP and DBPFP, and UV254 and DOC To determine the relationship between precursors (such as HAAFP, THMFP, and TOXFP) and water quality parameters (such as UV254 and DOC), the correlation relating the precursors to UV254 and DOC were obtained, as shown in Figure 7. UV 254 could serve as a better indicator than DOC for prediction of both HAAs and THMs formation yielding greater than R2value of 0.9. HAAFP ¼ 2316:9 � ðUV254 Þ � 0:88; R2 ¼ 0:91 THMFP ¼ 3206:3 � ðUV254 Þ � 2:70; R2 ¼ 0:93 However, both UV254 and DOC parameters yielded poor correlations (R2= 0.63 and 0.55, respectively) with respect to TOXFP. These results demonstrate that only UV254 could serve as a useful guideline for controlling chlorinated by-products, but it was only limited to the prediction of HAAFP and THMFP. Aldehyde Formation After Ozonation Aldehydes are known major by-products produced after ozonation (Glaze and Weinberz, 1993; Schechter and Singer, 1995). Figure 8 shows the trend of aldehydes and TOC in Trains B and C. The TOC value is important in understanding the aldehydes results, because in general, the formation of aldehydes has a significant relationship with the ozone dose and TOC value (Glaze et al., 1989). The raw water (RW) was pre-chlorinated, which could increase the aldehyde formation by chlorine (Minear and Army, 1996), however; the effect of chlorination was not considered in Figure 8, as this study only focused on the production and reduction of aldehydes by the ozone and GAC units in Trains B and C. As shown in the result, the concentrations of the four principal aldehydes; formaldehyde, acetaldehyde, glyoxal, and methylglyoxal, in influent water were 3.5, 2.6, 1.3, and 0.2 mg/L, respectively. The total aldehydes content was only 7.6 mg/L. Even at the low aldehyde contents, the concentration of the aldehydes in raw water increased after ozonation. The total concentration of aldehydes increased from 6.2 to 12.2 mg/L in Train B and from 4.3 to 6.6 mg/L in Train C. The discrepancy in the increased aldehydes concentration could be explained by the applied ozone dose to the TOC value ratio (ozone:TOC ratio). The ozone:TOC ratio in Trains B and C was 1.3 and 0.8 mg/mg, respectively. Therefore, it was concluded that the higher
FIGURE 7 Relationship between DBPFP (HAAFP, THMFP), TOXFP, UV254,and DOC.
aldehyde formation in Train B compared to Train C was due to the higher ozone dose applied to each TOC unit concentration. This result was similar to that observed by Weinberg and Glaze, who reported that the
Ozone: Science and Engineering
February 2005
77
Downloaded By: [2007 Yonsei University Central Library] At: 09:22 8 March 2007
µg/L 7
mg/L µg/L 4 7
Formaldehyde Acetaldehyde Glyoxal Methylglyoxal TOC
6 5
mg/L 4 Formaldehyde Acetaldehyde Glyoxal Methylglyoxal TOC
6 3
4
5
3
4 2
2
3
3
2
1 2
1
1
1
0 0
0 RW Coag/Sed Ozone(I)
SF
RW Coag/Sed SF
GAC
(a) Train B
Ozone(P) GAC
(b) Train C
FIGURE 8 Aldehyde formation and reduction in Trains B and C.
TABLE 2. Variation of DOC, BDOC, and BDOC/DOC (%) Before and After GAC Unit in each Train
Before
Train A Train B Train C
After
DOC
BDOC
BDOC/DOC(%)
DOC
BDOC
BDOC/DOC(%)
0.79 0.87 1.17
0.01 0.13 0.19
1.27 14.94 16.24
0.2 0.2 0.2
0.05 0.09 0.11
25.00 45.00 55.00
total concentration of aldehydes increased with the increasing ozone:TOC ratio (Glaze et al., 1989). Of the four aldehydes, formaldehyde was the most prevalent species generated after ozonation. It should be noted that once aldehydes were formed, they persisted in the treatment line, without any significant reduction, even after the GAC process. It should be also noted that the relatively low concentration of aldehydes, both in raw water and ozonated waters might be representative of the insufficient water condition for biological growth on the GAC bed due to the lower biodegradable substrate contents in the raw and process water. This conclusion could be confirmed with the results relating to the BDOC plotted in Table 2. The percentage of the BDOC/DOC in the influent water of the GAC bed was significantly low, at 15 and 16% in Trains B and C, respectively, which rather increased after the GAC unit. If the bioactivity of the GAC had been high, the BDOC would have been dramatically decreased after the GAC bed, but no significant reduction was observed compared to the decrease in the DOC. Therefore, for the GAC unit, organic matter would mainly be removed by an adsorption process, rather than by biodegradation, on the activated carbon bed. 78
CONCLUSIONS To improve tap water quality, the proposed water treatment processes were evaluated with several parameters including general water quality, micropollutants, and DBPs. The following major conclusions were drawn from this study. � For reduction of DOC and UV254,Train A (conventional + GAC) was compatible with processes involving ozone (Train B and Train C). However, SUVA was largely decreased by ozone, altering water characteristics in favor of hydrophilic. � For removal of various micropollutants, which were persistent in conventional treatment process, choice of a single unit process, ozone or GAC, was enough to remove micropollutants, but not necessarily to use both units in series. However, the ozone and GAC unit processes could be applied in series for reducing the ozone by-products of micropollutants. � Ozonation could effectively reduce precursors of THMs and HAAs, but once those chlorinated by-products were formed, ozone could hardly
Ozone: Science and Engineering
February 2005
Downloaded By: [2007 Yonsei University Central Library] At: 09:22 8 March 2007
reduce the pre-formed THMs and HAAs. Therefore, if water contains significant amount of DBP precursors, the use of ozone is recommended as a replacement to pre-chlorination prior to free chlorination. � Ozone could remove precursors of THM and HAAs, without changing TOX concentration. This suggests a further exploration of unidentified chlorinated by-products with toxicological investigation. � Excellent correlation between UV254 parameter and precursors of HAAs and THMs were found, suggesting that UV254 could serve as a useful indicator for controlling HAAs and THMs. � Aldehydes were found to increase after ozonation. However, due to the low concentration of aldehydes in raw and process water, biologically favored condition had not been provided in GAC bed. Under this condition, organic matters on GAC bed would be mainly removed by adsorption process rather than by biodegradation on the carbon bed.
9.
10.
11. 12.
13.
14.
15.
16. 17.
ACKNOWLEDGMENT This research was sponsored by the Waterworks Research Institute in Korea. Authors are thankful for the support of this fund.
18. 19.
20.
REFERENCES 1. Bruno, L., A. R. David, and R. B. Deborah, Ozone in Water Treatment (Denver, CO: Lewis Publishers, 1991), p. 12. 2. Bryant, E. A., G. P. Fluton, and G. C. Budd, Disinfection Alternatives for Safe Drinking Water (New York: Van Nostrand Reinhold, 1992), p. 71. 3. Chang, S. D. and P. C. Singer, ‘‘The Impact of Ozonation on Particle Stability and the Removal of TOC and THM Precursors,’’ J. AWWA, 83(3):11–26 (1991). 4. Ching, P. C., E. E. Chang, and C. H. Liang, ‘‘NOM Characteristics and Treatabilites of Ozonation Processes,’’ Chemosphere, 46:929–936 (2002). 5. Federal Register Natural Interim Primary Drinking Water Regulations, 44, 68, 624 (1979). 6. Federal Register, Natural Primary Drinking Water Regulations: Disinfectants and Disinfection By-Products; Final Rule p63, 69, 389 (1998). 7. Glaze, W. H., M. Koga, and D. Cancilla, ‘‘Ozonation By-Products. 2. Improvement of an Aqueous-Phase Derivatization Method for the Detection of Formaldehyde and Other Carbonyl Compounds Formed by the Ozonation of Drinking Water,’’ Environ. Sci. Technol., 23(7):838–847 (1989). 8. Glaze, W. H., M. Koga, D. Cancilla, K. Wang, M. J. McGuire, S. Liang, M. K. Davis, C. H. Tate, and E. M. Aieta, ‘‘Ozonation
21.
22. 23.
24.
25. 26. 27.
28.
Ozone: Science and Engineering
By-Products. 3. Evaluation of Ozone By-Products from Two California Surface Waters, J. AWWA, 81(8):66–73 (1989). Glaze, W. H., G. R. Peyton, S. Lin, R. Y. Huang, and J. L. Burleson, ‘‘Destruction of Pollutants in Water with Ozone in Combination with Ultraviolet Radiation. II. Natural Trihalomethane Precursors,’’ Environ. Sci. Technol., 16:454–458 (1982). Glaze, W. H. and H. S. Weinberg, Identification and Occurrence of Ozonation By-products in Drinking Water (Denver, CO: AWWARF, 1993), p. 8. Gould, J. P., and W. J. Wever, Jr., ‘‘Oxidation of Phenols by Ozone,’’ J.–Wat. Pol. Cor. Fed., 48(1):47–60 (1976). Kadokami, K., M. Morimoto, K. Haraguchi, M. Koga, and R. Shinohara, ‘‘Multiresidue Determination of Trace Pesticides in Water by Gas Chromatography/Mass Spectrometry with Selected Ion Monitoring,’’ Anal. Sci., 7:247–252 (1991). Kadokami, K., K. Sato, Y. Hanada, R. Shinohara, M. Koga, and H. Shiraishi, ‘‘Simultaneous Determination of 266 Chemicals in Water at PPT Levels by GC-Ion Trap MS,’’ Anal. Sci., 11:375–384 (1995). Kang, J. W., H. S. Park, R. Y. Wang, M. Koga, K. Kadokami, H. Y. Kim, E. T. Lee, and S. M. Oh, ‘‘Effect of Ozonation for Treatment of Micropollutants Present in Drinking Water Source,’’ Water Sci., Tech., 36(12): 299–307 (1997). Karanfil, T., M. A. Schlautman, and I. Erdogan, ‘‘Survey of DOC and UV Measurement Practices with Implications for SUVA Determination,’’ J. AWWA, 94(12):68–80 (2002). Minear, R. A. and G. L. Amy, Disinfection By-Products in Water Treatment (New York, NY:Lewis, 1996), pp. 174–178. Owen, D. M., Z. K. Chowdhury, R. S. Summers, S. M. Hooper, G. Solarik, and K. Gray, Removal of DBP Precursors by GAC Adsorption (Denver, USA: AWWARF and AWWA, 1998), p. 135. Pontius, F. ‘‘Complying with Future Water Regulations’’, J. AWWA, 91(3):46–58 (1999). Pourmoghaddas, H. and A. A. Stevens, ‘‘Relationship Between Trihalomethanes and Haloacetic Acids with Total Organic Halogen During Chlorination,’’ Water Res., 29(9):2059–2062 (1995). Reynolds, G., R. Graham, R. Perry, and R. G. Rice, ‘‘Aqueous Ozonation of Pesticides: A Review,’’ Ozone Sci. Eng. 11:339–382 (1989). Rice, R. G., ‘‘Emerging Technologies for Compliance with Disinfection and Disinfection By-Products Regulations,’’ Presented at EPA Workshops on Emerging Technologies for Drinking Water Treatment, (1987–1988). Schechter, D. S. and P. C. Singer, ‘‘Formation of Aldehyde During Ozonation,’’ Ozone Sci. Eng., 17:53–69 (1995). Singer, P. C. and S. D. Chang, Impact of Ozone on the Removal of Particles, TOC, and THM Precursors (Denver, CO: AWWARF, 1989), p. 43. Sylivia, E. B., W. K. Stuart, and L. A. Gary, Natural Organic Matter and Disinfection By-Products Characterization and Control in Drinking Water (Washington, D.C: American Chemical Society, 2000), p. 16. US EPA, Methods for the Determination of Organic Compounds in Drinking Water: Supplement 2, EPA 600R92129 (1992). US EPA, Methods for the Determination of Organic Compounds in Drinking Water: Supplement 3, EPA 600R95131 (1995). White, M. C., J. D. Thompson, G. W. Harrington, and P. C. Singer, ‘‘Evaluating Criteria for Enhanced Coagulation Compliance,’’ J. AWWA, 89(5):64–77 (1997). Yuefeng, X., ‘‘Analyzing Haloacetic Acids Using Gas Chromatography/Mass Spectrometry,’’ Water Res. 35(6):1599–1602 (2001).
February 2005
79
Downloaded By: [2007 Yonsei University Central Library] At: 09:22 8 March 2007