P1.16A
CONVECTIVE BOUNDARY LAYER DEVELOPMENT OVER A MIDLATITUDE DECIDUOUS FOREST H.N Zutter, C.S.B. Grimmond*, A.J. Oliphant, H.P. Schmid, H-B. Su, L. Ciasto Indiana University, Bloomington, Indiana
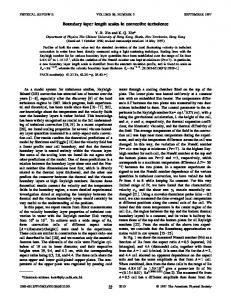
1. INTRODUCTION⋅ The height of the planetary boundary layer is a fundamental parameter that characterizes the structure of the lower troposphere. It determines the volume available for the dispersion and concentrations of mass exchanges such as CO2, H2O, and pollutants. Studies that have examined the daytime growth of the convective boundary layer (CBL) over forests (e.g. Martin et al. 1988, Barr & Betts 1997, Davis et al. 1997, Wilczak et al. 1997, Levy et al. 1999), have been restricted to time periods of a single season or less. The objective here is to examine seasonal variability in CBL development during clear-sky, anticyclonic conditions over a deciduous forest in the midwestern USA. Vertical profiles of air temperature and humidity are analyzed and used to evaluate predictions of CBL growth from a simple mixed-layer slab model, as well as sensitivity of the model to initialization data. 2. PHYSICAL SETTING AND METHODOLOGY Vertical profile data were collected using AIR tethersonde and airsonde systems (Vaisala, Boulder, CO), from a balloon release site located in a forest clearing near the Morgan-Monroe State Forest (MMSF, 39° 19’N, 86° 25’W south central Indiana) AmeriFlux tower. For this site zd is 21 m, and z0m is 2.1±1.1 m (Schmid et al. 2000). The mixing layer height (zi) was determined for each profile using three independent methods: simple parcel method, critical inversion method, and inversion base method (Figure 1).
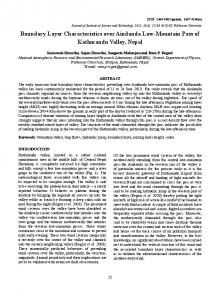
the assumptions that the CBL is perfectly mixed, and large scale advection and subsidence are negligible. The model was initialized with a pre-dawn vertical profile of potential temperature and specific humidity, and driven by surface micrometeorological data. Initialization profiles were taken from MMSF as well as the three nearest National Weather Service (NWS) profiling stations: Nashville, TN (BNA), Wilmington, OH (ILN), and Lincoln, IL (ILX). 15-min surface data from the MMSF flux tower 46 m level (~1.8 × canopy height) are used. 3. RESULTS The observed vertical profiles have classic patterns: well developed surface inversions overlain by residual mixed layers in the early morning are eroded, and well mixed convective layers develop by the late morning (Zutter, 2002). Daily maximum zi (zimax) estimated using the three methods for 26 profiling days throughout a year yield similar results (Figure 2). Of the three, the simple parcel method showed closest correspondence to the mean value (MAE=90 m for all profiles); whereas MAE for the critical inversion was 127 m and base of inversion method 145 m. The seasonal pattern of zimax shows greatest vertical development in spring and early summer, with lower values in fall and winter. During the leaf-off period, there is a strong linear and positive relationship between daily total QH and zimax (r2=0.86, n=9), while the relationship during the growing season was significantly weaker. Some of this variability is explained by differences in synoptic control, determined by surface atmospheric pressure, the strength of the θ gradient above zi, and length of time following passage of a cold front. 3000 Critical inversion Simple parcel Base of inversion
2500
The daytime growth of zi is modeled based on the slab model of Cleugh and Grimmond (2001), where zi is governed by surface heat fluxes and entrainment, with
zimax
2000
Figure 1: Three methods used to determine zi, a) simple parcel, b) critical inversion (where T2 - T1 = 2 K), c) base of inversion
1500
1000
500 2001
0
⋅
*Corresponding author address: Sue Grimmond, Indiana University, Dept. of Geography, Bloomington, IN 47405-7100; email:
[email protected]
50
2000
100
150
200
Day of year
250
300
350
Figure 2: Estimation of zimax determined using three methods from vertical profiling data over the MMSF for 26 days in 2000, 2001.
Model runs were conducted for each of the profiling days using a range of input data, including surface and profile data from MMSF, modeled surface data, and profiles from the NWS profiling stations. Examples from each season of zi observed using the three methods discussed earlier and modeled using initialization profiles from MMSF, BNA, ILN and ILX are presented in Figure 3. Overall, model results correspond reasonably well with observations, and ILN appears to provide the most representative initial profile of the three external sites. 3000 00/205
00/284
01/049
01/108
2500
zi (m)
2000 1500 1000 500 0
energy fluxes into the slab model, increased the zi RMSE on average by 88 m compared with observed fluxes, corresponding to a 22% increase in error. 4. CONCLUSIONS Seasonal analysis of boundary layer growth is examined for clear anticyclonic days throughout a oneyear period. Observations of vertical profiles show significant seasonal variability with greatest vertical development occurring in spring. zimax was found to correspond to daily total QH, but with significant day-today variability caused by synoptic controls. A slab model performed well in predicting boundary layer growth and magnitudes of θ and q. Furthermore, model accuracy did not weaken significantly when initialized by NWS profile data from surrounding stations and when driven by modeled surface fluxes, giving confidence in the ability to model boundary layer development in datasparse regions. 5. ACKNOWLEDGEMENTS
2500
zi (m)
2000 Critical inversion Simple parcel Base of inversion mmsf ILX ILN BNA
1500 1000 500 0 600 800 1000 1200 1400 1600 1800 Time (h)
600 800 1000 1200 1400 1600 1800 Time (h)
Figure 3: Comparison of observed and modeled daytime evolution of zi at MMSF for four days when model was initialized with data from MMSF, ILX, ILN, BNA. Statistical analyses indicate that using the MMSF profile to initialize the models, zi was best determined by the simple parcel method, and in general zi is underpredicted for all methods (mean slope of 0.86). Most of the error is unsystematic, suggesting an approach using surface forcing and entrainment to predict zi has relatively few consistent problems. Instead, error is likely to result from day to day variability of parameters not included, such as subsidence and advection. The mixed layer mean potential temperature (θm) and specific humidity (qm) are predicted with somewhat greater accuracy than zi, with θm over-predicted by only 1%, while qm was under-predicted by 11%. MAE in estimates of zi when NWS profiling stations were used to initialize the model were only 20-30 m more than when MMSF profile data were used. Of the three sites, BNA and ILN provided the most appropriate initial profiles, with ILX performing relatively poorly by comparison, though patterns of systematic errors between sites were small, suggesting the accuracy of modeling was controlled by the day-to-day differences with which each profiling site was representative of MMSF. Modeled fluxes - QE from a modified PenmanMonteith equation and QH determined as a residual - in general underestimated observed fluxes by 35% and 9% respectively, although again with significant seasonal variability. Incorporating modeled surface
Funding was provided by NIGEC, Dept of Energy (Cooperative Agreement No. DE-FC03-90ER61010). Authors are grateful for the co-operation of MMSF management and to all the field assistants who helped with profiling.
6. REFERENCES Barr A.G., Betts A.K. 1997. Radiosonde boundary layer budgets above a boreal forest, JGR. 102, 2920529212. Cleugh H.A., Grimmond C.S.B. 2001. Modeling regional-scale surface energy exchanges and CBL: Growth in a heterogeneous, urban-rural landscape, Bound. Lay. Meteor. 98, 1-31. Davis K.J., Lenschow D.H., Oncley S.P., Kiemle C., Ehret G., Giez A., Mann J. 1997. Role of entrainment in surface-atmosphere interactions over the boreal forest, J. Geophys. Res. 102, 29219-29230. Grimmond, C.S.B. Oke, T.R.: 1999. Heat storage in urban areas: local-scale observations and evaluation of a simple model, J. Appl. Meteor. 38, 922-940. Levy P.E., Grelle A., Lindroth A., Mölder M., Jarvis P.G., Kruijt B., Moncrieff, J.B. 1999. Regional-scale CO2 fluxes over central Sweden by a boundary layer budget method, Ag. For. Meteor. 98-99, 169-180. Martin C.L, Fitzjarrald D., Garstang M., Oliveira A.P., Greco S., Browell E. 1988. Structure and growth of the mixing layer over the Amazonian rain forest, JGR 93, 1361-1375 Schmid H.P, Grimmond C.S.B., Cropley F., Offerle, B., Su H.-B. 2000. Measurements of CO2 and energy fluxes over a mixed hardwood forest in the midwestern United States, AFM. 103, 357-374. Wilczak J.M, Cancillo M.L, King C.W. 1997. A wind profiler climatology of boundary layer structure above the boreal forest, JGR. 102, 29083-29100. Zutter, H.N. 2002.Convective Boundary layer development over a mid-latitude deciduous forest. Unpublished MS Thesis, Indiana University, Dept. Geography.