Paper B-04, in: V.S. Magar and M.E. Kelley (Eds.), In Situ and On-Site Bioremediation—2003. Proceedings of the Seventh International In Situ and On-Site Bioremediation Symposium (Orlando, FL; June 2003). ISBN 1-57477-139-6, published by Battelle Press, Columbus, OH, www.battelle.org/bookstore.
A HYDROGEN RECIRCULATION SYSTEM FOR THE TREATMENT OF TCE-IMPACTED GROUNDWATER Carol E. Aziz (
[email protected]), Shahla K. Farhat, Elaine A. Higgins, and Charles J. Newell (Groundwater Services, Houston, TX) Jerry Hansen (Air Force Center for Environmental Excellence, San Antonio, TX) ABSTRACT: To speed the rate of reductive dechlorination of trichloroethylene (TCE)impacted groundwater at the Old Jet Engine Test Site (OJETS), Offutt AFB, Nebraska, an in situ pilot-scale dissolved hydrogen addition system was installed. The test area consisted of an injection well, a recovery well, and five monitoring wells within an 8.5 m x 4.3 m (28 ft x 14 ft) test plot. Groundwater was pumped from the recovery well at a flow rate of 1.5 L/min (0.4 gpm), amended with hydrogen at 20 mL/min, and injected into the injection well, thereby creating a recirculation system. The results of the first 6 months of operation are presented in this paper. After 6 months of operation, the oxidation-reduction potential and dissolved oxygen of the groundwater decreased. Despite background sulfate levels of 280 mg/L, the mean TCE concentration declined 63% from 2.9 µmol/L to 1.07 µmol/L. Significant production of cis-1,2-dichloroethene (cDCE) was observed within the test area (i.e., 0.7 to 3.0 µmol/L), indicating that the hydrogen was promoting reductive dechlorination. The cDCE:TCE ratio increased more than ten fold from 0.25 to 2.8, despite decreasing groundwater temperatures. In summary, the dissolved hydrogen recirculation system was effective in removing TCE from groundwater without significant vinyl chloride production. INTRODUCTION The major contaminants of concern at the OJET site are TCE and its daughter products. Although these constituents can undergo natural attenuation, the rate can be severely limited by inadequate quantities of electron donor. At sites where natural dechlorination is occurring, organic substrates such as aromatic hydrocarbons (BTEX), landfill leachate, or natural organic matter can provide a source of dissolved hydrogen, produced through slow fermentation of these organics. The hydrogen is then rapidly utilized as an electron donor by naturally occurring bacteria to achieve reductive dechlorination of chlorinated compounds in the subsurface. Direct hydrogen addition eliminates the rate-limiting step (i.e., slow fermentation), by providing naturally occurring dechlorinating bacteria with substantive quantities of hydrogen. Because hydrogen is an ideal electron donor for anaerobic bacteria, dechlorinating microorganisms compete for dissolved hydrogen with other bacteria, such as methanogens, sulfate reducers, nitrate reducers, in the subsurface. Both laboratory and field studies (Carr and Hughes, 1998, Newell et al., 2000; Newell et al., 2001) have shown that the populations of dechlorinating microorganisms can be successful at competing for hydrogen in a hydrogen-rich environment This result can be attributed to the dechlorinators having: (i) a higher maximum utilization rate and (ii) a higher yield.
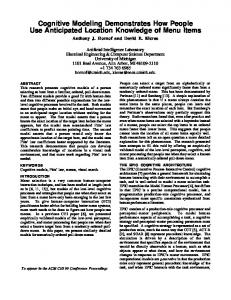
Objectives. The objectives of this work were: • To test the efficacy of dissolved hydrogen addition as an electron donor to promote the biological reductive dechlorination of trichloroethylene (TCE)impacted groundwater; and, • To determine how effectively a hydrogen addition system operates under background sulfate conditions of 280 mg/L. Site Description. The test was conducted at Offutt AFB, located 8 kilometers (5 miles) south of Omaha, Nebraska. The hydrogen addition system was located at the Old Jet Engine Test Site (OJETS) at the center of a 37 m x 49 m (120 ft x 160 ft) TCE plume near well cluster OJET-MW2. TCE and cDCE were the primary constituents of concern. Maximum TCE concentrations were 2.3 mg/L, and cDCE was detected at concentrations as high as 0.15 mg/L, indicating a native dechlorinating culture. Sulfate concentrations ranged from 51 to 280 mg/L in the test area. Local groundwater flow was in the south-southeast direction, with an average hydraulic gradient of 0.00025 m/m (ft/ft) prior to system installation. The average hydraulic conductivity for the alluvial silty sand was calculated as 0.64 m/day (2.1 ft/day), with seepage velocity is estimated to be 0.2 m/yr (0.64 ft/yr) (W-C, 1997). PILOT TEST DESCRIPTION Conceptually, the pilot test area consisted of a 2-well extraction/injection system with 5 monitoring wells installed within the test area. Groundwater was pumped from the downgradient extraction well, amended with hydrogen, and injected into the injection well, thereby creating a recirculation system. Well Network. The well network consisted of 1 injection well, 1 extraction well, and 5 monitoring wells installed within the test area. The injection well was positioned 8.5 m (28 ft) away from the extraction well, and the monitoring wells were positioned on 1.5, 1.5, 2.1, and 3.3 m (5, 5, 7, and 11–ft) centers between the injection and extraction wells as shown in Figure 1. All wells were installed to a depth of 7.3 m (24 ft) with 3 m (10 ft) of screen between 3.7 and 6.7 m (12 and 22 ft) below ground surface. The extraction and injection wells were constructed of 10 cm (4-in) PVC, while the monitoring wells were constructed of 5 cm (2-in) PVC. Hydrogen Amendment Equipment. Groundwater was pumped from the extraction well at 1.5 L/min (0.4 gpm) through an above-ground gas addition unit where hydrogen was added into the flow stream at a rate of 20 mL/min under 10 psi of pressure. The hydrogen-amended water then passed through a static mixer and 7.3 m (24 ft) of 5 cm (2 inch) pipe to allow additional residence time for hydrogen dissolution. Groundwater with 0.5 mg/L hydrogen was subsequently injected into the injection well, upgradient of the monitoring wells. A circular flow system was thereby created where the hydrogen in the circulating groundwater stimulated biological activity within the test zone. Safety features included positioning the pump 4.6 m (15 feet) away from the hydrogen skid and using water level probes in the extraction well and relays to shut down the pump and hydrogen in the event of low water levels.
Groundwater Flow
System Layout MW-10S H2 SKID
MW-12S MW-14S MW-13S
4.6 m (15'-0")
8.5 m (28'-0")
MW-11S
MW-15S
MW-16S
PUMP SKID
Legend Injection well
SCALE (meters) 0
.75
1.5
Monitoring well Recovery well
FIGURE 1. Layout of wells and hydrogen addition equipment. Analytical Methods. The wells were sampled for volatile organic compounds (perchloroethylene(PCE), TCE, DCE isomers, vinyl chloride (VC)), natural attenuation parameters (dissolved oxygen, nitrate, sulfate, ferrous iron, hydrogen, redox potential, ethene, ethane, methane, and alkalinity) and water quality indicators (pH, temperature, and specific conductance). Volatile organic compounds were analyzed using EPA Method 8021b and nitrate was analyzed by Method 300 by Southern Petroleum Laboratories, Houston. Hydrogen, ethene, ethane, and methane were collected using the bubble-strip method and analyzed by Method AM20GAX by Microseeps, Pittsburgh. Sulfate, ferrous iron, and alkalinity were measured in the field using Hach kits. Sampling occurred at start-up (4/02) and then after approximately every three months thereafter. RESULTS AND DISCUSSION Depression of Dissolved Oxygen and Redox Potential. Within 6 months of the system installation, the aquifer in the test area was more reduced as a result of the hydrogen addition. When the dissolved oxygen concentrations of the five monitoring wells were averaged, the mean dissolved oxygen (D.O.) concentration decreased from 0.7 mg/L to 0.3 mg/L. In addition, the mean ORP declined markedly from -101.7 mV to -180.7 mV (Table 1). These reduced conditions created an environment more conductive to reductive dechlorination.
TABLE 1. Mean dissolved oxygen and redox potential over the first six months of system operation. Months of Operation 4 -124.2 0.1
0 -101.7 0.7
Mean ORP (mV) Mean D.O. (mg/L)
6 -180.7 0.3
Iron and Sulfate Reduction and Methanogenesis. Further indication that the hydrogen addition was creating more reduced conditions in the aquifer in the test area was evident from examining the mean ferrous iron and sulfate concentrations of the five monitoring wells. As seen in Figure 2, mean ferrous iron concentrations increased three fold from 6.4 to 18.9 mg/L during the first six months of system operation, while sulfate concentrations decreased from 190 mg/L to 100 mg/L (Figure 3). Some increase in the mean methane concentrations was evident (i.e., from 0.05 mg/L to 0.36 mg/L), but generally the concentrations were low. Mean of all MWs
Ferrous Iron (mg/L)
20 16 12 8 4 0
0
4
6
Months of Operation
FIGURE 2. Effect of hydrogen system on iron reduction. Mean of all MWs
200
Sulfate (mg/L)
160 120 80 40 0
0
4
6
Months of Operation
FIGURE 3. Effect of hydrogen system on sulfate reduction.
TCE Removal and Daughter Product Generation. After 6 months of operation, the mean TCE concentration was reduced 63% from 2.9 µmol/L (0.38 mg/L) to 1.07 µmol/L (0.14 mg/L) as shown in Figure 4. Almost all the degraded TCE was transformed to cDCE, with the cDCE concentration increasing from 0.72 µmol/L (0.07 mg/L) to 3.0 µmol/L (0.29 mg/L). Small amounts of vinyl chloride were generated (i.e., VC increased from 0.04 to 0.07 µmol/L) and ethene and ethane were present, indicating the presence of bacteria that can completely dechlorinate TCE. TCE cDCE VC Ethene + Ethane
3.5
Mean Concentration (umol/L)
3.0 2.5 2.0 1.5 1.0 0.5 0.0 0
1
2
3
4
5
6
Months of Operation
FIGURE 4. Effect of hydrogen on TCE and daughter products. The conversion of TCE to cDCE was particularly striking when the mean cDCE/TCE ratio was examined over time (Figure 5). The ratio increased more than ten fold from 0.25 to 2.8, despite decreasing temperatures between months 4 and 6 and high sulfate concentrations. 25
3.0
20
2.0 15 1.5 10 1.0
Temperature ( oC)
cDCE:TCE Molar Ratio
2.5
cDCE/TCE Ratio Temperature
5
0.5
0.0
0 0
4
6
Months of Operation
FIGURE 5. Effect of hydrogen addition on cDCE:TCE ratio.
CONCLUSIONS The installation of the dissolved hydrogen addition system was successful in reducing the ORP of the aquifer, thereby creating conditions more conducive to reductive dechlorination. The hydrogen provided sufficient electron donor to stimulate biological reductive dechlorination, despite background sulfate concentrations as high as 280 mg/L and decreasing temperatures. After 6 months of operation, mean TCE removals as high as 63% were achieved, with minimal VC production. The mean cDCE:TCE ratio increased over time from 0.25 to 2.8. The production of small amounts of methane did not appear to impair TCE degradation. Improved performance is expected over the remaining 10 months of the test as the dechlorinating population grows and the ambient groundwater temperature increases. ACKNOWLEDGMENTS This work was funded by the Technology Transfer Division of the Air Force Center for Environmental Excellence under contract number F41624-97-C-8020. REFERENCES Carr, C.S., and J.B. Hughes. 1998. “High-Rate Dechlorination of PCE: Comparison of Lactate, Methanol, and Hydrogen as Electron Donors.” Environmental Science and Technology. 30(12): 1817-1824. Newell, C. J., P.E. Haas, J.B. Hughes, and T.A. Khan. 2000. “Results from Two Direct Hydrogen Delivery Field Tests for Enhanced Dechlorination.” Proceedings of the 2000 Battelle Remediation of Chlorinated and Recalcitrant Compounds Conference, Monterey, CA. Newell, C.J., C.E. Aziz, P.E. Haas, J. B. Hughes, and T.A. Khan, 2001. “Two Novel Methods for Enhancing Source Zone Bioremediation: Direct Hydrogen Addition and Electron Acceptor Diversion, Anaerobic Degradation of Chlorinated Solvents.” V. Magar, D. Fennell, J. Morse, B. Alleman, and A. Leeson (Eds.), In Situ and On-Site Bioremediation: The Sixth International Symposium, pp. 19-26, Battelle Press, Columbus, Ohio. Woodward-Clyde (W-C). 1997. Draft, Installation Restoration Program Investigation OJETS (SD-41). Offutt AFB, Nebraska, May.