Parallel big data processing system for security monitoring in Internet of Things networks∗ Igor Kotenko1,2†, Igor Saenko1,2 , and Alexey Kushnerevich1,2 Petersburg Institute for Informatics and Automation (SPIIRAS) 39, 14-th Liniya, Saint-Petersburg, 199178, Russia 2 St. Petersburg National Research University of Information Technologies Mechanics and Optics (ITMO University) 49, Kronverkskiy prospekt, Saint-Petersburg, 197101, Russia {ivkote, ibsaen, kushnerevich}@comsec.spb.ru 1 St.
Abstract Nowadays, the Internet of Things (IoT) networks are increasingly used in many areas. At the same time, the approach connected with the implementation of the network security monitoring system is of particular relevance for the protection of IoT networks from threats. Due to the peculiarities for construction and operation of IoT networks, the use of traditional protection systems for IoT is difficult or impossible. One of such features is the need to analyze very large amounts of data in real time and with minimal computational cost. Given the limited computing capabilities of IoT networks, we propose the architecture of a big data distributed parallel processing system based on Hadoop and Spark software platforms. The issues related to the implementation of this system and its main components are also considered. The results of an experimental evaluation of the system performance are discussed. They confirm the conclusion about its high efficiency. A comparative evaluation of the implemented systems on Hadoop and Spark platforms is conducted. Keywords: complex event processing, Hadoop, Spark, security monitoring.
1
Introduction
The IoT networks allow one to integrate various computer devices through different types of communications into a single information infrastructure. The types of communications include the Internet, mobile networks, local networks and others. The computer devices that are combined with the IoT include central computers, user devices with embedded controllers, sensors of environmental information and others. These factors are the reasons why IoT networks are now finding increasing dissemination in many areas (healthcare, transport systems, smart houses, robotics, etc.). At the same time, IoT networks have features that distinguish them from traditional computer networks. Such features are a very large number of data sources, a very large input stream of heterogeneous data, limited computing and energy resources of IoT network nodes. Because of these features, the security problem of IoT networks is rather actual. Vulnerabilities of network nodes, variety and complexity of cyber attacks and gravity of their consequences [2, 3] highlight the importance for efficient methods and means of information security, but Journal of Wireless Mobile Networks, Ubiquitous Computing, and Dependable Applications, 8:4 (December), pp. 60-74 ∗ This paper is an extended version of the work originally presented at the 25th Euromicro International Conference on Parallel, Distributed and Network-Based Processing (PDP’17), St.-Petersburg, Russia, March 2017 [1]. † Corresponding author: Laboratory of Computer Security Problems, St. Petersburg Institute for Informatics and Automation (SPIIRAS), 39, 14-th Liniya, Saint-Petersburg, 199178, Russia, Tel: +7(812) 328-71-81, E-Mail:
[email protected], Web: http://www.comsec.spb.ru/
60
Parallel big data processing system
Kotenko, Saenko, and Kushnerevich
traditional methods and means of information security are not effective enough in IoT networks. This is due to the low computing power of IoT network resources and the large number of different types of used communication networks. For these reasons, a new approach is of particular relevance for the security of IoT networks. This approach is associated with the creation and application of security information and event management (SIEM) systems [4, 5, 6]. SIEM systems monitor network security. The monitoring consists of collecting data about security events from remote devices, information sensors and network elements and their preliminary processing. However, a large number of data sources types that are used for network security monitoring and high intensity of event streams lead to the need of developing new solutions for processing of Big Data. One such solution is the approaches proposed in this paper to develop a system for parallel processing of security data intended for implementation in IoT networks. The developed parallel data processing system has the following features determining the theoretical and practical significance of the paper. First, due to the use of Complex Event Processing (CEP) technology, the system implements basic real-time pre-processing functions, which are data normalization, data filtering, data aggregation and data correlation. Secondly, the results of preliminary processing are provided by visual representation (visualization). For this purpose, not only standard, but also specially designed visualization models are used. Thirdly, the system operates under the conditions of inherent computational limitations of the IoT network elements. In this case, the basis for building a parallel security data processing system is the Hadoop open source software environment. As it is known, Hadoop is currently the most widespread and rather flexible platform, allowing to create parallel processing systems [7, 8, 9]. In addition, a Spark distributed data processing environment was used. This allowed us to compare the efficiency of the Hadoop and Spark platforms to develop a system for parallel processing. Thus, the main goal of the work is to develop and study architectural and system solutions aimed at creating a parallel processing system for IoT network monitoring, as well as comparing the performance of Hadoop and Spark parallel processing platforms to be used to build this system.
2
Related work
Questions related to the usage of CEP technology and Hadoop platform for parallel processing of data have recently been the focus of research in the Big Data field. Let us consider the most characteristic works in which CEP technology is implemented based on Hadoop. A system for analyzing big data in medical information infrastructures is discussed in [10]. This system is based on Hadoop, implemented in Java, belongs to open source software under the auspices of Apache and uses a relatively simple software model. The architecture of this system includes an Event Adapter, a CEP Analysis Engine, and a Report & Event Generator. The system is aimed at sharing medical institutions with ERP systems. The analysis engine contains an Event Collector, a Data Analyzer and a Storage Server. Unfortunately, the authors of this paper do not give the results of an experimental evaluation of the system under consideration. In [11], a system based on Hadoop compatible software and the Java platform is considered. This system consists of user interaction, data analysis, and data storage components. Interaction between components is performed using queries. Control is carried out by Java Servlet controllers. However, this system is oriented to process data only in web applications. This limitation and the lack of experimental evaluation results do not allow us to assert that this can be used to monitor the IoT network security. CEP system for processing big datasets when controlling the movement of urban passenger vehicles is considered in [12]. The proposed system combines two technologies: CEP and Distributed Stream Processing Systems (DSPSs) [13]. CEP technology is supported by the Esper system. DSPS is realized by the Storm system. The Hadoop system is an integrator that combines these two technologies. In addition, Hadoop provides a historical data analysis. Experimental evaluation of this system showed its 61
Parallel big data processing system
Kotenko, Saenko, and Kushnerevich
high scalability. However, in our opinion, the application of this system to handle large volume of IoT network monitoring data is difficult. This is due to the large requirements of this system for computing resources. A system that integrates CEP technology and Data Mining methods is discussed in [14]. As the scope of this system, the ”smart city” scenario is considered. ”Smart City” is a variation of the IoT network. For this reason, this work is of undoubted interest, since it is an example of the CEP application in IoT networks. The system contains the module for data integration and preprocessing, in which data mining is performed. However, in our opinion, data mining on large volumes requires significant computational costs. Therefore, this system in IoT networks has limited application. Interesting are some known works in which issues of improving the CEP technology are investigated. In [15], a CEP system is presented, in which a High-Level Event Query Language (SQL) is implemented. For this language, query optimization algorithms have been developed. The optimization criterion is the minimum CPU time. In [16] the language for typical queries in the CEP environment is presented. It allows one to process complex queries more quickly. However, the widespread use of these systems to monitor IoT networks is difficult due to the need for additional software tools that support these query languages. Systems for web data processing using CEP technology are offered in [17, 18]. In [17], web data is preliminarily translated into lightweight structure events. [18] considers the system that allows one to describe and monitor complex events in near real time. However, in spite of the fact that both proposed approaches are feasible, the issues of preliminary processing of events on the basis of parallel computations were not considered in these works. CEP system, designed to collect and preprocess data with RFID, is considered in [19]. In this system, the results of event stream processing are stored in the MySql database. This system is an example of the CEP technology implementation in the IoT network. However, it can not be successfully used for security monitoring of IoT networks, since the issues of big data parallel processing are not considered. In [20, 21], a well-scaled CEP system for analyzing data streams is considered. The system performs a centralized load parallelization by splitting queries into sub-queries and assigning computing clusters to sub-queries. The authors investigated various strategies for cluster assignment. At the same time, the results are oriented to a cluster computing infrastructure with a very large number of nodes. The focus on cluster infrastructure prevents to the use of this system in IoT networks. [22] suggests an approach that supports the accuracy of parallel execution of data streams through the implementation of active rule support by CEP mechanism. This approach is called Active CEP. Active rules allow maintaining the integrity of CEP transactions. However, it hard to implement this approach for parallel processing of events in IoT networks due to computational cost constraints. In [23] it is proposed to use genetic algorithms for load balancing. The system takes into account different characteristics of IoT communication channels (throughput, input load, etc.). However, genetic algorithms cannot be considered as a big data processing method, providing near real-time scale. Summarizing the analysis of parallel processing systems and CEP applications for IoT, the following conclusions can be drawn. First, network security monitoring is a relatively new and under-researched area for big data parallel processing systems. Secondly, there are certain works devoted to the implementation of CEP in networks like IoT. However, the issues of big data parallel processing in IoT are considered insufficiently. Finally, there are CEP systems intended for parallel processing of big data. However, these systems cannot be implemented in IoT because IoT has hard limitations on the bandwidth of communication channels and the performance of computing nodes. 62
Parallel big data processing system
3
Kotenko, Saenko, and Kushnerevich
System architecture
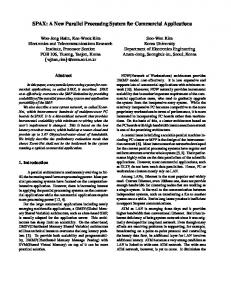
Let us consider the architecture of the suggested big data processing system for IoT network security monitoring and the features of its components. Sources of security events are end-user devices (”things”) and network infrastructure elements (routers, anti-virus tools, operating systems, DBMS, firewall etc.). These events are fixed in the relevant security logs. Sources generate large data streams. These streams can be referred to the category of Big Data. As a result, the proposed system is a competitor for traditional network security systems in cases where the latter systems are not able to handle big data streams in IoT networks in a timely manner. The architecture of the system includes five functional components shown in Fig. 1.
Figure 1: System architecture These components are: • data collection; • data storage; • data aggregation; • data normalization and analysis; • data visualization. In Fig. 1, arrows show the main directions of data streams. All components are based on the means of implementing Hadoop / Spark parallel streaming computing, installed on the virtualization platform. 63
Parallel big data processing system
Kotenko, Saenko, and Kushnerevich
This approach allows us to achieve the necessary scalability of the system, as well as its high flexibility. As a result, the system can be configured for any IoT network configuration. The input of the data collection component receives streams of large security events. The data collection component organizes distributed data reception and its storage in the data storage component. In addition, the data collection component contains a test data stream generator. It is used to evaluate the effectiveness of the system. The collected data is recorded in the Hadoop Distributed File System (HDFS). HDFS is the basis of the data storage component. It is formed by means of Hadoop / Spark. HDFS is an alternative and more efficient way of storing data for IoT network security monitoring than traditional SQL database management system [24]. After security events are recorded, they are packaged into data streams with a specific data scheme. The simplest (minimal) version of the data schema, shown in Fig. 1, contains the following fields: • “IP src” – source IP address; • “port src” – source port; • “IP dst” – destination IP address; • “port dst” – destination port. This stream is passed to the data aggregation component which processes the stream using Hadoop / Spark tools by the streaming CEP technology functionality. The data aggregation component calculates extremums (minimum and maximum) and central tendency measures (average values, modes, quantiles etc.) using security events records. As an example, Fig. 2 shows a CEP operators chain intended to detect the port scan security events. We will discuss it in detail in Section 5. The chain consists of CEP operators Map, ReduceByKey, and Filter. The Map operator divides the stream into substreams for their parallel execution. The ReduceByKey operator integrates independent substreams by key and performs function over values of the integrated substreams. The Filter operator performs the selection of records in the stream using the given rules.
Figure 2: CEP operators chain The output results of the data aggregation component are recorded in HDFS and transferred to the input of the data normalization and analysis component. Data normalization consists of bringing all input data to a single internal format. The CSV (Comma-Separated Values) format was proposed as such one. Data analysis consists of identifying security incidents based on predefined rules for correlating events in the input data stream. Therefore, in this component, more complex data processing tasks are solved. As an example, Fig. 1 shows the detection of cases when the number of packets per a port exceeds the specified value. This can serve as a precondition for developing warning messages and initiating a 64
Parallel big data processing system
Kotenko, Saenko, and Kushnerevich
procedure for developing countermeasures. The results of the normalization and data analysis component operation are recorded in HDFS. The data visualization component receives the resulting data from the data storage component that was generated by the data normalization and analysis component. This component provides a graphical (visual) representation of security events in accordance with the selected visualization model. The original data for visualization is placed in the database of the visualization component. The choice of a specific visualization model is made by the security administrator. The output data representation about security events and incidents is used by the administrator to make decisions about the IoT network security. For example, Fig. 3 shows the “Matrix” visualization model.
Figure 3: “Matrix” visualization model The “Matrix” model is a non-standard model. It was specially developed for the distributed processing system. The matrix displays the security level of communications connecting the elements of the IoT network. The columns and rows of the matrix correspond to the nodes of the network. The cells correspond to the communication lines connecting these nodes. Using the color and brightness of the matrix cells, we can encode any two characteristics. In Fig. 3 we encoded “degree of danger” with color and “importance” with brightness.
4
Implementation
Two versions of the system architecture were developed. In the first variant, it was created on the basis of Hadoop 2.6.4. The second version used Spark 1.6.1. To build the hardware platform of the computational cluster in both variants, the Supermicro X9DRL-3F motherboard with two Intel Xeon processors E52620 v2 @ 2.1 GHz on board was used. In the first version, based on the ESXi 6.0 hypervisor, seven virtual machines were created with 65
Parallel big data processing system
Kotenko, Saenko, and Kushnerevich
the operating system Ubuntu Server 14.04. Among them, there were six workers and one main virtual machine. Each machine has two threads allocated and 2 GHz processor reserved. In addition, 4 GB RAM was reserved for each virtual machine. In the second variant, the studies were performed on a set of 1.5 GB on one node with different characteristics of the machine. The task was run on the different number of threads with different machine configurations. The source code for Hadoop was compiled on a single virtual machine and copied to the other machine. The management of the computing cluster resources was carried out using the YARN (Yet Another Resource Negotiator) software. This component is part of the standard Hadoop configuration. YARN performs the task scheduler function, since it allocates Hadoop resources for the needs of the tasks being run. The YARN tool consists of a Resource Manager (RM) module and a Node Manager (NM) module. The RM module runs on the main node. The NM module operates on the work node. When a request for a task to the RM module is received, it allocates resources (creates a container) to one of the NM modules and starts the Application Master (AM) process on them. The AM process determines what resources are required for the task to be executed. It sends a request to the RM module to allocate containers on the NM modules. Next, the AM process receives information about NM modules with allocated containers for the task. The task runs on these modules. In addition, the AM process controls the routine execution of the task. If the processes are terminated prematurely, they are restarted. The NM module monitors the status of specific work nodes. It sends the information about available computing resources to the RM module. In addition, it creates and removes containers at the request of the RM module, terminates processes that go beyond the resources of the container, and periodically sends the heartbeat signals to the RM. YARN, MapReduce and Spark settings established for the experiments are given in Table 1.
Components 6*YARN
4*MapReduce
4*Spark
Table 1: Experimental settings Parameter yarn.nodemanager.resource.memory-mb yarn.scheduler.minimum-allocation-mb yarn.scheduler.maximum-allocation-mb yarn.scheduler.minimum-allocation-vcores yarn.scheduler.maximum-allocation-vcores yarn.nodemanager.vmem-pmem-ratio mapreduce.map.memory.mb mapreduce.reduce.memory.mb mapreduce.map.cpu.vcores mapreduce.reduce.cpu.vcores mapreduce.map.memory.mb mapreduce.reduce.memory.mb mapreduce.map.cpu.vcores mapreduce.reduce.cpu.vcores
Value 8096 1024 8096 1 32 2.1 1024 1024 1 1 1..8 -Xmx2g 0.35 true
An important task for preparing and conducting the experimental evaluation of the developed system was the preparation of input data streams. The following requirements were imposed on the content of the input data streams. They had to contain information of two types: • about events describing network traffic and reflecting legitimate and malicious activity; 66
Parallel big data processing system
Kotenko, Saenko, and Kushnerevich
• about events describing changes in software and hardware configurations of personal computers, network equipment and consumer devices. As a result, the input data streams were formed in two ways: using the test data generator and using the external database. The test data generator included hardware and software. The hardware comprised workstations, ASUS RT-N16 routers, Arduino Yun microprocessors and a firewall. The software included Nessus Home security scanner, Wireshark 1.12.2 traffic analysis system, NMap 6.47 network scanner, MetaSploit Framework 4.0 system and Snort 2.9.7.0 intrusion detection system. The MAVILab database was used as the external database of experimental network traffic data (http://www.fukuda-lab.org/mawilab/index.html). This database consists of network packets in various formats (tcp, http, ftp, etc.). It describes the real network traffic that circulates between Japan and the United States. Packages contain information about various security events, including events related to computer attacks. The most common attacks that occur in this database are DoS attacks, port scanning, TCP network scanning, UDP scan of the network, ICMP network scanning, and others. Each file included in the external database has the *.pcap format and corresponds to network traffic of 15 minutes. The use of an external database enabled the inclusion of events describing real network traffic and reflecting legitimate and malicious activity in the input data streams. This made it possible to check the developed system under conditions that are as close as possible to the real operating conditions of the system.
5
Experimental results
The experimental evaluation of the developed system was carried out to determine the processing speed, depending on the volumes of the input data streams and other characteristics of the system. The analysis of the input data streams was carried out on the basis of given rules. In particular, the following statement was used as one of these model rules: “the security event about port scanning is registered only if packets have been sent to more than 10 ports from the same IP address to another IP address, and each port had received less than 5 packets”. This rule can be specified as follows: Es = {e ∈ E | (portse > 10) ∧ (packetse < 5)}, where e – an event from the set of events E, portse – the number of ports scanned on the destination IP, packetse – the number of packets sent to the corresponding port, Es – a set of scan events found. In this case, an aggregation was performed over the src ip field of the TCP packet header, which determines the IP address of the source. On Hadoop the developed test program for data analysis contained four MapReduce tasks (Fig. 4). Two tasks fulfilled the rules. Two tasks performed the aggregation function. The solution of the problem of analysis according to the rule was carried out in two stages. At the first stage, the triplet (src ip, dst ip, dst port) was selected from the entire tcp-header in the Map phase. It was used as a key. The value was “1” in this case. As a result, the number of packets that came to the selected port of the recipient’s IP address from the source’s IP address was calculated in the Reduce phase, when adding values. In this case, according to the condition of the task, only those key-value pairs were included in the output file, where the sum of packets arriving at the port was less than five. In the second phase of the analysis, the (src ip, dst ip) pair was selected as the key in the Map phase. The value of count(), which determines the number of packets received on the port, was sent as a value. The Reduce phase calculates the number of values for each key. It turned out to be equal to the number 67
Parallel big data processing system
Kotenko, Saenko, and Kushnerevich
of ports to which packets were sent from the outgoing IP address to the IP address of the recipient. According to the condition of the task, if the number of ports is more than 10, then the key and the number of ports were written to the output file.
Figure 4: MapReduce tasks for Hadoop data analysis Aggregation was also carried out in two stages along one of the tcp-header fields (Fig. 5). For example, for the src ip field in the first step in the Map phase, the key was the src ip field. The value was “1”. In the Reduce phase, by adding the key values, it was calculated how many occurrences the certain src ip field had in the source logs. At the second stage in the Map phase, the key-value pair was used as a value, and the key itself was left blank. In the Reduce phase, we searched for the maximum, minimum, and average value of src ip occurrences.
Figure 5: MapReduce tasks for Hadoop data aggregation For Spark, we used the filtering function for a similar set of rules, performing the same task as in the case of Hadoop (Fig. 6). The task was run on a different number of threads with the following virtual machine configurations. The machine had a memory of 80 GB HDD and 16 GB RAM. The test set had a capacity of 1.5 GB (3 files of 512 MB or 48 blocks of 32 MB). The speed of reading from the disk was 20-150 MB/s (avg. 110 MB/s). The processing speed of the block varied from 1500 to 3200 ms. During experimental studies, the processing times of the input data streams were repeatedly measured. This time depended on the amount of input files and the number of working machines included in the computing cluster. The volume of input files changed in the range from 0.5 to 3 GB. The number of machines in the cluster was 3, 5, or 7 units. The results of the experimental evaluation of the processing time of the input data streams, depended on the load volume and the number of nodes in the computational cluster, are presented in Table 2 (for 68
Parallel big data processing system
Kotenko, Saenko, and Kushnerevich
Figure 6: CEP operator chain for Spark data analysis Hadoop) and Table 3 (for Spark). The “clean” load processing time was taken into account without considering the setting. The experimental estimates were calculated as the average values obtained for 50 runs. Table 2: Experimental results on the Hadoop Input load Processing time, sec Performance, 103 events/sec Volume, GB Events, 106 3 nodes 5 nodes 7 nodes 3 nodes 5 nodes 7 nodes 0.5 0.9 76.41 61.85 51.65 11.48 14.18 16.98 1.0 1.8 135.98 106.38 102.00 12.90 16.49 17.20 1.5 2.6 208.18 161.35 158.93 12.64 16.31 16.56 2.0 3.5 322.28 202.32 179.05 10.89 17.34 19.60 2.5 4.4 409.81 259.08 210.91 10.70 16.93 20.80 3.0 5.3 522.3 357.98 245.12 10.08 14.70 21.47
Table 3: Experimental results on the Spark The number of threads 1 thread 2 thread 3 thread 4 thread 5 thread 6 thread 7 thread 8 thread
4core (2x2) 6144 GHz (1.5 GHz x 4) 92.55 sec 41.93 sec 38.22 sec 38.15 sec -
6core (2x3) 9216 GHz (1.5 GHz x 6) 91.77 sec 47.11 sec 28.28 sec 24.42 sec 23.62 sec 23.77 sec -
8core (2x4) 12288 GHz (1.5 GHz x 8) 89.23 sec 44.03 sec 29.14 sec 21.72 sec 18.44 sec 16.68 sec 16.52 sec 16.58 sec
69
6core (2x3) 12288 GHz (2.0 GHz x 6) 91.92 sec 42.62 sec 27.95 sec 21.64 sec 19.35 sec 18.01 sec -
8core (1x8) 12288 GHz (1.5 GHz x 8) 85.88 sec 42.58 sec 29.21 sec 22.5 sec 17.76 sec 17.26 sec 16.23 sec 16.58 sec
8core (1x8) 8192 GHz (1.0 GHz x 8) 86.14 sec 43.71 sec 29.87 sec 27.73 sec 26.84 sec 25.3 sec 25.14 sec 24.41 sec
Parallel big data processing system
Kotenko, Saenko, and Kushnerevich
Fig. 7 shows the dependencies of the processing time of input data on the number of virtual machines in a computational cluster for the case of using Spark. From analysis of these results, it should be noted that they completely correspond and even exceed the results obtained in other known works. In particular, experimental estimates for the Hadoop system were also obtained in [12], in which the number of nodes in the cluster was 3, 5, or 7. In this system, the data processing rate ranged from 103 to 104 events per sec. In our system, the integrated performance was in the range from 104 to 2.1 * 104 events per sec. This allows us to say that the performance of the developed system is not worse, but even better than for known systems, despite the presence of computational limitations inherent in IoT networks. Let us compare the performance of Hadoop and Spark according to the results of tests on a data set equal to 1.5 GB. Hadoop shows the time 258...328 sec in different configurations. For this task, Spark showed a time of 16. . . 93 sec. It should be noted that to create seven virtual machines in the cluster for Hadoop it was allocated 14 GHz. When testing using Spark, a maximum of 12.3 GHz was used.
Figure 7: Experimental results on the Spark Considering the results of tests, we can say that utilization of last two threads of the virtual machine does not give a significant increase in performance for Spark. This is because the operating system itself uses 1.5. . . 2 threads for its own needs. In addition, it should be noted that the number of virtual sockets does not affect the performance of the system. It can be seen from columns 3 and 5 of Table 3. The configurations in these columns are, in first case, two virtual sockets for 4 threads (2x4) and, in the second case, there was one socket with 8 threads (1x8). The processing times in both cases are practically the same. Reducing the power of one stream from 1.5 GHz to 1.0 GHz (columns 5 and 6) gives a logical reduction in performance by 33% only if more than half of all threads are used. The same picture is observed in case of increasing the power of the thread from 1.5 GHz to 2.0 GHz (columns 2 and 4). 70
Parallel big data processing system
Kotenko, Saenko, and Kushnerevich
An increase in performance by 33% occurs only when more than half of the threads are running. Such strange behavior on a low threads number is due to the peculiarity of the hypervisor’s work, which redistributes the resources given out to the machine to the loaded threads. Comparative assessment of the characteristics of the system developed with the ones of the systems closest by the solvable tasks is provided in Table 4.
Table 4: Comparative assessment of results 2*Considered systems Vehicles Traffic Management System [12] Experimental system SASE++ [16] Medical information analysis System [10] Our system
Configuration of the computing platform Hadoop, Storm, and Esper; 3, 5 or 7 VMs in the virtual cluster Hadoop, optimizer Hadoop Hadoop, Spark; 3, 5 or 7 VMs in the virtual cluster
Throughput of big data processing From 7 ∗ 104 to 9 ∗ 104 tuples per second From 30 ∗ 104 to 700 ∗ 104 events per second Up to 12K events per second Hadoop: from 1.1 ∗ 104 to 2.1 ∗ 104 events per second; Spark: from 27 ∗ 104 to 150 ∗ 104 events per second
2*Solved tasks Controlling the movement of urban passenger vehicles Sequencing lists Medical data analysis Security monitoring in the Internet of Things networks
The characteristics presented in Table 4 show that the experimental results are in full agreement with the results of other systems. At the same time, it can be seen that Spark demonstrates much higher performance than Hadoop on similar tasks. This is because Spark uses memory more efficiently and stores intermediate data in RAM. In turn, Hadoop writes the resulting data to the hard disk after each Map and Reduce operations. Continuous interaction with the hard drive creates significant time delays for Hadoop. However, the advantage of Spark quickly disappears under decreasing the amount of RAM allocated.
6
Conclusion
In this paper, we proposed a new approach for creating IoT network security monitoring system based on the principles of parallel processing of security events data. According to this approach, the network security monitoring system is implemented on Hadoop or Spark platforms as a system for parallel processing of Big Data. The architecture of the developed system of this type includes the components responsible for data collection, storage, aggregation, normalization, analysis and visualization. Data aggregation, normalization, analysis and visualization are carried out “on-the-fly”. The data is stored in a HDFS distributed file system, which increases the reliability of storage and the speed with which data requests are processed. The implementation of the system was performed taking into account the computational limitations inherent in IoT networks. To carry out the experimental evaluation, input streams were obtained by combining the streams that generate security events on a fragment of the IoT network with the streams represented in the external database of traffic in a real computer network. Experimental evaluation of the developed system showed that, despite the availability of limitations in computing resources, when it is implemented on Hadoop, the system has a fairly high performance, comparable, and in some cases significantly exceeding known implementations. When implemented on Spark, the system increases its performance by about ten times, if it has a sufficient amount of RAM. 71
Parallel big data processing system
6.1
Kotenko, Saenko, and Kushnerevich
Future Work
Future studies are directed to the application of the machine learning algorithms to network security monitoring based on big data distributed processing systems. It is also planned to study the possibility of using the Flink distributed processing system.
Acknowledgments The work is performed by the grant of RSF #15-11-30029 in SPIIRAS.
References [1] I. Saenko, I. Kotenko, and A. Kushnerevich, “Parallel Processing of Big Heterogeneous Data for Security Monitoring of IoT Networks,” in Proc. of the 25th Euromicro International Conference on Parallel, Distributed and Network-Based Processing (PDP’17), Saint-Petersburg, Russia. IEEE, March 2017, pp. 329–336. [2] I. Kotenko, “Active Vulnerability Assessment of Computer Networks by Simulation of Complex Remote Attacks,” in Proc. of 2003 International Conference on Computer Networks and Mobile Computing (ICCNMC’03), Shanghai, China. IEEE, October 2003, pp. 40–47. [3] I. Kotenko, “Agent-Based Modeling and Simulation of Cyber-Warfare between Malefactors and Security Agents in Internet,” in Proc. of the 19th European Simulation Multiconference “Simulation in wider Europe” (ESM’05), Riga, Latvia, June 2005, pp. 533–543. [4] D. Miller, S. Harris, A. Harper, S. VanDyke, and C. Black, Security Information and Event Management (SIEM) Implementation. McGraw–Hill Companies, 2010. [5] I. Kotenko, A. Chechulin, and E. Novikova, “Attack Modelling and Security Evaluation for Security Information and Event Management,” in Proc. of the 2012 International Conference on Security and Cryptography (SECRYPT’12), Rome, Italy, July 2012, pp. 391–394. [6] I. Kotenko and A. Chechulin, “Common Framework for Attack Modeling and Security Evaluation in SIEM Systems,” in Proc. of the 2012 IEEE International Conference on Green Computing and Communications(GreenCom’12), Besancon, France. IEEE, November 2012, pp. 94–101. [7] Apache, “Hadoop 3.0.0-alpha4,” http://hadoop.apache.org/docs/current [Online; Accessed on November 17, 2017]. [8] A. Holmes, Hadoop in Practice. Manning Publications Co. Greenwich, 2012. [9] O. de Carvalho, E. Roloff, and P. O. A. Navaux, “A Survey of the State-of-the-art in Event Processing,” in Proc. of the 11st Workshop on Parallel and Distributed Processing (WSPPD’13), Porto Alegre, Rio Grande do Sul, Brazil, August 2013. [10] M.-J. Kim and Y.-S. Yu, “Development of Real-time Big Data Analysis System and a Case Study on the Application of Information in a Medical Institution,” International Journal of Software Engineering and Its Applications, vol. 9, no. 7, pp. 93–102, July 2015. [11] M. Scherbakov, D. Kachalov, V. Kamaev, N. Scherbakova, A. Tyukov, and S. Strekalov, “A Design of Web Application for Coomplex Event Processing Based on Hadoop and Java Servlets,” International Journal of Soft Computing, vol. 10, no. 3, pp. 218–219, May-June 2015. [12] N. Zygouras, N. Zacheilas, V. Kalogeraki, D. Kinane, and D. Gunopulos, “Insights on a Scalable and Dynamic Traffic Management System,” in Proc. of the 18th International Conference on Extending Database Technology (EDBT’15), Brussels, Belgium. OpenProceedings.org, March 2015, pp. 653–664. [13] M. Cherniacka, H. Balakrishnan, M. Balazinska, D. Carney, U. Cetintemel, Y. Xing, and S. Zdonik, “Scalable Distributed Stream Processing,” in Proc. of the 1st Biennial Conference on Innovative Data Systems Research (CIDR’03), Monterey, California, USA, vol. 3. ACM, January 2003, pp. 257–268. [14] A. Moraru and D. Mladeni´c, “Complex Event Processing and Data Mining for Smart Cities,” in Proc. of the 15th International Conference on Data Mining and Data Warehouses (SiKDD’12), Ljubljana, Slovenia, October 2012.
72
Parallel big data processing system
Kotenko, Saenko, and Kushnerevich
[15] N. Schultz-Møller, M. Migliavacca, and P. Pietzuch, “Distributed Complex Event Processing with Query Rewriting,” in Proc. of the 3rd ACM International Conference on Distributed Event-Based Systems (DEBS’09), Nashville, Tennessee, USA. ACM, July 2009, pp. 4:1–4:12. [16] H. Zhang, Y. Diao, and N. Immerman, “On Optimization of Expensive Queries in Complex Event Processing,” in Proc. of the 2014 ACM SIGMOD International Conference on Management of Data (SIGMOD’14), Snowbird, Utah, USA. ACM, June 2014, pp. 217–228. [17] D. Liu, C. Pedrinaci, and J. Domingue, “A framework for feeding Linked Data to Complex Event Processing engines,” in Proc. of the 1st International Workshop on Consuming Linked Data (COLD’10), Shanghai, China, ser. CEUR Workshop Proceedings, vol. 665. CEUR-WS.org, November 2010. [18] D. Anicic, S. Rudolph, P. Fodor, and N. Stojanovic, “Stream reasoning and complex event processing in ETALIS,” Semantic Web, vol. 3, no. 4, pp. 397–407, October 2012. [19] D. Gyllstrom, H.-J. C. E. Wu, Y. Diao, P. Stahlberg, and G. Anderson, “SASE: Complex Event Processing over Streams,” https://arxiv.org/ftp/cs/papers/0612/0612128.pdf [Online; Accessed on November 17, 2017], 2006. [20] V. Gulisano, R. Jimenez-Peris, M. Patino-Martinez, and P. Valduriez, “StreamCloud: A Large Scale Data Streaming System,” in Proc. of the 2010 International Conference on Distributed Computing Systems (ICDCS’10), Genoa, Italy. IEEE, June 2010, pp. 126–137. [21] V. Gulisano, R. Jimenez-Peris, M. Patino-Martinez, C. Soriente, and P. Valduriez, “StreamCloud: An Elastic and Scalable Data Streaming System,” IEEE Transactions on Parallel and Distributed Systems, vol. 23, no. 12, pp. 2351–2365, December 2012. [22] D. Wang, E. Rundensteiner, and R. E. III, “Active Complex Event Processing over Event Streams,” Proceedings of the VLDB Endowment, vol. 4, no. 10, pp. 634–645, July 2011. [23] I. Kotenko and I. Saenko, “An Approach to Aggregation of Security Events in Internet-of-Things Networks Based on Genetic Optimization,” in Proc. of the 16th IEEE International Conference on Scalable Computing and Communications (ScalCom’16), Toulouse, France. IEEE, July 2016, pp. 657–664. [24] K. Dwivedi and S. Dubey, “Analytical review on Hadoop Distributed file system,” in Proc. of the 5th International Conference on Confluence the Next Generation Information Technology Summit (Confluence’14), Noida, India. IEEE, November 2014, pp. 174–181.
——————————————————————————
Author Biography Igor Kotenko graduated with honors from St.Petersburg Academy of Space Engineering and St. Petersburg Signal Academy. He obtained the Ph.D. degree in 1990 and the National degree of Doctor of Engineering Science in 1999. He is Professor of computer science and Head of the Laboratory of Computer Security Problems of St. Petersburg Institute for Informatics and Automation. He is the author of more than 350 refereed publications. Igor Kotenko has a high experience in the research on computer network security and participated in several projects on developing new security technologies. For example, he was a project leader in the research projects from the US Air Force research department, via its EOARD (European Office of Aerospace Research and Development) branch, EU FP7 and FP6 Projects, HP, Intel, F-Secure, etc. The research results of Igor Kotenko were tested and implemented in more than fifty Russian research and development projects. The research performed under these contracts was concerned with innovative methods for network intrusion detection, simulation of network attacks, vulnerability assessment, security protocols design, verification and validation of security policy, etc. He has chaired several International conferences and workshops, and serves as editor on multiple editorial boards. 73
Parallel big data processing system
Kotenko, Saenko, and Kushnerevich
Igor Saenko graduated with honors from St. Petersburg Signal Academy. He obtained the Ph.D. degree in 1992 and the National degree of Doctor of Engineering Science in 2001. He is Professor of computer science and Leading Researcher of the Laboratory of Computer Security Problems of St. Petersburg Institute for Informatics and Automation. He is the author of more than 200 refereed publications and participated in several Russian and international research projects. His main research interests are security policy management, access control, management of virtual computer networks, database management, knowledge modeling, soft and evolutionary computation, information and telecommunication systems. Alexey Kushnerevich graduated from St. Petersburg Electrotechnical University in 2017. He is Junior Researcher of the Laboratory of Computer Security Problems of St. Petersburg Institute for Informatics and Automation. He is the author of 10 refereed publications and participated in several Russian and international research projects. His main research interests are security, data analysis, big data, distributed data processing systems.
74