Parallel implementation and performance of fastDNAml - a program for maximum likelihood phylogenetic inference Craig A. Stewart1, David Hart1, Donald K. Berry1, Gary J. Olsen2, Eric A. Wernert1, William Fischer3 1
University Information Technology Services, Indiana University, Bloomington IN 47408 {stewart, dhart, dkberry, ewernert}@indiana.edu
2
Department of Microbiology, University of Illinois Urbana/Champaign, Urbana, IL 61801
[email protected] 3
Department of Biology, Indiana University, Bloomington IN 47405
[email protected]
Abstract
1. Introduction
This paper describes the parallel implementation of fastDNAml, a program for the maximum likelihood inference of phylogenetic trees from DNA sequence data. Mathematical means of inferring phylogenetic trees have been made possible by the wealth of DNA data now available. Maximum likelihood analysis of phylogenetic trees is extremely computationally intensive. Availability of computer resources is a key factor limiting use of such analyses. fastDNAml is implemented in serial, PVM, and MPI versions, and may be modified to use other message passing libraries in the future. We have developed a viewer for comparing phylogenies. We tested the scaling behavior of fastDNAml on an IBM RS/6000 SP up to 64 processors. The parallel version of fastDNAml is one of very few computational phylogenetics codes that scale well. fastDNAml is available for download as source code or compiled for Linux or AIX.
A phylogenetic tree is a depiction of the course of evolution. The development of objective means for inferring phylogenetic trees is an important problem in evolutionary theory and bioinformatics. While not likely to have the same impact on human health as some other areas of bioinformatics [e.g. 1], phylogenetic inference can be of value in applied settings such as understanding of disease [2]. Advances in the availability of DNA sequence data and mathematical methods have given rise to several techniques for analyzing relationships among organisms, genes, and gene products. Maximum likelihood techniques are the most computationally intensive of these methods. The limiting factor in application of maximum likelihood methods to phylogenetic inference is availability of computing resources and the application of parallel programming techniques to make possible the completion of analyses in reasonable amounts of wall clock time. One wellestablished and commonly used code for maximum likelihood phylogenetic inference is fastDNAml [3,4] developed by Olsen and coworkers and based on Felsenstein’s DNAml [5] in the PHYLIP package.
Keywords Phylogenetics, bioinformatics, maximum likelihood, parallel applications, scalability
The purposes of this paper are to explain why phylogenetic inference is a high performance computing (HPC) problem, describe the current parallel implementation of fastDNAml, and test the scalability of fastDNAml.
Permission to make digital or hard copies of all or part of this work for personal or classroom use is granted without fee provided that copies are not made or distributed for profit or commercial advantage, and that copies bear this notice and the full citation on the first page. To copy otherwise, to republish, to post on servers or to redistribute to lists, requires prior specific permission and/or a fee. SC2001 November 2001, Denver 2001 ACM 1-58113293-X/01/0011 $5.00
1
For 50 taxa the number of possible trees is 2.8 x 1074; for 100 taxa, 1.7 x 10182; and for 150 taxa, 4.2 x 10301. Evaluation of each tree involves many calculations per base pair, and sequences hundreds of base pairs in length are commonly used. Sequences from more than 50,000 species, totaling nearly 12 billion base pairs, are already available within GenBank [8], and the Ribosomal Database Project provides sequence data for over 5,000 eucaryotic organisms [9]. The Tree of Life project [10] aims to present evolutionary information about all forms of life. Thus the availability of many genetic sequences has generated interest in analyzing very large trees. The larger data sets used in the performance analysis presented in this paper (101 and 150 taxa, respectively) are currently being used in biological research at Indiana University.
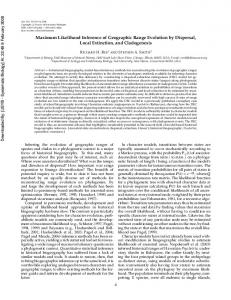
1.1 Why is phylogenetic inference an HPC problem? Phylogenetic trees depict the relatedness of groups of genes, gene products, or taxa (species or other taxonomic groupings of organisms). The same techniques are applicable to all, so we will refer simply to “taxa.” Evolutionary change may be modeled as a process that proceeds by a series of bifurcations: species A gives rise to a new species B, and both move forward in time (unless/until one or both go extinct). Phylogenies are thus bifurcating trees. When inferring phylogenies from DNA sequences, there is no way of knowing (without adding external data) which point in the tree is the most primitive. Thus the trees produced by mathematical methods are unrooted bifurcating trees, as shown in Figure 1. (The process of identifying a root for such a tree is a separate process that takes place after determination of the best unrooted tree.)
The availability of large sets of genetic sequence data makes possible the use of mathematical techniques for inferring phylogenies. However, for anything other than small trees, the nature of the problem prohibits an exhaustive approach to finding the best tree. The problem of searching for the best tree is NP-complete [11]. The process of finding the best tree describing the relationships among many taxa is thus a problem that requires use of large amounts of computing resources and techniques other than exhaustive comparisons.
2. Phylogenetic inference from DNA sequences and the fastDNAml algorithm Phylogenetic inference with fastDNAml is based on a Figure 1. An unrooted bifurcating tree describing the phylogenetic relationships among model of the molecular basis cytoplasmic coat proteins [6]. for evolutionary change. Genetic changes occur when one of the DNA bases (cytosine, thymine, guanine, Given n taxa, the number of possible different adenine) in a genetic sequence is not copied identically bifurcating unrooted trees is [7]: from one generation to the next, or when bases are added to or deleted from the genetic sequence. The (2n-5)! bases at each position in a DNA sequence may (as a -----------(n-3) good first approximation) be considered to be 2 (n-3)! independent, and genetic change may be modeled as a Markov process [5]. The Markov matrix can be estimated empirically and is adjusted at each sequence
2
Each of the new trees that results from rearrangement is dispatched to a worker process, which calculates the branch lengths and the overall likelihood value. The trees, branch lengths, and likelihood values are returned to the main program. If one or more of the trees resulting from these rearrangements has a higher likelihood value than the original tree, then the best of these trees is used as a starting point for another round of rearrangements. This process continues until the rearrangements no longer result in improvement of the likelihood value. The best tree obtained in this step is used as a starting point for the addition of another new taxon in step 3, until all of the taxa save the last have been added. 5) The last taxon is added to the tree, and then a more extensive rearrangement of the tree may be performed. This step is identical to the nondefault behavior available in step 4. (The user may specify different numbers of vertices to be crossed in steps 4 and 5.) Each distinct new tree is dispatched to a worker process. The worker processes return a tree with recalculated branch lengths and associated likelihood value. This process is repeated until rearrangement no longer improves the likelihood value. The resulting tree and its associated likelihood value are then kept as the result of this particular random ordering of taxa.
position to account for differences between loci in propensity to show genetic changes. One program that performs such estimations is Olsen’s DNArates [4]. The objective of maximum likelihood phylogenetic inference is to find the phylogenetic tree that has the highest overall likelihood value, given the sequences of the taxa being studied and the estimated likelihoods for changes in DNA. Maximum Likelihood (ML) methods are the most computationally intensive of the several approaches to phylogenetic inference currently in use [12]. Because an exhaustive search of all possible tree topologies is not possible for anything other than a very few taxa, fastDNAml takes an incremental searching approach to tree building [3]. The basic method is as follows. An initial tree is created using three taxa chosen at random. The lengths of the branches of the tree are calculated (proportional to the genetic differences among the three taxa) along with a likelihood value for the tree. Next, another taxon is chosen at random. This taxon is added to the tree at each possible place. The branch lengths of each new tree are calculated, as is an overall likelihood value. The best tree resulting from this step is used as the basis for adding another taxon. This process then continues incrementally, creating a tree that includes all taxa being analyzed. A more detailed explanation of the steps in the algorithm is as follows:
Because it is possible to become trapped in a local optimum, rather than a global one, this entire process is repeated with different randomizations of the order of taxa. A biologist might typically analyze tens to thousands of different randomizations, and then compare the best of the resulting trees to determine a consensus tree [13, 14].
1) Place the taxa in a random order. 2) Create an initial tree. A bifurcating tree (only one topology is possible) is created from the first three of the randomly ordered taxa. The branch lengths and overall likelihood value are calculated. 3) Add another taxon to the existing tree. The next taxon in the random ordering is added to the tree in each topologically distinct place. As an ith taxon is being added to a tree, there are (2i-5) possible new trees. Each new tree is dispatched to a worker process, which calculates the branch lengths and the overall likelihood value. The trees, branch lengths, and likelihood values are returned to the main program. The tree with the best likelihood value is retained. 4) Perform local rearrangements. Starting with the best tree resulting from step 3, a number of new trees are created by moving the position of every subtree across one or more internal nodes of the tree. By default one internal node is crossed, in which case (2i-6) topologically different trees result. A new, nondefault feature makes it possible to specify more extensive rearrangements at this step. Subtrees may be exchanged by crossing more than one vertex, up to the entire span of the tree.
This algorithm is well suited for parallelization. At any step, the evaluation of any particular tree can happen independent of the evaluation of others. The analysis of an individual tree has a high computation to communication ratio. The optimization of any particular tree is computationally intensive, and the only communication required between the controlling process and the processes evaluating trees is the dispatching of a tree and the return of the tree with its calculated branch lengths and likelihood value. In the tests described later in this paper, for example, there were hundreds of thousands of floating point operations performed in the analysis of a particular tree per byte of data transmitted back to the main program.
3
portions of the program, and the fact that the implicit barriers created by the comparison of all trees at various steps are loosely synchronized. This loose synchronization is the result of variation among trees in the number of calculations required to compute branch lengths and likelihood values.
2.1 Recent changes to fastDNAml Since its original publication [3], several changes have been made in fastDNAml: • Default options have been changed to provide a reasonable analysis with a minimal PHYLIP format DNA (or RNA) sequence file. • The base composition of the data is used as the equilibrium base frequencies. • A rapid approximation of the insertion point is used, since it is then tested more carefully for the effects of rearrangement. • Even-valued user-supplied random number seeds are adjusted so that they use the maximum period of the generator. • Limitations on the number of taxa, alignment length and number of user trees have been removed. • The original data structures were changed to consolidate the likelihood information about a vertex in a single array of structures, so that different molecule types or models of evolutionary change can be encapsulated in changes to the structures and the routines that process them. • The conditional likelihoods (the probability of the data in a given alignment column given the tree and model) have been normalized to prevent floating point underflow in the case of very large trees (and/or bad models and bad trees).
Figure 2. Parallel program flow of fastDNAml. The worker processes vary in number depending upon availability of processors.
A schematic flowchart of the parallel algorithm for fastDNAml is shown in Figure 2. Note that the program is not organized as a tree code (e.g. [15]). Rather, at each step of the process, the trees to be evaluated are distributed to the available workers until each worker has received a tree. Each worker returns its tree, with newly calculated branch lengths and likelihood value, to the main program as soon as calculations are completed. The worker then receives a new tree, for a new set of calculations, from the main program. fastDNAml is available both in serial and parallel forms. The worker process acts as a subroutine in the serial version of fastDNAml. In the parallel form there are three core processes and a variable number of worker processes, depending upon the total number of processors available. The factors limiting the scalability of this algorithm are the relatively few serial
2.2 Parallel implementation of fastDNAml The parallel version of fastDNAml is implemented in PVM and MPI. The parallel program consists of four modules: • master. This routine generates and compares trees. It generates new tree topologies (in steps 2-5 above) and sends these trees to the foreman. It receives back from the foreman the best tree at the end of each round of comparison. • foreman. This routine dispatches trees to worker processes for analysis, receives back trees and their associated likelihood values, and compares
4
•
•
the likelihood values to determine which tree has the highest likelihood value at any given step. The foreman manages this process via a work queue and a ready queue. The work queue includes a record of the tree dispatched to each worker and the time the tree was dispatched (used to implement fault tolerance, explained below). worker. These are the worker processes that, in parallel, calculate branch lengths for a tree topology and the likelihood value for the tree. The worker processes communicate only with the foreman process. monitor. This is an optional process that provides instrumentation for the program.
3. Performance analysis of fastDNAml The scaling of fastDNAml was analyzed using datasets including 50, 101, and 150 taxa. These datasets were used by one of the authors (Fischer) in biological research about the evolutionary relationships of Microsporidia. Microsporidia are a medically and economically important group of single-celled parasites that infect humans and other animals. Sequence alignments were obtained from the European SmallSubunit Ribosomal RNA Database [16]; ambiguously aligned regions were removed to yield alignments of 1858 positions (50- and 101-sequence datasets) and of 1269 positions (150-sequence dataset).
The fully instrumented parallel version of fastDNAml requires a minimum of four processors. The present implementation of fastDNAml has two particularly useful features: • Calls to any message passing libraries are sequestered in a single file (one each for serial, PVM, and MPI implementations). For example, all calls to the MPI library are kept in comm_mpi.c. The program modules communicate via subroutines defined in these files. Makefiles handle the integration of the proper file defining serial communications, PVM calls, or MPI calls when creating an executable. This keeps the code, other than the communications definition files, independent of any particular message passing library. This greatly simplifies code management, and will make it easier to implement fastDNAml using other parallel programming protocols in the future. • fastDNAml includes fault tolerance features, such as a user-specified timeout parameter. If an individual worker process fails to return an evaluated tree within the time specified, that particular worker is removed from the list of available workers, and the tree that had been dispatched to that worker is sent to a different worker. If at some later time a response is received from the delinquent worker, then that worker is added back into the list of workers available to analyze trees. This is of value in geographically distributed use of the PVM version [6] and in using the MPI version on Linux clusters.
3.1 Test conditions The performance of fastDNAml was tested on Indiana University’s IBM RS/6000 SP [17], using the serial version as a baseline for uniprocessor performance, and the MPI version for parallel implementations using 4 to 64 processors (increasing by factors of 2). The number of tree vertices to be crossed in the local rearrangement step and the final branch-swapping step (steps 4 and 5 above) was set to 5. The setting for the number of vertices crossed has a significant impact on the total computation time, and affects the thoroughness of the search for better trees. Five vertices is the typical setting used in practice by biologists at Indiana University, and was thus chosen for the test conditions here. fastDNAml was run on Power3+ high nodes within a single RS/6000 SP frame, connected by a SP Switch2. The high nodes were each equipped with 8 GB of memory and 16 Power3+ chips (375 MHz). Ten different random orderings were analyzed for each size data set (50,101, 150 taxa). The number of calculations and trees actually analyzed varies from one random ordering to another. For each data set, the same ten randomizations were analyzed for each number of processors so that the scaling behavior of the program could be clearly understood.
3.2 Code Scalability
The ability to utilize large numbers of worker processes has been dramatically improved since the initial publication [3] by fixing a bug in the parallel code that caused the master process to reevaluate the likelihood of trees returned by the workers.
One of the critical questions about any parallel program is the extent to which it scales to run efficiently on large numbers of processors. The scaling behavior of fastDNAml is shown in Figures 3 and 4.
5
1,000,000
100,000
10,000
1,000
100
10
1 0
10
20
30
40
50
60
70
Number of Processors 50 Taxa
101 Taxa
150 Taxa
Figure 3. Time to complete analysis of phylogenetic trees of three datasets (50, 101, and 150 taxa respectively). Each data point is an average of ten orderings of taxa.
70 60 50 40 30 20 10 0 0
10
20
30
40
50
60
70
Number of Processors Perfect Scaling
50 Taxa
101 Taxa
150 Taxa
Figure 4. Scaling ratios of analysis of phylogenetic trees of three datasets (50, 101, and 150 taxa respectively). Each data point is an average of ten orderings of taxa.
6
Scaling results are presented in the most conservative fashion possible, using the serial version of the code as the basis for comparison. The parallel version includes two modules dedicated to the control of the program and a third module dedicated to monitoring tasks. The dedication of three processors to control and monitoring tasks keeps the scalability well below perfect. In particular, the overhead of communications and processing tasks causes the parallel code running on four processors to be slower than the serial code running on one processor. In both cases just one processor is devoted to the worker process (optimizing and analyzing trees). However, the relative speedups from 16 through 64 processors are quite good as the importance of the processors dedicated to parallel control and monitoring becomes less significant. The other factor that limits scalability is the implicit barrier created by the determination of the best tree at each round of tree optimization. This barrier is loosely synchronized, due to the fact that different trees may take different amounts of time to optimize. The scalability of the code depends somewhat on the setting of the number of vertices to be crossed in the tree rearrangement steps. Setting the number of vertices crossed to one, for example, decreases the efficiency of scalability because there is a smaller total amount of work done between synchronizations. Increasing the number of vertices to be crossed would improve the scaling behavior. We have tested the scalability of the code using the settings chosen in practice by biologists at Indiana University.
version of DNAml is implemented in PVM, and is thus perhaps less easily portable today than our implementation. Both the current parallel version of fastDNAml and Ceron’s parallel version of DNAml improve efficiency of the parallel code by calculating in advance the list of trees to be dispatched to workers. The current parallel version of fastDNAml includes options for more extensive rearrangement of trees than Ceron's. Ceron’s implementation includes an interesting feature not included in the current version of fastDNAml. Ceron’s parallel DNAml implementation performs speculative calculations based on the relatively low probability of a local rearrangement improving the likelihood value and producing a new best tree. We have not studied the runtime behavior of our implementation of fastDNAml, with its greater flexibility in the rearrangement step, to see if such a feature would enhance the scalability of the parallel version of fastDNAml. We plan to do so. Ceron et al. depict scalability of their parallel code that is not quite as efficient as we have shown here for fastDNAml. Thus, fastDNAml is one of very few phylogenetics codes that scale well past a few processors, and to the best of our knowledge one of just two ML implementations that scales well. One of the values of fastDNAml is that it permits biologists to compare ML methods with other phylogenetic inference methods on the basis of the quality of the biological results obtained. Thus a biologist’s choice of methods is not constrained because one method cannot be completed in a reasonable amount of time.
Since the original publication of fastDNAml [3], several other programs for parallel phylogenetic analysis have been published. Some of these focus on phylogenetic methods other than maximum likelihood estimation. Snell et al. [18] discussed parallel implementation of a parsimony method for phylogenetic inference. Parsimony methods are less computationally complex than maximum likelihood methods [12]. The implementation of Snell et al. did not seem to scale beyond eight processors. Bader et al. [19] discussed GRAPPA, a highly scalable implementation of breakpoint phylogenetic analysis [20]. Roshan et al. [21] showed that there are simple Markov model-based methods that increase in time polynomially with the number of taxa studied. However, the Markov model used is substantially less detailed than the model underlying fastDNAml.
The performance results presented here raise a question about the best way to parallelize the task at hand, a question that probably applies to many phylogenetic analysis programs. The serial execution of the largest data sets considered in this paper required roughly 192 hours – a long time, but not an intolerable amount of time to wait. Since a hundred or more different random orderings of the taxa will be analyzed, why not simply run a large number of serial jobs and achieve in this manner essentially perfect scalability, rather than parallelizing the analysis of different trees within a single random ordering of taxa? There are practical and scientific reasons for parallelizing the analysis of a single random ordering of taxa. First, the practicing biologist benefits from seeing some results relatively quickly, which the approach we take provides. Unexpected or obviously pathological results might indicate a problem in the alignment of the genetic sequences in the data set. Much more importantly, however, the parallelization approach taken with fastDNAml is flexible in regards to the types of problems that can be attacked, and the type of computing environment that can be used to
Ceron et al. [22] have recently published a program for maximum likelihood phylogenetic inference which, like fastDNAml, is based on Felsenstein’s DNAml program. fastDNAml and Ceron’s parallel implementation were based on different versions of DNAml, but share many similarities. Ceron’s parallel
7
support execution of fastDNAml. The current version of fastDNAml focuses on DNA sequences. Serial execution of much larger sets of DNA sequence data would take impractically long. Furthermore, there are now available very large repositories of protein sequence data. The problem of maximum likelihood estimation based on sequences of amino acids making up proteins is computationally much more demanding than analysis of DNA sequences [5]. The parallelization approach used in fastDNAml makes it feasible to begin attacking larger phylogenies based on DNA sequences, and phylogenies based on protein sequences.
4. Visualization Once a number of different random orderings of addition of taxa have been analyzed, the actual determination of a consensus tree can be difficult. For example, one tree may be viewed as more plausible than another for biological reasons. We have developed a 3D tree viewer for fastDNAml that enables interactive comparison of many different trees [23]. This viewer is based on a core library that uses the Open Inventor [24] graphics API to convert ASCIIencoded tree files into planar 3D representations. This permits visual analysis, searching, and interaction among multiple trees in a 3D view. Two different applications have been built upon this framework.
Parallelization at the level of analysis of individual trees makes it possible to use fastDNAml in a wide variety of computing environments. An individual Intel-based workstation can analyze a single tree in a matter of a few seconds, so this fine-grained parallelism makes possible a distributed computing approach where the workers could be anything from an idle Intel-based microcomputer [e.g. 18] to an idle processor in a supercomputer on the other side of the earth, made available via a collaborative agreement because the usage is of no consequence to a ‘donor’ site [6]. Still, there will be a point where overall throughput is best achieved by simultaneously analyzing multiple orderings of taxa, each on a subset of the total number of processors available. Scalability will most likely be limited by the step in which new taxa are added to existing trees (step 3 described earlier), since the smallest number of trees are analyzed in this part of the program. For data sets similar to those analyzed in this paper, the scalability will likely fall off at between 100 and 200 processors, since the number of processors will equal or exceed the number of trees analyzed in the taxon addition step for much of the execution of the program.
One visualization application allows for real-time monitoring and analysis of computational runs of the fastDNAml algorithm. Working in conjunction with the master process, the application monitors a file representing the best tree from each iteration of the algorithm. Each time the file is updated, it is converted to a 3D representation and merged with previous time samples at the appropriate location on the time axis. Users can study the growth and refinement of the tree as taxa are added and rearranged. This viewer has a facility for tracing the position of selected taxa or subtrees among the multiple trees for more detailed monitoring and analysis. The application also supports interactive viewpoint manipulation, stereo viewing, and branch measurement. A second visualization application allows researchers to conduct more detailed off-line examinations of the final resulting trees from multiple runs of the algorithm. Any number of tree files may be loaded, converted into 3D representations, and arranged for direct visual comparison and analysis. As with the first application, this program provides the capability to trace individual taxa or groups of taxa across multiple trees. A significant addition is a feature that allows the user to pivot a subtree in order to visually distinguish solutions that are topologically different from those that only appear different because of reversed branch orderings. Figure 5 is an image from the 3D tree viewer.
8
Figure 5. 3D visualization of 10 phylogenies produced by fastDNAml. Traces have been turned on for several taxa, facilitating comparison of the trees [23].
5. Software availability and future plans
6. Conclusion
The parallel versions of fastDNAml are available under the terms of the GNU General Public License. The MPI version of fastDNAml v1.0.6 is available for free download as source code and compiled for Linux and AIX [25]. The PVM version of fastDNAml v1.0.6 is available upon request (to
[email protected]). The PVM and MPI versions of fastDNAml v1.2.2 are now undergoing final testing and will be available for download from [25] by November 2001.
Maximum likelihood analysis is the most computationally intensive approach to phylogenetic inference, but also one of the most valuable and robust. fastDNAml performs maximum likelihood phylogenetic inference based on aligned DNA sequences. The parallel version of fastDNAml is now implemented in a fashion that abstracts the particulars of the parallel communication protocols, simplifying code management and facilitating future development of versions using other parallel communication protocols. The program scales very well, with speedups nearly linear at high numbers of processors (from 16 to 64). fastDNAml is to the best of our knowledge one of just two computational phylogenetics codes that implement maximum likelihood methods and scale well past a few processors. The parallel versions of fastDNAml are available for free download under the terms of the GNU general public license [25].
Future plans for fastDNAml fall into several categories. Of highest priority is incorporating other models of sequence change. This will include protein sequences, handling of alignment gaps as another character state (rather than the current treatment as missing data), and more general models of nucleotide change. The current code design will permit these changes to be made in a relatively straightforward manner. A second area of change is greater computational efficiency. Improvements planned include a divide-and-conquer approach to placing new taxa in the tree [26], faster methods for optimizing branch lengths, adaptive extents of tree rearrangement (vertices crossed), and addition of pairwise subtree interchange as a class of tree rearrangements [27]. Incorporation of multiple addition orders and multiple bootstraps within the code is planned, but is of lower priority since this is currently available using scripts. We are also working to develop a version of the worker process for Condor flocks [28] and a Java-based screensaver version of the worker process.
Most importantly, the parallel version of fastDNAml aids scientists in performing research. The datasets used in this performance analysis are being used in ongoing biological research. The analysis of a single randomization of 150 taxa required roughly 9 days using the serial version of fastDNAml. A complete analysis of such a data set involving 200 different randomizations would at this rate take nearly five years. With 64 processors the parallel version of fastDNAml required less than four hours to analyze a single randomization of 150 taxa, or about a month running continually on 64 processors to analyze 200 randomizations. This is a dramatic reduction in time to solution.
9
information about phylogeny and biodiversity. http://phylogeny.arizona.edu/tree/phylogeny.html, accessed July 2001.
Acknowledgements Figures 1 and 2 were created by W.L. Teach. Malinda Lingwall, Richard Repasky, Allen Maloney, and two anonymous reviewers deserve great thanks for comments on earlier versions of this manuscript, thus improving its quality. Mary Papakhian greatly facilitated the running of the performance tests. This paper was supported, in part, by Shared University Research Grants from IBM, Inc. to Indiana University. This research was also supported through a grant from the Lilly Endowment to create the Indiana Genomics Initiative at Indiana University.
[11] Bodlaender, H., M. Fellows, and T. Warnow. 1992. Two strikes against perfect phylogeny. pp. 273-283 In: Proceedings of the 19th International Colloquium on Automata, Languages, and Programming, Lecture Notes in Computer Science, Springer-Verlag, NY. [12] Hershkovitz, M.A., and D.D. Leipe. 1998. Phylogenetic analysis. In: Bioinformatics: a practical guide to the analysis of genes and proteins. A.D. Baxevanis and B.F.F. Ouelette (Eds.), pp. 189-230. New York: Wiley-Liss. [13] Jermiin, L. S., G.J. Olsen, and S. Easteal. 1997. Majority rule consensus of maximum likelihood trees. Mol. Biol. Evol. 14: 1296–1302.
References
[14] Swofford, D. L., G.J. Olsen, P.J. Waddell, and D.M. Hillis. 1996. Phylogenetic inference. In: Molecular Systematics, 2nd edition D. M. Hillis, C. Moritz and B. K. Mable (Eds.), pp. 407-514 Sunderland, MA: Sinauer Associates.
[1] Joint Center for Structural Genomics. Home page, http://www.jcsg.org/, accessed May 2001. [2] Korber, B., M. Muldoon, J. Theiler, F. Gao, R. Gupta, A. Lapedes, B.H. Hahn, S. Wolinsky, T. Bhattacharya. 2000. Timing the Ancestor of the HIV-1 Pandemic Strains, http://www.sciencemag.org/cgi/content/full/288/5472/1789, accessed May 2001.
[15] Sarin, V., A. Grama, and A. Sameh. 1998. Analyzing the Error Bounds of Multipole-Based Treecodes. Proceedings of the IEEE/ACM SC98 Conference. Orlando, FL, Nov 1998.
[3] Olsen, G. J., H. Matsuda, R. Hagstrom, and R. Overbeek. 1994. fastDNAml: A tool for construction of phylogenetic trees of DNA sequences using maximum likelihood. Comput. Appl. Biosci. 10: 41-48.
[16] Van de Peer, Y., P. De Rijk, J. Wuyts, T. Winkelmans, and R. De Wachter. 2000. The European small subunit ribosomal RNA database. Nucleic Acids Research 28(1):1756.
[4] Olsen, G.J. Home page. http://geta.life.uiuc.edu/~gary/, accessed May 2001.
[17] Papakhian, M. The UITS Research SP system, http://spwww.iu.edu/, accessed May 2001.
[5] Felsenstein, J. 1981. Evolutionary trees from DNA sequences: A maximum likelihood approach. J. Mol. Evol. 17: 368-376.
[18] Snell, Q., M. Whiting, M. Clement, and D. McLaughlin. 2000. Parallel phylogenetic inference. Proceedings of the IEEE/ACM SC2000 Conference. Dallas, TX, Nov 2000.
[6] Stewart, C.A., T.W. Tan, M. Buckhorn, D. Hart, D.K. Berry, L. Zhang, E. Wernert, M. Sakharkar, W. Fischer, D.F. McMullen. 2000. Evolutionary biology and high performance computing. In: R.F. Enenkel. Software Tools for Computational Biology, http://www.cas.ibm.com/archives/1999/workshop_report/bio. html, accessed May 2001.
[19] Bader, D.A., B.M.E. Moret, T. Warnow, S.K. Wyman, and M. Yan. 2001. High-performance algorithm engineering for gene-order phylogenies. DIMACS Workshop on Whole Genome Comparison, Rutgers University. http://www.cs.utexas.edu/users/stacia/papers/dimacs.pdf, accessed May 2001.
[7] Felsenstein, J. 1978. The number of evolutionary trees. Syst. Zool. 27: 27-33.
[20] Blanchette, M., G. Bourque, and D. Sankoff. 1997. Breakpoint phylogenies. Genome Informatics 1997 (Eds: S. Miyano and T. Takagi) Universal Academy Press, Tokyo, pp. 5-34.
[8] National center for biotechnology information. Home page, http://www.ncbi.nlm.nih.gov/, accessed May 2001. [9] Maidak B.L., J.R. Cole, T.G. Lilburn, C.T. Parker Jr., P.R. Saxman, R.J. Farris, G.M. Garrity, G.J. Olsen, T.M. Schmidt, J.M. Tiedje. 2001. The RDP-II (Ribosomal Database Project). Nucleic Acids Res. 29(1):173-4
[21] Roshan, U., L. Nakhleh, J. Sun, and T. Warnow. 2001. Designing fast converging methods in phylogenetics: an experimental study. Proceedings of Intelligent Systems for Molecular Biology (ISMB) 2001, Copenhagen. http://bioinformatics.oupjournals.org/content/vol17/suppl_1/, accessed July 2001.
[10] Maddison, D.R. and W. P. Maddison. 1998. The Tree of Life: A multi-authored, distributed Internet project containing
[22] Ceron, C., J. Dopazo, E.L. Zapata, J.M. Carazo, and O. Trelles. 1998. Parallel implementation of DNAml program on
10
message-passing architectures. Parallel Computing 24: 701716.
http://www.indiana.edu/~rac/hpc/fastDNAml/index.html, accessed May 2001.
[23] Wernert, E. TreeViewer for maximum likelihood analysis of phylogenetic data, http://www.avl.iu.edu/projects/DNAml/, accessed May 2001.
[26] Hein, J. 1989. A tree reconstruction method that is economical in the number of pairwise comparisons used. Mol. Biol. Evol. 6: 669-684.
[24] Open Inventor. http://www.sgi.com/software/inventor/, accessed July 2001.
[27] Olsen, G. J. 1988. Phylogenetic analysis using ribosomal RNA. Methods Enzymol. 164: 793- 812.
[25] Hart, D. Maximum Likelihood Analysis of Phylogenetic Data,
[28] Livny, M. The Condor Project Homepage. http://www.cs.wisc.edu/condor/, accessed July 2001.
11