Integration Clustering Algorithm (PICA), a new two-stage approach for performing cluster analysis in domains where two or more heterogeneous data sources ...
Parallel Integration of Heterogeneous Genome-Wide Data Sources Derek Greene, Kenneth Bryan, and P´adraig Cunningham School of Computer Science and Informatics, University College Dublin {derek.greene,kenneth.bryan,padraig.cunningham}@ucd.ie
Abstract— Heterogeneous genome-wide data sources capture information on various aspects of complex biological systems. For instance, transcriptome, interactome and phenome-level information may be derived from mRNA expression data, protein-protein interaction networks, and biomedical literature corpora. Each source provides a distinct “view” of the same domain, but potentially encodes different biologically-relevant patterns. Effective integration of such views can provide a richer, more informative model of an organism’s functional modules than that produced on a single view alone. Existing machine learning strategies for information fusion largely focus on the production of a consensus model that reflects patterns shared between views. However, the information provided by different views may not always be easily reconciled, due to the incomplete nature of the data, or the fact that some patterns will be present in one view but not in another. To address this problem, we present the Parallel Integration Clustering Algorithm (PICA), a novel cluster analysis approach which supports the simultaneous integration of information from two or more sources. The resulting model preserves patterns that are unique to individual views, as well as those common to all views. We demonstrate the effectiveness of PICA in identifying significant patterns corresponding to functional groupings, when applied to three genome-wide datasets.
I. I NTRODUCTION In many domains there will naturally exist multiple different ways to describe the same set of data objects. For instance, we can describe open reading frames (ORFs) based on their mRNA expression profile, the physical interaction of their protein products (where applicable), or with associated terms gathered from a body of literature such as PubMed. This leads to the availability of multiple distinct representations or “views” that encode patterns relevant to the domain [5]. The question then arises, how can we integrate these representations in a way that allows us to effectively identify and explore these patterns? For some data exploration applications, we may have access to a set of views that are entirely compatible – the same patterns will occur across all views. The problem then becomes the identification of a single consensus model describing the patterns common to the views [4]. In the context of unsupervised learning, this is conceptually similar to the problem of feature-distributed ensemble clustering, which involves finding a single consensus solution by combining a set of clusterings obtained from partial views of the data [21]. In other applications, patterns may exist in some but not all of the representations available to the researcher. In addition, some data objects may be present in one view, but entirely absent from another. For instance, some ORFs in a gene expression dataset may not code for proteins, and will
therefore be absent from a related protein-protein interaction (PPI) dataset. The problem of reconciling discordant models from different views has recently been referred to as learning in “parallel universes” [3]. This concept emphasises the idea of sharing information between views in order to learn superior local models for the views, which can subsequently be combined to provide a comprehensive global model of the patterns present in the domain. An important point here is that local models produced on different views do not necessarily need to group all possible objects in the domain. In this work, we address the problem of integrating information from diverse biological data sources, with a particular focus on three commonly-used data types: gene expression microarray data, biomedical text literature, and binary protein-protein interaction networks. The concept of learning in parallel universes is relevant here, as it is clear that certain patterns (e.g. functional modules) may be evident in one data source, but not another. Another concern is that many genes will naturally belong to multiple functional groups. To address these issues, we propose the Parallel Integration Clustering Algorithm (PICA), a new two-stage approach for performing cluster analysis in domains where two or more heterogeneous data sources are available. Firstly, PICA employs multiple cumulative voting procedures [2] in parallel to aggregate a set of previously produced clusterings to produce a set of local models, one for each available view. These models are constructed in a way that supports the sharing or “mixing” of information between views. The second stage of the algorithm involves combining the local models to produce a global model, in the form of a set of overlapping clusters that preserve the patterns present in one or more of the views. We empirically investigate the effectiveness of the proposed algorithm on views provided by three yeast-related genome-wide datasets, and demonstrate its improved ability to identify meaningful patterns corresponding to functional groupings, when compared with standard clustering algorithms applied to individual views. This paper is organised as follows. Section II provides a brief overview of existing techniques for fusing data from different sources, with an emphasis on techniques previously applied to biological data. In Section III we define the parallel integration problem, and describe the proposed PICA algorithm in detail. In Section IV we present our experimental results. The paper finishes with some conclusions and suggestions for future work in Section V.
II. R ELATED W ORK A. Ensemble Clustering A variety of algorithms have been proposed to aggregate a collection of different clusterings to yield a more accurate, informative clustering of the data. These algorithms generally consist of two distinct phases: a generation phase in which a collection of “base” clusterings is produced (i.e. the members of the ensemble), and an integration phase where the ensemble members are aggregated to produce a single consensus clustering. To produce a diverse set of clusterings, common generation strategies include using unbiased random sampling to produce clusterings on different parts of the same dataset [9], and clustering on randomly-selected feature subspaces [10]. To integrate an ensemble of clusterings, a number of authors have proposed cumulative voting schemes, which are based on the assumption that there will be a direct relationship between individual clusters across all the base clusterings. Since finding a mapping between the clusterings in a single pass will generally be intractable, Dimitriadou et al. [6] proposed a heuristic approach where, for each base clustering, the clusters are mapped to those already present in the current consensus clustering. This mapping is performed by matching each pair of clusters that have the highest fraction of objects in common. The matched cluster assignments may then be viewed as “votes” indicating associations between the data objects and the clusters in the current consensus clustering. A key assumption here is that there will always be a mapping between the clusters occurring in each base clustering. To produce a final non-overlapping clustering from the vote counts, Dudoit & Fridlyand [8] proposed using a plurality voting scheme, where each object is assigned to the majority cluster label. A probabilistic cumulative voting scheme was proposed in [2] for combining base clusterings containing different numbers of clusters. B. Learning from Multiple Views Blum & Mitchell [5] initially proposed the application of machine learning techniques in a multi-view setting, a problem which arises in domains where the data objects will naturally have several different, independent representations. While theoretical work in this area has largely focused on supervised learning problems, researchers have also considered the problem of producing clusterings from several different data sources. For instance, Bickel & Scheffer [4] proposed multi-view extensions of existing partitional and agglomerative clusterings algorithms. These algorithms were applied to the problem of clustering web pages, as represented by both textual information and hyperlinks. Muslea et al. [18] considered the problem of applying supervised techniques in situations where multiple, potentially incompatible views are available – that is, where disagreements exist between the target concepts in the views. The problem of reconciling inconsistent models from different views was recently formalised by Berthold & Patterson [3], who introduced the concept of learning in parallel
universes. This involves a process that differs from previous definitions of multi-view learning: a local or “partial” model is constructed for each view or “universe”, in such a way that information is shared among the views during the model construction process. By merging the local models, a superior global model is constructed for the domain. An important point is that the local models do not necessarily need to group all possible samples in the domain. A parallel mapping between data objects is sufficient to produce the global model. To implement this concept, the authors proposed an approach for identifying potential cluster centres in small neighbourhoods, which can naturally be extended to the problem of locating clusters across several different views. C. Information Fusion in Bioinformatics The integration of biological data from multiple diverse data sources has recently been used to build improved models in both supervised and unsupervised settings. In some cases many functional labels may be available, as in Saccharomyces cerevisiae, and there may be some overlap between modelling based upon object similarities and label prediction. In this area, Pavlidis et al. [19] made the distinction between three general integration strategies: early integration involves the direct combination of data from several views into a single dataset before learning; intermediate integration involves computing separate similarity matrices on the views and producing a combined pairwise representation which is then passed to the learning algorithm; and late integration involves applying an algorithm to each individual view and subsequently combining the results. The authors considered the application of each combination strategy with SVMs to learn gene functional classes from gene expression and phylogenetic profiles. As interest has increased in the problem of information fusion, researchers have begun to focus primarily on strategies based on intermediate and late integration. For example, Troyanskaya et al. [24] used a Bayesian framework derived from domain expertise to integrate pairwise co-associations within clusterings from gene expression, protein interaction, and transcription factor binding site data. Sequential late integration approaches have been proposed, where information from one view is used to “constrain” the behaviour of a learning algorithm in another view. Ideker et al. [12] employed simulated annealing to search for “active subnetworks” representing connected sets of ORFs, derived from their protein interaction data, which also contained high levels of differential expression. In this approach precedence was given to the model provided by the interaction data, with significant structures only emerging when they were corroborated by a high differential expression. A semi-supervised formulation of the multi-view learning problem was proposed by Zeng et al. [25], where information between multiple views is passed through the use of explicitly-defined pairwise “must-link” and “cannotlink” constraints. These constraints were generated from an ensemble clustering of biomedical literature, and were
subsequently used to improve quality of clusters produced on gene expression data. The authors observed that inconsistent constraint sets, which could arise from incompatible views, can considerably reduce clustering accuracy. Previous integration approaches, such as those listed above, generally prioritise conserved relationships between views to build a single, consensus model which is potentially more accurate than models produced on the original views. As both the scale and diversity of experimental datasets increase, such approaches may be viewed as being overly conservative in terms of omitting patterns present in individual views only. Consequently, patterns uncovered in one view that have no corresponding, or only partially corroborating structures, in another view, would tend to be ignored. However, in biological datasets it will often be the case that the presence of a pattern exclusive to one source or type of data may be legitimately expected. III. M ETHODS In this section we describe the Parallel Integration Clustering Algorithm (PICA), a new approach for performing cluster analysis in domains where two or more heterogeneous data sources are available. This approach can be regarded as sharing certain similarities with late integration techniques, as we seek to combine clusterings produced independently on each view. However, motivated by the parallel universes concept [3], PICA differs from standard fusion approaches in that it combines all of the following goals: • Not all data objects from the domain need to be present in each view. PICA only assumes that there is some intersection between the objects in each pair of views. • It does not require access to the original feature space for each view. The only input to the process is a collection of one or more clusterings for each view, which may be produced on either feature-based or relation-based data. • It allows for the fact that patterns may be present or detectable in one view, but not in another. Rather than producing an aggregated model that focuses solely on patterns common to all views, PICA can conserve those that are present in a subset of views. • It supports a degree of interaction or “mixing” between different views prior to the production of the final global model. • The final global model produced by PICA supports the representation of overlapping patterns (i.e. data objects can belong to more than one cluster). A. Overview Based on the goals given above, we formally describe the clustering problem. Firstly, let X denote the set of all possible data objects in our domain. In this domain, we have access to a set of v views, where Xl ⊆ X denotes the subset of objects present in the l-th view. These objects may either be represented explicitly in a feature space, or implicitly in the form of a pairwise relation-based representation. Next, let us assume that we can generate a collection of base
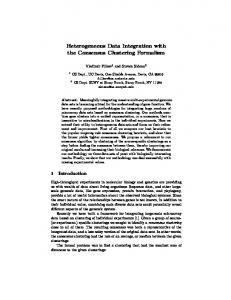
Data Views Clustering Algorithm
Clustering Algorithm
Base Clusterings mixing
Local Models Global Model Fig. 1. Overview of the Parallel Integration Clustering Algorithm (PICA).
clusterings for each view, where Cl denotes the collection of clusterings generated on the view Xl . These may be generated using any appropriate algorithm (e.g. a partitional algorithm such as k-means, or a hierarchical algorithm where a suitable cut-off strategy has been employed), with the only requirement being that they are “hard clusterings” (i.e. not a soft or fuzzy clustering, although such clusterings can naturally be thresholded to produce a hard clustering). We denote the complete set of base clusterings for all views by C = {C1 ∪ · · · ∪ Cv }. Given this problem definition, PICA follows a two-stage process: 1) Produce a set of local models {L1 , . . . , Lv }, where Ll represents a model, in the form of an overlapping clustering, produced on the view Xl , with some contribution or “mixing” from the other views. 2) Combine the local models to produce a global model G, which merges the common aspects of the individual local models, while preserving those clusters that are unique to each local model. The complete PICA algorithm is outlined in Figure 1, and specific details are provided in the remainder of this section. B. Cumulative Voting Aggregation Before describing our approach for constructing local and global models, we first introduce a variation of previous ensemble cumulative voting methods that we will use to build these models. Given a collection of base clusterings Cl = {C1 , . . . , Ct }, we initialise the aggregate clustering L by selecting the base clustering from Cl with the highest information content. Specifically, we calculate the average normalised mutual information (ANMI) [21] for each base clustering in Cl . This measures the amount of information shared between a single clustering and the other clusterings in the collection. We select the base clustering with the highest ANMI score as our initial aggregate clustering L.
For each subsequent base clustering Cj , we attempt to match each of its clusters with a cluster in the current aggregate clustering L. The optimal match may be found by solving the minimal weight bipartite matching problem using the Hungarian method [15]. We measure the similarity between a pair of clusters using the binary overlap coefficient, which defines the agreement between sets (A, B) as: over(A, B) =
|A ∩ B| min(|A|, |B|)
(1)
A value of 1 indicates that one cluster is fully contained within, or identical to, another cluster. A value of 0 indicates that there is no overlap between a pair of clusters. If the best match between the base cluster and an existing aggregate cluster in L yields a value for Eqn. 1 that is above a threshold value θ ∈ [0, 1], the match is performed and the clusters are merged. In practice we found that a value of θ = 0.5 was suitable for the datasets used in our evaluation (see Section IV). This signifies that an object should belong to a cluster in at least 50% of the occurrences of that cluster across all the clusterings in Cl . Unlike previous cumulative voting ensemble techniques, the use of thresholding here means that not all clusters from the base clusterings will be used in the aggregated model – for instance, noisy or irrelevant base clusters will not make a contribution. If a suitable match is found, the base cluster is merged with the matched aggregate cluster. The aggregate cluster is now defined as the set of all objects that have been assigned to at least a fraction µ ∈ [0, 1] of all those base clusters that have previously been merged with it. On the other hand, if there is no suitable match for a base cluster, it is discarded. This matching-merging procedure is repeated until all base clusterings from the set Cl have been processed, at which time L is deemed to be the final aggregate clustering. C. Local Model Construction We now extend the cumulative voting aggregation approach described above to the case where two or more related views are available. For each of the v views, we maintain an aggregate clustering Ll which represents the local model for that view. Each of these aggregate clusterings is initialised by selecting the clustering with the highest ANMI from the set of base clusterings Cl constructed only on the corresponding view Xl . We subsequently attempt to match each remaining base clustering from the complete set C with all of the local models (i.e. not simply the model corresponding to the view on which that clustering was generated). This has the effect of supporting mixing between the views, where information provided by a base clustering from one view Xa can inform the model constructed for another view Xb . Note that the use of the thresholding in the matching process is particularly appropriate in this context – clusters from Xa that do “fit well” into the model for Xb are not included in that model. When merging clusters, we set the membership threshold µ = 1/v, which signifies that an object will be belong to an aggregated cluster if it is consistently present in that cluster
in at least one view. Once all base clusterings in C have been processed, the resulting v aggregate clusterings provide the set of local models {L1 , . . . , Lv }. D. Global Model Construction At this stage we have constructed v local models. These may be of interest in their own right, but for ease of interpretation and evaluation, we would like to “join” these partial models to produce a single global model providing a more complete view of the domain. This is achieved by performing an additional matching procedure at this level, where similar clusters from each local model are merged, so that redundant patterns are combined, while unique patterns are preserved. Specifically we consider each pair of clusters across all local models, and merge those pairs with an overlap coefficient value (1) of greater than the matching threshold θ. This is equivalent to perform complete-linkage agglomerative clustering on the local model clusters, with the cut-off threshold set to θ. This results in a single global model G produced from all v views, P where the number of clusters in this model is |G| ≤ (|L1 | + . . . |Lv |). The clusters in G represent patterns that were unique to views, as well as those that were present in two or more views (i.e. clusters from the local models that were merged during the final matching procedure). IV. E XPERIMENTAL E VALUATION A. Datasets We now perform an evaluation on three views pertaining to the eukaryotic model organism Saccharomyces cerevisiae or budding yeast. Our first view is a gene expression dataset (the Rosetta Compendium) containing genome-wide mRNA in measurements over 300 diverse mutations and chemical treatments [11]. Profiles defined as ‘dubious’ by the Saccharomyces Genome Database (SGD) and those with 25% or more missing values were removed, leaving a subset of 5596 expression profiles. Any remaining missing values were imputed via kNN missing value estimation [23]. Our second view comprises a text corpus mined from biomedical literature. Following the approach discussed by Zeng et al. [25], we retrieved a set of 38,661 yeast-related MEDLINE abstracts, corresponding to the references enumerated in the SGD literature curation database1 (May 2008). Since the database provides links between references and genes, we can form a “meta-document” for each gene consisting of the concatenation of all abstracts annotated as pertaining to that gene. From this we constructed a bag-ofwords model, represented in the form of a term-gene matrix. To pre-process the data we removed dubious ORFs, and applied standard stop-word removal and stemming techniques to the abstracts. We subsequently removed terms occurring in less than three documents, and applied log-based TFIDF normalisation to the term vectors. Our final dataset, 1 ftp://genome-ftp.stanford.edu/pub/yeast/ data download/literature curation/
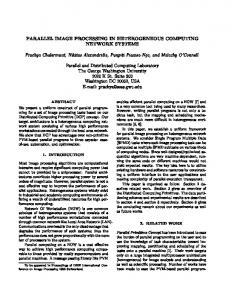
160 PICA
140
mRNA
Text
PPI
42
43
-Log (P-value)
120 100 80 60 40 20 0 01
02
10
11
12
14
16
18 20 30 MIPS Category
32
34
38
40
41
Fig. 2. Significance of each MIPS top level category in the clusters returned by PICA, compared to the mean significance scores achieved by the base clusterings produced by k-means on each of the views: mRNA expression, text and PPI. Significance is given in terms of the over-representation of each category, as measured by -Log(P -value).
consisting of 6013 ORFs and 62,859 terms, is freely available online2 in matrix form. Our third view is a protein-protein interaction dataset constructed from the Database of Interacting Proteins (DIP)3 , a resource which documents the experimentally determined protein-protein interactions for the yeast proteome. At the time of download (May 2008), this database described 17,491 interactions between 4392 proteins. These three datasets represent connected views between which objects and patterns are partially shared – in total 6427 genes were present in the combined set, with an intersection of size 4547. B. Base Clustering Generation As noted previously, PICA can be applied to any set of clusterings containing “hard” clusters. Ensemble methods are most effective when combining a set of accurate, diverse clusterings. Similarly, we apply PICA to collections of clusterings from different views, where each collection provides a reasonable trade-off between diversity and accuracy. It was shown in [13] that the level of diversity among the clusterings can be increased by varying the number of clusters in each base clustering, such as by randomly selecting a value ki from a predefined range [kmin , kmax ]. This range simplifies the model selection problem involved in applying partitional clustering algorithms, and will generally be informed by knowledge of the specific data type. For each view, we generated 1000 base clusterings as follows. In the case of the text data, we applied standard kmeans with cosine similarity to the term-gene matrix, with the number of clusters k ∈ [15, 20]. To encourage diversity we randomly sub-sample the data without replacement, with a sampling rate of 80%, and back-fit out-of-sample objects as described in [9]. For the gene expression data, we again use k-means, but calculate similarities based on the Pearson correlation measure, and use the range k ∈ [25, 35] which is in line with the number of clusters suggested in [22].
We produce diverse clusterings on this dataset by using random subspacing [10], where each clustering is generated on 50% of the original feature set. In addition to encouraging diversity, this also facilitates the discovery of patterns that are only correlated under certain subsets of conditions. Unlike the other two views, the protein interaction dataset has a relation-based representation (i.e. there is no original feature space). To capture indirect relations between pairs of proteins, we apply the neighbourhood-based CzekanowskiDice similarity measure previously used in [1] to cluster PPI data. We then applied the kernelised version of the k-means algorithm [20] to the resulting similarity matrix, with random sub-sampling as described for the text data, and the number of clusters chosen from k ∈ [15, 25]. C. Cluster Validation Measures To quantitatively validate the final clustering produced by PICA, yeast ORFs were first labelled with functional categories from the MIPS (Munich Information on Protein Sequences)4 database [17]. We then employed two commonly-used validation measures to assess the accuracy of the individual clusters produced by PICA with respect to the annotated categories: •
•
P-value: The statistical significance of discovering each functional module is given in terms of P-values, calculated based on the binomial approximation of the hypergeometric distribution [7]. To provide an approximate cut-off level for differentiating between significant and insignificant clusters, we use a value of 10−4 as proposed in [22]. As in their study, we report -Log(P value) for improved readability within tables. Functional enrichment: We also measure the enrichment or precision of each cluster, which is defined as the fraction of genes in a given cluster that pertain to a specific MIPS category [22].
2 http://mlg.ucd.ie/datasets/yeast.html 3 http://dip.doe-mbi.ucla.edu/
4 http://mips.gsf.de/genre/proj/yeast/
TABLE I C LUSTER VALIDATION SCORES FOR MOST SIGNIFICANT CATEGORIES IDENTIFIED BY PICA, COMPARED TO THOSE FOUND IN INDIVIDUAL VIEWS . Cluster
Functional category
Category -Log(P -value) Functional enrichment PICA mRNA Text PPI PICA mRNA Text PPI size G32 20.09 Transport routes 713 176 07 143 16 0.67 0.23 0.63 0.34 G35 11.02 RNA synthesis 604 172 09 140 18 0.70 0.22 0.67 0.30 159 11 138 09 0.78 0.22 0.73 0.15 G20 10.01 DNA processing 517 G42 10.03 Cell cycle 648 140 13 117 24 0.71 0.27 0.65 0.37 133 70 142 22 0.65 0.41 0.53 0.26 G05 12.01 Ribosome biogenesis 310 G53 01.06 Lipid, fatty acid metabolism 286 128 05 50 08 0.49 0.12 0.25 0.16 G40 43.01 Fungal. cell type differentiation 451 119 04 71 10 0.47 0.12 0.42 0.20 118 09 62 27 0.57 0.25 0.42 0.40 G19 20.01 Transported compounds 594 110 06 55 20 0.59 0.13 0.31 0.23 G28 14.13 Protein/peptide degradation 256 G58 11.04 RNA processing 399 106 57 106 42 0.50 0.35 0.49 0.41 G40 40.01 Cell growth / morphogenesis 238 91 05 54 09 0.32 0.10 0.28 0.13 90 60 88 17 0.21 0.36 0.19 0.20 G27 42.16 Mitochondrion 170 G40 30.01 Cellular signalling 199 84 04 51 07 0.28 0.10 0.23 0.07 G50 01.01 Amino acid metabolism 244 83 48 59 03 0.21 0.28 0.19 0.09 82 05 77 11 0.31 0.10 0.37 0.15 G40 42.04 Cytoskeleton/structural proteins 252 81 08 66 03 0.30 0.11 0.32 0.11 G50 01.05 C-compound & carb. metabolism 507 G40 34.11 Cell. sensing to external stimulus 284 73 14 47 06 0.30 0.24 0.27 0.12 57 05 53 06 0.26 0.11 0.30 0.13 G32 14.04 Protein targeting, sorting, transloc. 281 G52 42.01 Cell wall 213 52 05 37 02 0.29 0.11 0.20 0.06 G46 20.03 Transport facilities 195 51 04 35 14 0.23 0.08 0.17 0.17 Listed above are the 20 most significant categories identified by the global model produced by PICA. Significance is measured by -Log(P -values), calculated with respect to the second level MIPS functional categories. Functional enrichment scores are also provided for each category. The highest values for each category and validation measure are in highlighted in bold.
D. Quantitative Evaluation of PICA The global model G produced by PICA consisted of 59 clusters, covering 5906 of the 6427 ORFs present in the union of the three views. Of the 1880 ORFs that were absent from at least one view, 1373 of these were assigned to at least one cluster – ORFs did not need to be present in all views to be included in the model. It is worth noting that, although the base clusterings were all non-overlapping, considerable overlap exists between the final clusters in G. Specifically, on average each ORF was assigned to 2.1 clusters, and 4813 ORFs from the total set of 6427 were assigned to more than one cluster. This reflects the actual potential for ORFs to belong to more than one functional module. As baselines for comparison in our experiments, we evaluate the mean performance of the base clusterings generated separately by k-means on each of the three views: mRNA, text, and PPI. Figure 2 illustrates the most significant clusterclass combinations (in terms of -Log(P -value)) uncovered by the global model, for the top level MIPS categories. Corresponding mean scores for the baseline techniques are also presented. It is apparent that, on average, fifteen of the seventeen MIPS top level categories were better represented by the global model than in the clusterings produced in the individual views alone. A similar trend (thirteen from seventeen categories) was also observed upon examining the corresponding functional enrichment values at this level. The most competitive single view is the model built upon the curated literature. This is perhaps unsurprising given the extent and quality of the text corpus used in this study. These model comparisons are now examined at a greater resolution via the more functionally informative MIPS second level categories. From the global model produced by PICA on the three
data views, 65 of the 98 MIPS second level categories were identified with a P -value of at least 10−4 . Table I lists the twenty most significant second level categories identified by PICA, arranged in descending order by -Log(P value). Functional enrichment scores for these clusters are provided on the right-hand side of the table. For the purpose of comparison, validation scores for the base clusterings generated on each view are also presented. We observe that PICA performs better in terms of P values on eighteen out of twenty categories, and achieves higher functional enrichment for fifteen out of twenty. Again we see that the model built on the text view alone is the most competitive. The only instance in which the global model is less significant is in the case of ribosome biosynthesis (12.01). This may be partially explained by the fact the ribosome is the organelle most widely studied and best described in the literature. However, the relevant cluster uncovered by the global model has a higher functional enrichment, suggesting that PICA uncovers a smaller, more concise model for this category. Other values most supportive of PICA include those for clusters G53 and G28, representing categories 01.06 and 14.13 respectively. These global clusters are considerably more significant, in terms of both P -value and functional enrichment, than those produced for these categories on any of the individual views. E. Modelling of Unique Patterns There are seventeen significant patterns (i.e. P < 10−4 ), corresponding to second level MIPS categories, that appear in the global model, despite being represented in only one of the views. Of these, fifteen are present in the global model with a higher significance than in the relevant single view. For example, the global cluster associated with the MIPS category of detoxification (32.07) appears only in the text
data (P = 10−30 ). This is perhaps unsurprising as neither PPI nor the gene expression data were produced under toxic experimental conditions. Furthermore, PICA retrieves a more significant global cluster (P = 10−38 ) for this functional category. Another category, that of the cell wall (42.01), appears predominantly within the text view (P = 10−37 ), to a lesser extent in the expression data (P = 10−5 ), and is effectively absent from the PPI data. It has been previously shown that this functional class displays low connectivity in proteinprotein networks [16]. Despite this, a more significant cluster (P = 10−52 ) is recovered in the global model produced by PICA. In general, non-essential ORFs and their protein products are less likely to form inter-connected structures in PPI data [14]. V. C ONCLUSION In this paper, we have presented a new approach for simultaneously exploring patterns present in connected heterogeneous data sources, which is motivated by the concept of clustering in parallel universes [3]. To the best of our knowledge, this work represents the first application of this concept within the domain of bioinformatics. The proposed PICA algorithm, which involves the parallel aggregation of collections of clusterings generated on each of the views, was empirically evaluated on three real-world datasets pertaining to Saccharomyces cerevisiae. The evaluations show that the algorithm allows us to effectively integrate the information provided by these datasets, resulting in a global model for the domain that uncovers meaningful patterns corresponding to functional groupings. In this respect, the algorithm proved considerably more effective than standard partitional clustering algorithms applied to the individual views. In our evaluation we remarked that the clusterings generated on the text data proved considerably more informative than those produced on the other two data types. We suggest that superior base clustering techniques applied to the gene expression and PPI views respectively may yield a global model that supports more “mixing” between views. In addition, we would like to consider extending the PICA framework to include the integration of “soft” clusterings, such as those produced by fuzzy clustering and matrix decomposition algorithms. R EFERENCES [1] S. Asur, D. Ucar, and S. Parthasarathy. An ensemble framework for clustering protein protein interaction networks. Bioinformatics, 23(13):i29, 2007. [2] H.G. Ayad and M.S. Kamel. Cumulative voting consensus method for partitions with variable number of clusters. IEEE Transactions on Pattern Analysis and Machine Intelligence, 30(1):160–173, 2008. [3] M Berthold and D Patterson. Towards learning in parallel universes. Proc. 2004 IEEE International Conference on Fuzzy Systems, 1, 2004. [4] Steffen Bickel and Tobias Scheffer. Multi-view clustering. In Proc. 4th IEEE International Conference on Data Mining (ICDM’04), pages 19–26, Washington, DC, USA, 2004. IEEE Computer Society. [5] A. Blum and T. Mitchell. Combining labeled and unlabeled data with co-training. Proceedings of the eleventh annual conference on Computational learning theory, pages 92–100, 1998.
[6] Evgenia Dimitriadou, Andreas Weingessel, and Kurt Hornik. A combination scheme for fuzzy clustering. International Journal of Pattern Recognition and Artificial Intelligence, 16(7):901–912, 2002. [7] S Draghici, P Khatri, R P Martins, G C Ostermeier, and S A Krawetz. Global functional profiling of gene expression. Genomics, 81(2):98– 104, 2003. [8] Sandrine Dudoit and Jane Fridlyand. Bagging to improve the accuracy of a clustering procedure. Bioinformatics, 19(9):1090–1099, 2003. [9] Xiaoli Fern and Carla Brodley. Solving cluster ensemble problems by bipartite graph partitioning. In Proc. 21st International Conference on Machine Learning (ICML’04), July 2004. [10] Derek Greene, Alexey Tsymbal, Nadia Bolshakova, and P´adraig Cunningham. Ensemble clustering in medical diagnostics. In Proc. 17th IEEE Symposium on Computer-Based Medical Systems (CBMS’04), pages 576–581. IEEE Computer Society, 2004. [11] T.R. Hughes, M.J. Marton, A.R. Jones, C.J. Roberts, R. Stoughton, C.D. Armour, H.A. Bennett, E. Coffey, H. Dai, Y.D. He, et al. Functional Discovery via a Compendium of Expression Profiles. Cell, 102(1):109–126, 2000. [12] T. Ideker, O. Ozier, B. Schwikowski, and A.F. Siegel. Discovering regulatory and signalling circuits in molecular interaction networks, 2002. [13] A. K. Jain and A. Fred. Data clustering using evidence accumulation. In Proc. 16th International Conference on Pattern Recognition (ICPR’02), volume 4, pages 276–280, December 2002. [14] H. Jeong, S.P. Mason, A.L. Barabasi, Z.N. Oltvai, et al. Lethality and centrality in protein networks. Nature, 411(6833):41–42, 2001. [15] H. W. Kuhn. The hungarian method for the assignment problem. Naval Research Logistics Quaterly, 2:83–97, 1955. [16] V. Kunin, J.B. Pereira-Leal, and C.A. Ouzounis. Functional Evolution of the Yeast Protein Interaction Network. Molecular Biology and Evolution, 21(7):1171–1176, 2004. [17] Hans-Werner Mewes, Dmitrij Frishman, Ulrich G¨uldener, G. Mannhaupt, Klaus F. X. Mayer, Martin Mokrejs, Burkhard Morgenstern, M. M¨unsterk¨otter, Stephen Rudd, and B. Weil. Mips: a database for genomes and protein sequences. Nucleic Acids Research, 30(1):31–34, 2002. [18] I. Muslea, S. Minton, and C. Knoblock. Active+ semi-supervised learning= robust multi-view learning. Proceedings of the International Conference on Machine Learning, pages 435–442, 2002. [19] P. Pavlidis, J. Weston, J. Cai, and W.S. Noble. Learning Gene Functional Classifications from Multiple Data Types. Journal of Computational Biology, 9(2):401–411, 2002. [20] Bernhard Sch¨olkopf, Alexander Smola, and Klaus-Robert M¨uller. Nonlinear component analysis as a kernel eigenvalue problem. Neural Computation, 10(5):1299–1319, 1998. [21] Alexander Strehl and Joydeep Ghosh. Cluster ensembles - a knowledge reuse framework for combining multiple partitions. Journal of Machine Learning Research, 3:583–617, December 2002. [22] S. Tavazoie, J.D. Hughes, M.J. Campbell, R.J. Cho, and G.M. Church. Systematic determination of genetic network architecture. Nature Genetics, 22:281–285, 1999. [23] O. Troyanskaya, D. Botstein, and R. Altman. Missing value estimation. A Practical Approach to Microarray Data Analysis, Kluwer Academic Publishers, Boston, Dec, 2002. [24] O.G. Troyanskaya, K. Dolinski, A.B. Owen, R.B. Altman, and D. Botstein. A Bayesian framework for combining heterogeneous data sources for gene function prediction (in Saccharomyces cerevisiae). Proceedings of the National Academy of Sciences, 100(14):8348, 2003. [25] E. Zeng, C. Yang, T. Li, and G. Narasimhan. On the Effectiveness of Constraints Sets in Clustering Genes. Proc. 7th IEEE International Conference on Bioinformatics and Bioengineering (BIBE 2007), pages 79–86, 2007.