Technische Universität Dresden, Center for Information Services and High Performance Computing (ZIH), ... parallel performance measurement in three leading HPC tools: PAPI [1] ..... calls into the CUDA or OpenCL libraries, VampirTrace can.
Parallel Performance Measurement of Heterogeneous Parallel Systems with GPUs Allen D. Malony∗ , Scott Biersdorff∗ , Sameer Shende∗ , Heike Jagode† , Stanimire Tomov† , Guido Juckeland‡ , Robert Dietrich‡ , Duncan Poole§ and Christopher Lamb§ ∗ University
of Oregon, Eugene, Department of Computer and Information Science of Tennessee, Knoxville, Innovative Computing Laboratory (ICL) ‡ Technische Universit¨at Dresden, Center for Information Services and High Performance Computing (ZIH), Germany § NVIDIA Corporation, Santa Clara, CA † University
Abstract—The power of GPUs is giving rise to heterogeneous parallel computing, with new demands on programming environments, runtime systems, and tools to deliver high-performing applications. This paper studies the problems associated with performance measurement of heterogeneous machines with GPUs. A heterogeneous computation model and alternative host-GPU measurement approaches are discussed to set the stage for reporting new capabilities for heterogeneous parallel performance measurement in three leading HPC tools: PAPI, Vampir, and the TAU Performance System. Our work leverages the new CUPTI tool support in NVIDIA’s CUDA device library. Heterogeneous benchmarks from the SHOC suite are used to demonstrate the measurement methods and tool support.
I. I NTRODUCTION Disruptive parallel technologies, both hardware and software, will invariably cause ripple effects through the highperformance computing (HPC) landscape, as other HPC components, methods, and applications adjust, compensate, or retarget in response. Such is the case with general purposal GPUs (GPGPUs) and heterogeneous parallel computing. The rapid ascent of GPU computing has resulted in zealous research and development in heterogeneous systems architecture, compiler frameworks for manycore parallelism, massively concurrent parallel libraries and runtime systems, and heterogeneous programming environments. Indeed, it is the inherent computing power of GPUs that is driving nextgeneration tools to deliver solutions that can realize their high performance potential. Tools for parallel performance instrumentation, measurement, and analysis are no exception. Presently, HPC performance tools are adequately meeting the analysis requirements for scalable parallel systems built from homogeneous multicore shared-memory nodes and programmed using MPI and OpenMP. While increasing CPU multicore concurrency is stressing performance tool engineering for these environments, massive parallelism combined with heterogeneous computation presents an even greater challenge. It is na¨ıve to believe a simple tool retrofit will solve the problem for two reasons: 1) the heterogeneous parallel computation model is different in fundamental ways and this must be addressed in the performance tool, and 2) there is a dependency on necessary support in the GPU hardware and
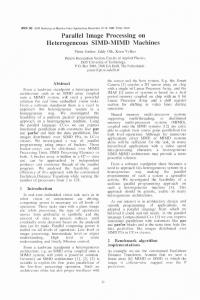
software to expose performance events and data to the tool measurement infrastructure. The research reported here describes important initial efforts to incorporate new methods and capabilities for heterogeneous parallel performance measurement in three leading HPC tools: R [3]. PAPI [1], Vampir [2], and the TAU Performance System What makes the work unique is the integration of a new performance tool interface developed as part of NVIDIA’s GPU device library. The paper begins in Section §II with a description of the heterogeneous execution model being targeted by the tools. This model forms the basis of the measurement approach, presented in Section §III. Our development within each tool is discussed in Section §IV, along with a description of the NVIDIA CUDA performance tools interface (CUPTI). Section §V gives illustrative examples from the NVIDIA SDK and the SHOC benchmarks [4] as well as the CUBLAS [5] and MAGMA [6] libraries which are used to demonstrate the different execution scenarios that can be encountered. The paper concludes with a summary of results and a discussion of future directions. II. H ETEROGENEOUS C OMPUTATION M ODEL A heterogeneous computing architecture based on GPUs can be characterized as a scalable cluster of shared memory nodes with multicore processors and PCI-attached GPUs, interconnected by a high-performance network fabric for fast, high-bandwidth inter-node communication; see Figure 1. Heterogeneous computation with this architecture involves three general types of operational interactions. First, there are the interactions between nodes that take place through communication between processes. These involve libraries that implement message passing or global address space semantics. Second, there are the intra-node interactions between threads of execution as part of the node’s CPU multicore parallel execution. These involve shared memory programming and multithreaded runtime systems. Lastly, there are the interactions between a node’s CPUs and the attached GPU devices. These involve DMA memory transfers to/from the GPU device over a PCI bus, launching of GPU kernels, and other functions provided by the device and driver libraries supporting the operations.
��������������� ����� ���
���������� �
� ���
�����
���
�����
���� ����������� � �
���
���������
���������������
����
���������
������������
�
���
���������������������������������
��
���
���
���
���� ����������� � �
���������
�����������
���������������
���������
Architecture of a heterogeneous computer system.
��������� ����
���������
������������
!������"
Fig. 1.
����
���������������
� !������#
������������
���
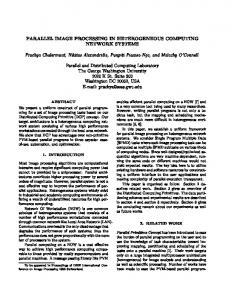
Ideally, we want parallel performance tools to provide a comprehensive heterogeneous performance perspective that represents the different operational aspects of the computation in a unified way. In contrast to existing performance tools for “homogeneous” parallel systems, what distinguishes the challenge in a heterogeneous environment is how the GPU performance and CPU-GPU interactions are observed and represented in the context of the overall application. Thus, if we can focus on the technical aspects of accurately capturing the GPU performance data and associating it with node-level parallel execution, then we can leverage existing support for scalable performance measurement and analysis to provide a complete solution. A. CPU-GPU Operational Semantics It is convenient to abstract the use of GPUs as an accelerator for executing tasks that would otherwise execute on the host (i.e., a node CPU). Each task is set up, launced, executed by the GPU, and finalized. There can be multiple tasks in execution on one or more GPUs. From this perspective, a performance observation model for task-based execution might try to establish when the tasks started and finished, their execution time and other performance data, and the overhead for set up and finalization. Now, if we take a more physical perspective, GPUs as hardware accelerators are controlled by a host CPU which handles data movement between the disjoint memory locations of the two and instructs the GPU to execute kernels that exploit its manycore data parallelism. The controlling process (or thread) will bind against one available GPU device, transfer the necessary input data into the device memory, launch one or multiple kernels, and copy the results back [7]. Figure 2 portrays these basic operations for different scenarios. When a GPU kernel is launched, the device executes its work asynchronously to the host processor. Launching a GPU kernel is technically just an enqueuing of a function pointer into a list of kernels to run on the GPU. The GPU device interfaces are typically non-blocking, allowing a CPU to launch/enqueue multiple kernels one after another which will then be executed in sequential order. This asynchronous nature of the GPU interaction also applies to the data transfers. In addition, it is possible for multiple GPU kernels to be launched and be in execution concurrently. The technical realization of this concurrency for NVIDIA GPUs is done
����� ����������� � ��"
���������
���������������
���������
������������
��" �����
��� ����� � ���
����
�����
������������
�����������
���������
���������������
����
���������
���
Fig. 2. Timelines for different CPU-GPU scenarios. Top: single thread, 1 kernel with 1 GPU; Middle: single thread, 2 kernels with 1 GPU; Bottom: multiple kernels and GPUs.
by introducing multiple execution streams that are simply independent kernel execution queues. The GPU hardware scheduler then picks the kernel from the top of each queue and tries to run them concurrently, balancing the resources between the concurrent streams. This naturally translates to multiple GPU devices being in use simultaneously under control of multiple CPU threads. Figure 2 portrays these two scenarios. B. Heterogeneous Execution and Performance In a heterogeneous parallel program, the GPU-accelerated task execution as described above is happening concurrently with the other inter-node and intra-node parallelism in the application. A problem domain can be split so that the CPU cores, using one form of multi-threading (OpenMP or pthreads) and the GPU are working on different parts of the domain at the same time. Furthermore, multiple servers offering GPU acceleration can also do a coarse domain decomposition and use underlying fine-grained decomposition offered by multi-threading and/or GPU acceleration. A couple of technical difficulties make this approach not as straightforward as one would expect. First, in a multi-threaded program each thread can bind against the same GPU device, but will receive a different context, limiting interaction. Second, communication of data between GPU devices in different physical hosts now requires three steps: moving the data from device memory to host memory of the sending host, send the data to the receiving host, and moving the data from host memory to device memory on the receiving host. Our objective is to characterize the heterogeneous execution performance to evaluate several concerns: • GPU kernel execution. Performance data characterizing how a kernel executed on the GPU hardware can provide
feedback for kernel optimization. •
Host-GPU interactions. Measurements of kernel set up, memory transfer times, concurrency overlap, and synchronization waiting enable calculations of host overhead and efficiency.
•
Intra-node execution. Here we are capturing performance metrics to evaluate shared-memory multi-threaded execution with respect where and what threads are doing (e.g., routines) and their interactions (e.g., coordination).
Inter-node communication. Observed performance includes communication times, overheads, and synchronization effects. We can regard these as layered performance perspectives in a heterogeneous environment. However, to create a comprehensive heterogeneous performance measurement solution we must not only support these performance perspectives, but also their integration. Developing tool support for the first two perspectives is complicated by two factors: the lack of visibility in the GPU for kernel measurement and the asynchronous concurrency that exists between the CPU and GPU. Our work attempts to resolve these problems. •
III. H OST-GPU M EASUREMENT A PPROACHS In measuring GPU performance and host-GPU interactions, there are three sources of information potentially available to us: • GPU programming language. CUDA [8] and OpenCL [9] are the emerging standards for software development on GPUs, providing language syntax and APIs to express kernels and perform GPU operations. Each contains support for observing events associated with GPU use, primarily kernel execution. •
GPU driver. The driver library provided by the GPU manufacturers implement the GPU device interface. If this interfaces is accessible by tools, it makes visible hostto-device operations, as well as provides access to internal data that would be useful for tracking performance.
GPU device. The GPU device typically includes support for hardware performance measurements. Using mechanisms to query this data can make it possible to associated GPU metrics with kernel execution. interface. All three of these sources are useful and together would provide substantial data. However, performance tools must work with what is available to them on a particular platform and this can restrict the coverage. In considering the methods developed in this paper, it is convenient to simplify the GPU execution model as follows: 1) User code is executed on a GPU device in the form of kernels which run without access to direct performance information. 2) A given device can be logically divided into streams of execution and in each stream kernels are executed sequentially in a pre-determined order. •
3) Each kernel is executed after an associated kernel launch that runs on the CPU. These launches also execute in the same sequence as do the kernels (though not necessarily at the same time). With these assumptions, we explore three methods for observing the state of the GPU before and after kernels are executed on these devices. Without loss of generality, we will consider only the measurement of execution time.
���
���� � �� �
���
����
�� �
��� � �����
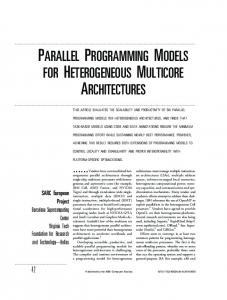
Fig. 3. Synchronous method timeline. Measurements are made on the CPU by recording events before kernel launch and after synchronization. Shaded area represents the execution time.
A. Synchronous method Consider the measurement timeline in Figure 3. The validity of the time measurement is predicated on when the kernel begins and when it ends. We use the term “synchronous” to indicate that it is the CPU (host) who is observing the begin and end events, as denoted by the diamonds in the figure. If the host immediately waits on kernel termination after launch, its kernel measurement is, in effect, synchronized with the kernel execution. In this case, the measurement method is equivalent to measuring a subroutine call. In essence, a synchronous approach assumes the kernel will execute immediately, and the interval of time between the begin and end events will accurately reflect kernel performance. Unfortunately, this assumption is overly restrictive and leads to inaccuracies when more flexible modes of kernel execution are used. As the figure suggests, the host need not block after kernel launch and it can be a long time before it is synchronized with the kernel, resulting in poor estimates of actual kernel execution time. Moreover, multiple kernels can be launched into a stream or multiple streams before a synchronization point is encountered. The benefit of a synchronous approach is that it does not require any additional performance measurement mechanisms beyond what is presently available. Also, interestingly, synchronous measurement is fine to use when the GPU programming utilizes a synchronous library such as CUBLAS. Since the kernels are hidden by the library, putting begin and end events before and after the CUBLAS routine call provides a reasonable estimate of the library’s performance. B. Event queue method The main problem with the synchronous approach is that the kernel execution is measured indirectly, not by the GPU.
��� � � � � � ��
���
�������� � �
� ��
� � � � � ��
����
� � �
� �� � ���
� ��
����� �����
Fig. 4. Event queue method timeline. Measurements are made on the event kernels placed in the same stream as the computational kernel. Shaded area represents the measured execution time.
Consider a special type of kernel called an event kernel which will record the state of the GPU when it is executed. If we could inject an event kernel into the stream immediately before and after the computational kernel, it would be possible to obtain performance data more closely linked with kernel begin and end. The “event queue” method is portrayed in Figure 4. While it is the responsibility of the host to generate the event kernels, queue them into the stream, and read the results, it is the underlying GPU device layer that will take responsibility for making the measurement. In theory this method works well. It adequately addresses the case where multiple kernels are launched in a stream, if each is wrapped by an associated event kernel they are all accounted for even if the synchronization point is not until much later. However, there are a few practical downsides. First, it relies entirely on the device manufacture to provide support for the event kernel concept. The notion of events is a part of both the CUDA and OpenCL specification. However, restrictions on how events can be used and what performance information is returned is implementation dependent. Second, it still requires explicit participation on the part of the host read back the events and process them. The application code will need to be modified in some form for this purpose, although it is possible to hide the changes through automatic instrumentation or library wrapping. Third, if timestamps are used to merge GPU events with CPU events for purposes of performance tracing, the times will need to be synchronized between host and device [10], as the the GPU device has a different internal clock frequency than the host. ��� � ���� �� ������ �
���� � �� �
���
������ �
������ �
�� �
Fig. 5. Callback method timeline. Registered callbacks are triggered by GPU actions, allowing more tightly couple measurements to take place.
C. Callback method A third method relies on a mechanism in the device layer that triggers callbacks on the host for registered actions, like
the begin and end of kernel execution. The “callback” method portrayed in Figure 5 suggests that more immediate kernel performance measurement is possible since control can be given directly to a CPU process via the callback. It is also more flexible since a wider range of callbacks might be provided, and performance measurement can be specific to callback type. The process of callback registration makes it possible to avoid code modification at locations of kernel launch in the application. Clearly, a callback method is dependent on the device manufacturer to provide support in the device layer and even the GPU hardware. It is important, that the implementation ensures an immediate callback before and after the kernel’s execution to provide accurate timing information. D. Method support and implementation The three approaches attempt to abstract host-GPU measurement methods for purposes of comparing alternatives. Whether the methods are effective for heterogeneous performance measurement depends on how well they are supported within GPU languages and devices, and how complex it is to integrate them with performance measurement tools. 1) Synchronization method: The synchronization method is trivial to implement in both CUDA and OpenCL since their programming models define kernel launching and synchronization semantics and mechanisms. It is simply a matter of constructing the measurement instrumentation correctly. 2) Event queue method: The event queue method is available in both CUDA and OpenCL. The CUDA Event interface which provides the GPU timestamp when the event is queued. In its present implementation, the CUDA Event interface only works on one stream of execution that encompasses the entire device, making it unable to measure the performance of kernels that execute simultaneously. In OpenCL, the clGetProfilingInfo interface implements the event queue method. Here, information about a kernel can be obtained via clEvents objects which are activated with a kernel launch. 3) Callback method: The callback method is only available at the language level in the OpenCL specification 1.1 (tested in paper with a developer restricted NVIDIA driver) via the clSetEventCallback interface. However, it should be noted that the OpenCL specification [9] leaves undefined certain behavior of this interface that can potentially affect performance measurement. Specifically, it states (see section 5.9) that: • The registered callback function will be called when after the execution status of command associated with event changes to the execution status specified by command_exec_status. • Each call to clSetEventCallback registers the specified user callback function on a callback stack associated with event. The order in which the registered user callback functions are called is undefined. Thus which command_exec_status is allowed and the order in which callbacks are called is left to implementor of
the specification. 4) CUPTI: At the device level, NVIDIA is developing the CUDA Performance Tool Interface (CUPTI) [8] to enable the creation of profiling and tracing tools that target CUDA applications. CUPTI provides two APIs, the Callback API and the Event API. The Callback API allows you to interject tool code at the entry and exit to each CUDA runtime and driver API call. The CUPTI Event API allows the tool to query, configure, start, stop, and read the event counters on a CUDAenabled device. Using these CUPTI APIs, profiling and tracing tools can gain insight into the CPU and GPU behavior of CUDA applications. CUPTI is delivered as a dynamic library on all platforms supported by CUDA. The next section discusses how these approaches are integrated in the performance tools PAPI, Vampir, and TAU.
Within the PAPI CUDA component, initialization, device management, and context management is enabled by the CUDA driver API, while the domain and event management is enabled by CUPTI. Because there are different hardware counters associated with different GPU devices, PAPI provides a utility called papi_native_avail to list events available on a specific GPU device. Table I lists a portion of the events that are available on a system that features two different GPUs: a GeForce GTX 480 (a member of the Fermi family) and a Tesla C870 device. To efficiently differentiate similar or even identical events on different devices, the name of the events is established by a Component.Device.Domain.Event hierarchy.
IV. H ETEROGENEOUS P ERFORMANCE T OOLS
The Vampir performance analysis tool suite allows tracebased performance analysis of MPI and/or thread-parallel applications. The methodology consists of [2], [13], [14]: 1) instrumenting the source code of the application to be studied and linking it with the VampirTrace library,
Our working premise is that measurement methods for GPU kernel execution and host-GPU interaction can be integrated with existing parallel performance tools to create a heterogeneous performance measurement solution. The tools targeted in this paper support performance counter measurement, profiling, and tracing for scalable parallel applications, and are generally representative of probe-based measurement systems. Below we describe how these tools have incorporated the GPU measurement methods presented in Section §III in their implementation. A. PAPI CUDA Component The PAPI project aims to provide a consistent interface and methodology for the measurement of hardware performance information, which is not only available on most major microprocessors, but also scattered across the chip and system [11], [12]. The PAPI CUDA component is a hardware performance counter measurement technology for the NVIDIA CUDA platform which provides access to the hardware counters inside the GPU. PAPI CUDA is based on CUPTI support in the NVIDIA driver library. In any environment where the CUPTIenabled driver is installed, the PAPI CUDA component can provide detailed performance counter information regarding the execution of GPU kernels. During use, the PAPI CUDA component invokes the CUDA runtime routine cudaGetDevice() to get the ID of the currently used device. When a user is running an application on a system that features multiple GPU devices, the PAPI CUDA component gets the CUDA context for either the default device or the device specified with cudaSetDevice() in the user’s application. In order for PAPI to prevent termination in the case a user starts PAPI before a CUDA context has been created in the user’s application, PAPI creates a CUDA context for the device returned from the cudaGetDevice() routine. Having access to the correct CUDA context is important for setting the PAPI counter control structure as well as for starting / stopping counters and writing / reading counter values to or from the counters.
B. Vampir/VampirTrace
2) executing the instrumented application to generate a detailed execution log (trace file), and 3) conducting post-mortem analysis of the trace file with command line tools to generate execution profiles or with the Vampir tool for timeline-based visualization of the program execution combined with statistical profiles. VampirTrace supports the event queue method with a library wrapping approach for CUDA and OpenCL to generate log information about GPU utilization [14], [10]. By intercepting calls into the CUDA or OpenCL libraries, VampirTrace can log the occurrence of these CUDA calls on the host and can add more semantics in the trace file to the calls as needed by: • creating a thread for each used GPU device (or stream in case of concurrently running kernels), •
assigning a data transfer between host and device memory with the same properties as an MPI message, so that the log record can also hold the amount of data transfered which can be used later on to calculate transmission rates or message statistics, and
enclosing asynchronous events like kernel launches and asynchronous memory copies with CUDA events and use these timestamps to log the tasks execution time on the previously created GPU/stream thread. This approach will produce perfectly valid trace files that can be analyzed without changes to the visualization tool Vampir. There are, however, two shortcomings to address. First, the reuse/abuse of already existing metrics (MPI messages, threads) pollutes the statistics for those metrics with the added GPU events. A workaround for this is the creation of process/thread and message groups that can be individually selected using the filter mechanism in Vampir. Second, the introduced CUDA events are limited in how many can be outstanding (not yet read) at any time. •
TABLE I A PORTION OF CUDA EVENTS AVAILABLE ON G E F ORCE GTX 480 AND T ESLA C870 DEVICES . Event Code 0x44000000 0x44000006 0x44000007 0x4400000b 0x4400000c 0x4400002e 0x4400002f 0x44000034 0x44000037 0x44000038 0x44000039
Symbol CUDA.GeForce_GTX_480.gpc0.local_load CUDA.GeForce_GTX_480.gpc0.branch CUDA.GeForce_GTX_480.gpc0.divergent_branch CUDA.GeForce_GTX_480.gpc0.active_cycles CUDA.GeForce_GTX_480.gpc0.sm_cta_launched CUDA.Tesla_C870.domain_a.tex_cache_hit CUDA.Tesla_C870.domain_a.tex_cache_miss CUDA.Tesla_C870.domain_b.local_load CUDA.Tesla_C870.domain_b.branch CUDA.Tesla_C870.domain_b.divergent_branch CUDA.Tesla_C870.domain_b.instructions
CUPTI callbacks for CUDA runtime and driver API functions are an alternative for the VampirTrace library tracing approach, which is currently used to get the runtime of CUDA API functions. As the tested CUPTI implemenation does not yet support kernel callbacks, the callback method cannot be used to get timing information of CUDA kernels in an asynchronous manner. However, performance counters are accessed by VampirTrace via the CUPTI API, in order to get more information about kernel execution. If this feature is enabled, a synchronization is done after every kernel to gather the performance counters and to ensure, that no other kernel is running on the device, which could have an impact on the counter values. The limitations induced by the reuse of metrics is, however, still an issue. This is a trace file format limitation and will solved by the next generation infrastructure OTF2 and ScoreP [15]. C. TAU Performance System TAU [3] provides scalable profile and trace measurement and analysis for high-performance parallel applications. During the last two years, we first developed prototypes of TAUcuda that used synchronous and event queue approaches [16], and then applied an experimental Linux device library from NVIDIA which provided extensive callback capabilities [17]. Those efforts have now been translated into the current support in TAU for CUDA and OpenCL described below. TAU has tools for source instrumentation, compiler instrumentation, and library wrapping that allows CPU events to be easily observed. In particular, they allow library wrapping of the CUDA runtime/driver API and preloading of the wrapped library prior to execution. Then, each call made to a runtime or driver routine is intercepted by TAU for measurement before/after calling the actual CUDA routine. TAU library interposition happens dynamically with the Linux LD_PRELOAD mechanism and can be used on an un-instrumented executable. Such features are commonly used in other performance tools. For instance, VampirTrace also applies the LD_PRELOAD mechanism with the CUDA libraries [10]). Just as when tracing events across multiple nodes clock synchronization is needed to correct any time lag between the CPU and the GPU. This is accomplished by measuring simultaneously (or as nearly as possible) at a synchronization point the time on CPU and the time on the GPU. The GPU
Long Description # executed local load instructions per warp on a multiprocessor # branches taken by threads executing a kernel # divergent branches within a warp # cycles a multiprocessor has at least one active warp # thread blocks launched on a multiprocessor # texture cache misses # texture cache hits # local memory load transactions # branches taken by threads executing a kernel # divergent branches within a warp # instructions executed
time can be obtained at the synchronization event which has just occurred. By measuring the difference between these two times we can measure the clock lag between the CPU and GPU. The cuLaunch or cudaLaunch function parameters do not contain information about either the name of the kernel being launched or the stream on which it will be executed. In order to retrieve this information both TAU and VampirTrace wrap the __cudaRegisterFunction call. This routine is guaranteed to occur right before each kernel launch so the information contained in its arguments can be applied to the forthcoming cuLaunch/cudaLaunch (however __cudaRegisterFunction can occur independently of a subsequent kernel launch). Here, there is a small difference between TAU and VampirTrace. TAU will only record the occurrences of a kernel if both __cudaRegisterFunction and its associated launch are intercepted. VampirTrace on the other hand will record the __cudaRegisterFunction regardless and if a launch is not subsequently issued—the duration of this kernel event will be the time spent in __cudaRegisterFunction. Regardless of how the CPU events are instrumented, TAU gathers GPU-related events via the event queue method for both CUDA and OpenCL (support is in development) and the callback method section (for OpenCL). TAU offers parallel profiling for GPU-based heterogeneous programs, in addition to tracing. Profile measurement raises an interesting problem for linking GPU kernel to its launch points in the code. Whereas VampirTrace is able to generate trace events that can associate in time GPU kernel event with CPU events, GPU kernel profiling needs extra measurement support to contextualize the kernels events in relation to CPU execution. To associate the GPU operation to the application thread that invokes the CUDA driver routine, we retrieve the current TAU event stack (aka, the TAU context), which represents the nested CPU events that TAU is measuring at the time of the kernel launch. In this way, TAU can distinguish kernels launched from different parts of the application. This is done for both CUDA and OpenCL measurement. TAU’s parallel profile analysis tool, ParaProf, has been updated to present heterogeneous performance events with context information included. In addition, TAU utilizes the OpenCL callback feature included in specification 1.1[9]. In order to use this feature
���� �����
���
�� �
���� �����
�
�������� �������
�������
����� � � � �������� ��� �
���������
�������� Fig. 6.
���� � �
���� �
Tools interoperability from data collection to performance analysis.
a few adjustments needed to be made. The specification gives no conditions on when a callback will be entered and more importantly does not insist that be callback be thread-safe. It is possible then for a kernel callback to occur during another kernel’s callback and thereby risking that a kernel’s enter event could be invoked before the exit of the previous kernel. This would violate the principle of well-nested events in TAU, so thread locking was added so that each time a callback is entered a lock is set atomizing each callback. D. Tool interoperability The tool implementations demonstrate methods for heterogeneous performance measurement. However, it is important that the tools provide effective solutions for users. The different measurement capabilties covered might be used for different experiments depending on the performance evaluation goals. Tool interoperability is important for this purpose. Figure 6 show how the methods and tools work together to provide heterogeneous performance information to the user. Reading downward, the three sources of information about GPUs – CUPTI, CUDA, and OpenCL – are tapped in different ways by each tool and after some post-processing of the data (if needed) the performance data can be view in parallel profile or trace display forms. In the next section we show how the tools, using these methods, are applied to heterogeneous GPU applications. V. E XPERIMENTS There are various ways in which GPUs can be used in heterogeneous applications and the measurement methods and tools discussed above provide the means to observe performance in these different cases. Here we present several application experiments to highlight both the different execution scenarios and the capabilities of the tools. Our premise in this paper has been that the heterogeneous challenge with GPUs is in capturing host-GPU interactions and GPU performance at the node-level, and then integrating that performance information with the intra-node and inter-node perspectives. A. Multiple GPU Test First let us consider a case where multiple GPUs are used by an application running on a single node. This quickly tests the tools’ ability to properly measure performance of
the different GPU devices, each with a different context controlled by a separate application thread. The NVIDIA SDK[18] includes the program “simpleMultiGPU” that we can use for this purpose. One main thread spawns multiple solverThreads, each launching a single reduceKernel on a different GPU device. Using synchronous instrumentation with CUDA library wrappers, we ran the program on one Keeneland [19] node with three Tesla C2070 (Fermi) GPUs to generate a TAU profile. Figure 7 shows the TAU overview profile for the main thread, each solverThread, and the GPU reduceKernel (labeled as threads 4, 5, 6). The figure further shows a comparison of the solverThread performance for cudaMalloc and cudaSetDevice, and a detailed listing of one solverThread/reduceKernel pair. Here we see the relationship between the spawning cutStartThread routine and the SolverThread, and the cudaLaunch initiatiation of the reduceKernel (.TAU application represents the CPU calling context). Notice the interesting performance behavior of cudaMalloc which is executed soon after each thread starts. Its time is large for each thread and appears to increase from thread to thread. The reason we discovered for this behavior is the high initial cost for creating a GPU device context. It also suggests that the GPU context creation is not re-entrant. Indeed, this is the case. For our purposes, the experiment demonstrates the measurement’s ability to observe the different operations associated with a simple multi-GPU program, include this unexpected result. B. Symmetric Matrix Vector Product (SYMV) A more realistic example is a library routine to compute a symmetric matrix vector (SYMV) product. We consider two implementations, from the CUBLAS [5] and MAGMA [6], [20] libraries, and analyze their performance with the help of PAPI counter measurements using CUPTI. This example is on a memory-bound kernel. In contrast to the simpler case when the matrix is general, exploiting the symmetry is more challenging for optimization on GPUs as the computation would involve irregular data accesses. We are interested in seeing how well symmetry is exploited and if bank conflicts and branching (inherent for irregular computations) are reduced. As the matrix is symmetric, the SYMV kernel can be implemented by accessing each element of the lower (or correspondingly upper) triangular part of the matrix only once. Thus, for an N × N matrix A the SYMV kernel can be implemented ideally using N 2 /2 element reads. An alternative is not to explore the symmetry and have implementation similar to the general matrix vector product, which results in N 2 element reads. Since the SYMV is memory bound, the former choice - implemented in the MAGMA SYMV kernel - is expected to be twice as fast than the latter. The MAGMA SYMV uses the symmetry by organizing the computation so that any sub-matrix Ai , read by thread block i (e.g., from just the lower part of A), is used in the computation associated not only with Ai but with ATi as well. However, to accomplish this, additional global memory workspace is used to store
Fig. 7. TAU performance profile of SimpleMultiGPU program with three GPUs. Upper left: overall profile showing CPU threads and proxy GPU threads. Lower left: CPU thread comparison for three events. Right: breakout of profiles for the main thread, one solverThread, and the associated GPU. Times are in milliseconds.
Matrix
Size
Matrix
Size
Fig. 8. Number of read requests from L1 to L2 (green), which is equal to the number of read misses in L2 (orange); number of read requests from L2 to DRAM (black) for the CUBLAS_dsymv kernel (left) and the MAGMA_dsymv kernel (right).
intermediate results. In particular, the workspace is N/64 vectors of size N each (here 64 comes from the size of the thread block size used in the computation). These intermediate N 2 /64 elements are first computed and then written back to the global memory, and in a second step read from the global memory and reduced to a single vector, which is the final result of the computation. Thus, although N 2 /2 element reads are reduced, N 2 /64 writes (and N 2 /64 reads) are introduced. We ran experiments using the CUBLAS_dsymv and MAGMA_dsymv kernels and varied the size of the matrix to observe the effects of cache behavior on the Tesla S2050 (Fermi) GPU. Figures 8 and 9 report the CUDA performance counters for the read and write behavior for these experiments as measured by PAPI. As expected the number of read requests and misses is reduced by a factor of 2 in the MAGMA_dsymv kernel which is due to exploitation of the symmetry of the matrix. Also the increasing write requests are apparent from the counter data. Furthermore, from the PAPI measurements we were able to detect shared cache bank conflicts in the MAGMA_dsymv kernel. Those are due to addresses for two or more shared memory requests that fall in the same memory bank. Figure 10 (left) reports the number of bank conflicts for different matrix sizes. To address those conflicts, we applied array padding which causes cache lines to be placed in different
l2_subp0_write_sector_misses
10,000
l2_subp0_write_sector_queries
10,000
Counts
1,000
100,000
100
l2_subp0_write_sector_misses
l2_subp0_write_sector_queries
1,000
100
10
1
1
6
42 2
56 4
75 3 1,
00 5 1,
33 9 1,
78 5 2,
37 8 3,
16 6 4,
21 6 5,
61 3 7,
47 3
10
Matrix
Size
MAGMA_dsymv
-_subp0_write_sectors
31
0
31 6
42 2
56 4
75 3 1,
00 5 1,
33 9 1,
78 5 2,
37 8 3,
16 6 4,
21 6 5,
61 3 7,
47 3
31 6
42 2
56 4
75 3 1,
00 5 1,
33 9 1,
78 5 2,
37 8 3,
16 6 4,
21 6 5,
61 3 7,
47 3
0
l2_subp0_read_sector_queries
4
3
00 5 1,
33 9 1,
78 5 2,
37 8 3,
16 6 4,
21 6 5,
61 3 7,
47 3
500,000
l2_subp0_read_sector_misses
1,
1,000,000
500,000
Counts
1,000,000
Counts
1,500,000
2
2,000,000
75
l2_subp0_read_sector_queries
-_subp0_write_sectors
6
l2_subp0_read_sector_misses
1,500,000
CuBLAS_dsymv
100,000
56
2,000,000
MAGMA_dsymv
-_subp0_read_sectors
42
2,500,000
31
CuBLAS_dsymv
-_subp0_read_sectors
Counts
2,500,000
Matrix
Size
Fig. 9. Number of write requests from L1 to L2 (green), which is equal to the number of write misses in L2 (orange); number of write requests from L2 to DRAM (black) for the CUBLAS_dsymv kernel (left) and the MAGMA_dsymv kernel (right).
Fig. 10. Number of L1 shared bank conflicts in the MAGMA_dsymv kernel for medium to large matrix sizes (left); Performance of MAGMA_dsymv kernel with and without shared cache bank conflicts (right).
cache locations and consequently were able to completely eliminate shared cache bank conflicts. This minor change to the kernel code also promotes a performance improvement of 1 Gflop/s for larger matrix sizes. Figure 10 (right) shows the performance of the MAGMA_dsymv kernel with bank conflicts (dashed) versus the performance of the modified MAGMA_dsymv kernel with array padding which eliminates bank conflicts (solid). Note, we only compare the performance for larger matrix sizes since the number of bank conflicts is 0 or relatively low for smaller and medium matrix sizes. Figure 11 highlights others aspects - branches and instruction rate of execution - of why MAGMA performs more efficiently.
2$345,61�,
(!!"
-./012"
!"#$%&'()*#+$,
'!!"
31431"
&!!"
%!!"
$!!"
#!!"
%#(" %&)" %)%" &$$" &('" '#$" '(&" ($#" ()&" *'%" )$+" +#%" #,!!'" #,#!(" #,$#*" #,%%+" #,&*&" #,($$" #,*)'" #,+(&" $,#(#" $,%*)" $,(#(" $,)*)" %,#((" %,&)%" %,)%$" &,$#(" &,(%)" ',#!$" ',(#%" (,#*'" (,*+%" *,&*%" ),$$#"
!"
!-%&".,/"01,
Fig. 11. Left: Also due to the exploitation of the symmetry of the matrix, the number of branches executed in the MAGMA_dsymv kernel is reduced by a factor of ∼ 30 compared to the number of branches in the CUBLAS_dsymv kernel. Right: We also see that MAGMA is more efficient in instruction access.
C. SHOC Benchmarks – Stencil2D The Scalable HeterOgeneous Computing (SHOC) [4] benchmark suite provides a set of testcases for our heterogeneous performance tools. SHOC benchmarks are written in both CUDA and OpenCL, and they target both single-node and multi-node execution. We have tested our tools on the majority of the SHOC programs. Here we present results from the Stencil2D application which compute a two-dimensional nine-point stencil calculation on multiple GPUs using MPI. An event queue method with library wrapping and PAPI/CUPTI was used on the CUDA version of Stencil2D for VampirTrace measurement. Two nodes of the Keeneland system were use to capture execution traces. We ran two MPI processes on each node with one GPU per process. Figure 12 shows the timeline of a portion of the Stencil2D execution, with CPU-GPU memory transfers and CPU-CPU communication clearly represented. The CPU and GPU counters were accessed at each event and recorded in the trace, allowing rates to be determined for L1_shared_bank_conflict, threads_per_kernel and threads_per_block, as shown for Process 0, CUDA[0] in the figure. We also ran the OpenCL version of Stencil2D on eight nodes of the Keeneland cluster using 24 MPI processes, each attached to a single GPU device. Figure 12 shows the both a trace (captured by VampirTrace) of the benchmark during a couple of iterations as well as the StencilKernel execution time profile across the 24 GPUs, as captured and presented by TAU. Unlike some other SHOC benchmarks, Stencil2D is not embarrassingly parallel so it must distribute the work across each GPU device as evenly as possible. The figure shows a reasonable load balance for the test problem. In this measurement, TAU applied OpenCL’s support for events. VI. R ELATED W ORK While the interest in heterogeneous parallel computing is growing, we are not aware of other published work on scalable heterogeneous performance tools. That said, there have been significant efforts by the GPU manufacturers to develop tools for GPU debugging and performance analysis. The NVIDIA Visual Profiler [21] is a cross-platform performance profiling tool for developers optimizing CUDA C/C++ and OpenCL applications on Linux, Mac OS X, and Windows. It allows visual analysis of results to identify potential
performance issues, compare results across multiple sessions, and GPU hardware performance metrics to understand optimizations. For Windows, the NVIDIA Parallel Nsight [22] tool provides additional performance profiling and analysis capabilities integrated into Microsoft Visual Studio. Similarly, the AMD GPU PerfStudio 2 [23] tool offers profiling and tracing features to identify performance and algorithm issues. All API calls can be measured for each application thread. These tools are powerful, but also proprietary and targeted for the most part to graphics development and single GPU environments. They do not directly provide interfaces that can be leveraged by intra-node/inter-node parallel tools to capture integrated performance views. VII. C ONCLUSION AND F UTURE W ORK Understanding the performance of scalable heterogeneous parallel systems and applications will depend on addressing new challenges of instrumentation, measurement, and analysis of heterogeneous components, and integrating performance perspectives in a unified manner. The research presented here demonstrates support for GPU performance measurement with CUDA and OpenCL in three well-known performance tools PAPI, VampirTrance, and the TAU Performance System. The development work is being released simultaenously with each tool with the submission of this paper and the availability of CUPTI in CUDA 4.0. The paper introduces computation and measurement models in order to ground the discussion on tool implementation. The measurement techniques supported by the tools are intended to be practical solutions for these approaches with respect to present technology. The integration with PAPI, VampirTrace, and TAU also means that the heterogeneous measurement will scale to large heterogeneous systems. However, this does not mean the solutions are complete or optimal. For instance, CUPTI currently supports callbacks for CUDA runtime and driver APIs, but not kernels. This limits the ability to time CUDA kernels in an asynchronous manner. Also, it is certainly the case that heterogeneous architecture and software advances will deliver new modes of operation that measurement techniques must address. NVIDIA’s CUDA 4.0 release will allow implicit memory transfers to take place when data is not resident, sharing of GPUs across multiple threads, and use of all GPUs in the system concurrently from a single host thread. Next-generation GPU devices will additionally have more complex modes of execution that developers will likely want to track. This may require kernel code instrumentation kernel code to observe performance. In the future, we plan to increase the collaboration between the teams to deliver more seamless support across the tools. CUDA 4.0 will be the first release of CUPTI and we hope this will create opportunities for user engagment. As mentioned, this is will spur measurement enhancement. There are also plans for improving CUPTI in future releases. Another area of interest is automatic instrumentation capabilities for synchronous and event queue methods. We plan to work with instrumentation technology from TAU for this purpose.
Fig. 12. Upper left: Vampir trace display of Stencil2D execution on 4 MPI processes with 4 GPUs. Lower left: a trace showing the counts for 3 different GPU counters which spike during the execution of kernel; these convey important performance characteristics of the kernel execution. Upper center: summary of the total execution time for difference groups of events. Lower center: matrix showing the communication bandwidth amongst CPUs and their associated GPU (each CPU only communicates with a single GPU). Right: TAU profile of the OpenCL version of the Stencil2D application run on the Keeneland platform with 24 MPI processes and GPUs. The kernel execution times are generally well-balanced across the GPUs.
ACKNOWLEDGMENT The research work reported here was supported by the National Science Foundation (Grant #: OCI-0722072), the Department of Energy (Grant #s: DE-SC0005360, DESC0001777, DE-FG02-09ER25873), and an NVIDIA Professor Partner award (UO, Malony), a CUDA Research Center (TU Dresden), and a CUDA Center of Excellence (UTK, Innovative Computing Laboratory). R EFERENCES [1] Performance Application Programming Interface (PAPI). [Online]. Available: http://icl.cs.utk.edu/papi/ [2] A. Kn¨upfer, H. Brunst, J. Doleschal, M. Jurenz, M. Lieber, H. Mickler, M. S. M¨uller, and W. E. Nagel, “The Vampir Performance Analysis Tool-Set,” in Tools for High Performance Computing, M. Resch, R. Keller, V. Himmler, B. Krammer, and A. Schulz, Eds. Springer Verlag, Jul. 2008, pp. 139–155. [3] S. Shende and A. D. Malony, “The TAU Parallel Performance System,” International Journal of High Performance Computing Applications, vol. 20, no. 2, pp. 287–311, 2006. [4] A. Danalis, G. Marin, C. McCurdy, J. Meredith, P. Roth, K. Spafford, V. Tipparaju, and J. Vetter, “The Scalable HeterOgeneous Computing (SHOC) BenchmarkSuite,” in Third Workshop on GeneralPurposeComputation on Graphics Processors (GPGPU 2010), Mar. 2010. [5] (2011, Jan.) CUBLAS Library (CUDA Toolkit 3.2). NVIDIA. [Online]. Available: http://developer.nvidia.com/object/cuda 3 2 downloads.html [6] Matrix Algebra on GPU and Multicore Architectures (MAGMA). [Online]. Available: http://icl.cs.utk.edu/magma/ [7] D. B. Kirk and W. mei W. Hwu, Programming Massively Parallel Processors: A Hands-on Approach. Morgan Kaufmann, 2010. [8] NVIDIA. (2011) CUDA Zone. CUPTI documentation will be provided with the CUDA 4.0 release. [Online]. Available: http: //www.nvidia.com/object/cuda home new.html [9] K. O. W. Group. (2010, Sep.) The OpenCL specification. [Online]. Available: http://www.khronos.org/registry/cl/specs/opencl-1.1.pdf [10] R. Dietrich, T. Ilsche, and G. Juckeland, “Non-intrusive Performance Analysis of Parallel Hardware Accelerated Applications on Hybrid Architectures,” in First International Workshop on Parallel Software Tools and Tool Infrastructures (PSTI 2010). Los Alamitos, CA, USA: IEEE Computer Society, 2010, pp. 135–143.
[11] S. Browne, J. Dongarra, N. Garner, G. Ho, and P. Mucci, “A Portable Programming Interface for Performance Evaluation on Modern Processors,” International Journal of High-Performance Computing Applications, vol. Vol. 14, No. 3, pp. 189–204, 2000. [12] D. Terpstra, H. Jagode, H. You, and J. Dongarra, “Collecting Performance Data with PAPI-C,” Tools for High Performance Computing 2009, pp. 157–173, 2009. [13] M. S. M¨uller, A. Kn¨upfer, M. Jurenz, M. Lieber, H. Brunst, H. Mix, and W. E. Nagel, “Developing Scalable Applications with Vampir, VampirServer and VampirTrace,” in Parallel Computing: Architectures, Algorithms and Applications, ser. Advances in Parallel Computing, C. Bischof, M. B¨ucker, P. Gibbon, G. R. Joubert, T. Lippert, B. Mohr, and F. Peters, Eds., vol. 15. IOS Press, 2008, pp. 637–644. [Online]. Available: http://www.booksonline.iospress.nl/Content/View.aspx?piid= 8455 [14] H. Brunst, D. Hackenberg, G. Juckeland, and H. Rohling, “Comprehensive Performance Tracking with Vampir 7,” in Tools for High Performance Computing 2009, M. S. M¨uller, M. M. Resch, A. Schulz, and W. E. Nagel, Eds. Springer Berlin Heidelberg, 2010, pp. 17–29. [15] (2011, Mar.) Score-P – HPC Profiling and Event Tracing Infrastructure. [Online]. Available: http://www.vi-hps.org/projects/score-p [16] S. Mayanglambam, A. Malony, and M.Sottile, “Performance Measurement of Applications with GPU Acceleration using CUDA,” in International Conference on Parallel Computing (PARCO 2009), Sep. 2009. [17] A. Malony, S. Mayanglambam, S. Biersdorff, and W. Spear, “An Experimental Approach to Performance Measurement of Heterogeneous Parallel Applications using CUDA,” in International Conference on Supercomputing (ICS 2010), Jun. 2010. [18] (2011, Jan.) CUDA Toolkit 3.2. [Online]. Available: http://www.nvidia. com/object/cuda develop.html [19] Keeneland: National Institute for Experimental Computing. [Online]. Available: http://keeneland.gatech.edu/ [20] S. Tomov, J. Dongarra, and M. Baboulin, “Towards dense linear algebra for hybrid GPU accelerated manycore systems,” Parallel Computing, vol. 36, pp. 232–240, Jun. 2010. [Online]. Available: http://dx.doi.org/10.1016/j.parco.2009.12.005 [21] (2011) Visual Profiler. NVIDIA. [Online]. Available: http://developer. nvidia.com/object/visual-profiler.html [22] (2011) Parallel Isight. NVIDIA. [Online]. Available: http://developer. nvidia.com/object/nsight.html [23] (2011) GPU PerfSudio 2. AMD. [Online]. Available: http://developer. amd.com/gpu/PerfStudio/