thread hardware or OS resource usage over time looking for performance sub-
optimalities, such as .... In. ISCA, June 2012. http://arcade.cs.columbia.edu/
harmony.
Parallel Scaling Properties from a Basic Block View Melanie Kambadur
Kui Tang
Joshua Lopez
Martha A. Kim
[email protected]
[email protected]
[email protected]
[email protected]
Department of Computer Science Columbia University New York, New York
1.
INTRODUCTION
A host of factors determine an application’s performance, including algorithmic and design choices, program inputs, source language, thread library selection, operating system configurations, and the hardware platform on which the program is run. Many tools and measurement methodologies are available to help identify parallel performance pathologies. The tools vary widely in the type and form of information they reveal and in their implementations, but they generally employ one of two broad strategies. The first strategy is to look for inefficiencies at important and commonly known sites such as memory access and locking points, or along critical paths. The second strategy is to profile perthread hardware or OS resource usage over time looking for performance sub-optimalities, such as cache misses or low CPU utilization. This work takes a third perspective, evaluating program scalability per region of code. This is accomplished through This research was supported by the National Science Foundation (CNS-1117135). Copyright is held by the author/owner(s). SIGMETRICS’13, June 17-21, 2013, Pittsburgh, PA, USA. ACM 978-1-4503-1900-3/13/06.
Dynamic Block Execution Trace Thread Count (TC) 1 2 3 4 5
A B
C
Time
D
D
E
E
D
D
E
E
Basic Block
Parallel software; scaling; basic block vectors
Worker4
Keywords
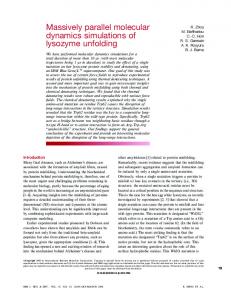
Background on Parallel Block Vectors. The parallel block vectors [1], or PBVs, on which the rest of this work is built, measure application-level parallelism each time a basic block is executed. As a parallel program runs, the number of active threads fluctuates, moving it through different parallelism phases that are defined by the number of threads working concurrently. PBV profiles capture the dynamic basic block composition of these phases. Figure 1 shows a simple, data-parallel example with five basic blocks: A, B, and C in main and D and E in worker. When the program is executed, the number of parallel threads will change over time. Of the four executions of block D in this example, two were during a three-thread phase and two during a five-thread phase.
Worker3
D.2.8 [Software Engineering]: Metrics
2. BASIC BLOCK VIEW OF SCALING
Worker2
Categories and Subject Descriptors
fine-grained, application-wide profiling, where the only activity monitored is the total number of threads executing. This approach reveals how each basic block in a program scales as parallelism increases. Such “micro-scaling metrics” can be aggregated or cross-referenced with other sources of information (e.g. control or data flow graphs, or compiler debug information) to reveal the scaling properties of each line of code, function, algorithm, critical section, or data structure. The metrics can be simply and efficiently collected using techniques described in this paper, and require no software annotations, hardware support, or software simulation.
Worker1
As software scalability lags behind hardware parallelism, understanding scaling behavior is more important than ever. This paper demonstrates how to use Parallel Block Vector (PBV) profiles to measure the scaling properties of multithreaded programs from a new perspective: the basic block’s view. Through this lens, we guide users through quick and simple methods to produce high-resolution application scaling analyses. This method requires no manual program modification, new hardware, or lengthy simulations, and captures the impact of architecture, operating systems, threading models, and inputs. We apply these techniques to a set of parallel benchmarks, and, as an example, demonstrate that when it comes to scaling, functions in an application do not behave monolithically.
Main
ABSTRACT
A 1 0 0 0 0 B 0 0 0 0 1 C 0 0 0 0 1 D 0 0 2 0 2 E 0 0 2 0 2
Parallel Block Vector (PBV) Profile
Figure 1: PBV profiles map basic blocks to dynamic execution counts per-parallelism phase.
100%
100%
Perfect Moderate Poor Negative Non-scaling Unexec
Part. Neg. M
0
2
od er at e
4
% Static Basic Blocks
Non-Scaling 75%
50%
75%
50%
25%
25%
Poor
8 Thread Count
% Static Basic Blocks
Runtime (linear scale)
Negative
0%
Perfect 16
0%
bla bo fac flu str sw ck dyt es ida eam ap sc ra im nim c tio ho ck ate lust ns les er Benchmarks
Sim sp pa str Po Sim ma Lo ou ga pk se loc Str eed rsec eam ints Str in calS tcen in med lectf alS ea y ea _b Clu ian ea ear ea ter sib ch m m_ arr st rch ID le_ ier er rea Su s _w fas b d ait t Functions in streamcluster
Figure 3: Static basic block break- Figure 4: With respect to scaling Figure 2: Qualitative basic block behavior, functions are not monodown by scaling behavior. scaling categories lithic. Block-level Scaling. Block-level scaling metrics can be constructed from PBV profiles collected for a program at increasing available thread counts, thereby revealing how each basic block scales — or does not — to higher working thread counts. Model of Runtime. Each basic block in a PBV profile can be traced back to the assembly code, enabling us to identify the instructions that compose the block and to model execution time. Using a simple model that counts the number of dynamic instructions executed by a particular region of the application divided by the number of working threads this model estimates the parallel runtime of each block. Across the Parsec benchmarks, our approximation has a correlation coefficient of 0.9502 (min = 0.803). Scaling Classification. Using multiple PBVS collected at increasing thread counts and the model of program runtime, one can classify how each basic block in the application scales. Figure 2 suggests five useful classes: • Perfectly scaling blocks’ runtimes decrease linearly or superlinearly with the number of threads. • Moderately scaling blocks come within 50% of perfect. • Non-scaling blocks’ runtimes do not change as threads increase. • Poorly scaling blocks scale somewhat, but not enough to be considered moderate. • Negatively scaling blocks have runtimes that increase as threads are added. • If a block’s runtime increases, but never exceeds the serial runtime, we call it partly negatively scaling.
3.
EXPERIMENTS
Application-wide Block Scaling. To get a quick overall snapshot of a parallel program’s scaling properties, a user can check how much of the program’s source code falls into each of the qualitative micro-scaling categories. This view reveals whether scaling deficiencies are isolated to a small part of the code base or whether they are pervasive throughout a program. Figure 3 shows how the static basic blocks in Parsec benchmark applications are distributed amongst the six micro-scaling categories. Examining fluidanimate — the fourth bar from the left of the figure — we see that out of its 518 blocks, roughly 30% are unexecuted, 32% do not scale at all, 0.5% exhibit negative scaling, and 16.5% and
21% are poorly and moderately scaling, respectively. None of the blocks are perfectly scaling, which indicates that no part of the program consistently executes at the full number of available threads. Per-Function Micro-scaling. Because basic blocks are so numerous and not typically exposed to the programmer, it is often preferable to group blocks into more congruous entities. Many tools profile in terms of functions, and while functions are natural for programmers to reason about, they might not be the most appropriate boundary for delineating scalability properties. In particular, functions are programmer constructs that, despite their name, do not always delineate actual functionality. Here, we classified the static blocks in each function according to their scaling properties. As an example, Figure 4 shows the distribution of blocks in streamcluster’s functions. While several functions (e.g., SimStream, LocalSearchSub) are made up of homogeneous blocks (non- and poorly scaling, respectively), most are heterogeneous, comprising blocks from multiple scaling classes. pkmedian, for example, contains blocks from five out of the six categories. Similar patterns were visible in other applications, indicating that functions are not monolithic from a scaling perspective, and that it is important to have analyses that can capture and expose scaling nuances outside of function boundaries. Basic blocks, however, can be recomposed into arbitrary regions of interest including loops, critical sections, algorithms, sets of related functions, or even entire libraries so that a user can focus on relevant code regions to analyze.
4. CONCLUSION Block-level scaling analyses give users a new way to approach multi-threaded performance analysis. This work demonstrates how to construct this perspective and shows how it might be leveraged to analyze the scaling behavior of large, complex applications.
5. REFERENCES [1] M. Kambadur, K. Tang, and M. A. Kim. Harmony: Collection and analysis of parallel block vectors. In ISCA, June 2012. http://arcade.cs.columbia.edu/harmony.