Parameter Estimation for Cell Cycle Ordinary Differential Equation (ODE) Models using a Grid Approach Roberta ALFIERI a,b,1, Ettore MOSCA a,c, Ivan MERELLI a, Luciano MILANESI a,b a Institute for Biomedical Technology, National Research Council, Milan, Italy b Consorzio Interuniversitario Lombardo per L'Elaborazione Automatica, Milan, Italy c University of Milano-Bicocca, Milan, Italy
Abstract. Cell cycle is one of the biological processes that has been investigated the most in the recent years, this due to its importance in cancer studies and drug discovery. The complexity of this biological process is revealed every time a mathematical simulation of the processes is carried out. We propose an automated approach that mathematically simulates the cell cycle process with the aim to describe the best estimation of the model. We have implemented a system that starting from a cell cycle model is capable of retrieving from a specific database, called Cell Cycle Database, the necessary mathematical information to perform simulation using a grid approach and identify the best model related to a specific dataset of experimental results from the real biological system. Our system allows the visualization of mathematical expressions, such as the kinetic rate law of a reaction, and the direct simulation of the models with the aim to give the user the possibility to interact with the simulation system. The parameter estimation process usually implies time-consuming computations due to algorithms of linear regression and stochastic methods. In particular, in the case of a stochastic approach based on evolutionary algorithms, the iterative selection process implies many different computations. Therefore, a large number of ODE system simulations are required: the grid infrastructure allows to distribute and obtain the best model that fits the experimental data. The computation of many ODE systems can be distributed on different grid nodes so that the execution time for the estimation of the best model is reduced. This system will be useful for the comparison of models with different initial conditions related to normal and deregulated cell cycles.
Keywords. Cell cycle models; parameter estimation; grid platform.
Introduction The cell cycle is a crucial event in the life of every organism. It consists of a series of coordinated and oscillating steps which allow the cell to grow and duplicate correctly. It is an important biological process frequently studied in correlation to tumour disease
1
Corresponding Author: Roberta Alfieri; E-Mail:
[email protected]
and it is considered a valuable target for drug discovery. Thus, the typical systems biology approach can be applied to study this process in order to verify the impact that differently regulated genes can have in normal and cancer cells. The identification of cell cycle models has been frequently reported in the recent literature: in particular cell cycle models for the budding yeast S. cerevisiae are more advanced [1] but also detailed models for mammalian cell cycle are forthcoming [2-4]. The ultimate objective of these studies consists in the mathematical simulation of different biological processes which have been described by a set of kinetic equations that define the biochemical reactions, and dynamic equations, structured as Ordinary Differential Equations (ODE) system, that quantify the biological processes. The kinetic equations require initial parameters, such as the rate constants for each reaction, and also the initial concentration of the model species. The mathematical simulation of the system can be performed via many different mathematical software, both licensefree such as XPPAUT and Copasi or requiring license, like Mathematica and MatLab. For the simulation of a biological process it is necessary to define the equations describing the system and to set the initial parameters required for the calculation. The simulation of a single set of equation can be performed on a single workstation because the numerical integration of an ODE system is not very time consuming. On the other hand, High Performance Computing techniques, like grid, are extremely useful to perform the parameter estimation that is the evaluation of the best set of parameters which define the model relating to a specific experimental dataset. The parameter values have high impact on the accuracy of the models in representing real biological systems but these values are difficult to estimate experimentally. Generally the estimation of the kinetic parameters in silico is performed by fitting the data by computing a number of ODE systems with different parameters and verifying the best solution. This problem has been recently faced by Zwolak et al. [5] who implemented an algorithm through which the estimation of the best set of parameter fitting the experimental data is possible. The parameter estimation is performed using ODRPACK [6] which finds an estimate for the rate constant by minimizing the weighted orthogonal distance between the experimental data set and the calculated model. A different way to computationally solve the problem of the parameter estimation has been suggested by Dhar et al. [7]. The technology implemented relies on an Adaptive Swarm Algorithm [8], which is based on simulation of social behaviour in a flock of birds. This algorithm is highly suitable for constrained multi-objective optimization problems. The models are simulated over the grid through GridX meta scheduler and Globus.
1. Methods In the context of a systems biology study of the cell cycle process, we developed a system for the automatic computation of cell cycle models. Our system relies on the Cell Cycle Database, a resource which integrates the most useful information about genes, proteins and models related to the budding yeast and mammalian cell cycle processes. Our computational system allows users to solve the ODE system which mathematically describes the biological system using grid technology. The aim of this work is the development of a parameter estimation pipeline on the top of this system, in
order to find the best model that fits the experimental data. Furthermore, the system integrates mathematical data for each model, such as kinetic and dynamic equations, the initial parameters and the initial model components concentrations. 1.1 The Cell Cycle Database The pipeline designed for the model simulation relies on the relational database named Cell Cycle Database [http://www.itb.cnr.it/cellcycle], an integrative resource which collects the main information regarding genes and proteins involved in budding yeast S.cerevisiae and mammalian cell cycle process. A specific section of the database, which is dedicated to store the main information related to the yeast and mammalian cell cycle models published in the recent literature, allows the user to interface with the pipeline for model simulation. The implemented system is able to provide information on the published models, such as the detailed publication data (e.g. authors, PubMed ID, abstract, journal information), the diagram of the model and the related XML file. 1.2 Model Simulation Engine The pipeline is composed of a series of PHP scripts that allow the user to extract information both from model repositories and from the XML file which describes the whole model. Moreover, these scripts interface users with the model simulation input in order to choose the parameters of the computation and retrieve the model behaviour related to the given conditions. The simulation software chosen for our system is XPP [10], a computational device frequently used in systems biology numerical calculations. XPPAUT allows the solution of differential equations using many different options for the numerical algorithm. It is widely used for the modelling of different biological pathways [4] and it requires simply formatted input files. XPPAUT is very portable, has a simple input file format and can be run without a GUI: so it is a perfect candidate for solutions using a grid application. 1.3 XML files and model equations Models stored in the Cell Cycle Database are encoded in Systems Biology Markup Language (SBML) [10], an internationally supported and widely used computerreadable format for representing models of biochemical networks. Some SBML models included in the database are manually generated using the JigCell Model Builder software [11], a model editor which allows the construction of biochemical reaction networks in SBML format. Mathematical expressions in SBML are represented using Mathematical Markup Language (MathML) [12] an XML-based language especially created to represent mathematical expressions. Some MathML based components, such as algebraic constraints, assignment and rate rules, function definitions, kinetic laws and stochiometric matrix are crucial to describe a biological pathway mathematically. The models are essentially based on differential equations and they can describe abundances, kinetics and binding affinities of pathway components and their interactions [13]. In this work we consider models based on a system of nonlinear ordinary differential equations (ODE system) in which each Xi state variable (usually species concentrations) can be described by the Eq. (1):
dX i = Fi ( X 1 , X 2 ,..., X n ; p1 , p 2 ,..., pm ); i = 1,..., n dt
(1)
where the function Fi is the rate of change or the rate law of the state variable Xi and pi are parameters of the function Fi. The time course of each state variable is obtained by solving the ODE system which requires a set of initial conditions Xi(t=0). One of the biggest problems of the differential equations approach is the experimental estimation of the numerical values of species initial concentrations and parameters. A way to bypass the experimental determination of these values is by parameter estimation, or curve fitting, even if these techniques need many quantitative and qualitative experimental data against which to fit the parameters. 1.4 The grid platform Using the developed user interface, the computation of the simulation is submitted to a High Performance Computing platform, the grid. This solution plays a key role in the development of a system that must compute a large number of independent ODE system solutions in order to perform parameter estimation on an experimental dataset. In this work we successfully tested the possibility of porting the ODE solver system on the grid, by the creation of an infrastructure able to support users and to perform efficiently the distribution of computation. The developed solution relies on the wide area grid platform of the European EGEE project, a network of several Computing Elements, that are the gateways for the computer clusters on which jobs are performed while the grid core is a set of Resource Brokers delegated for controlling the execution of the different jobs. This grid infrastructure is based on the Globus Toolkit which represents an ideal communication layer between the different grid components. The computational resources are connected to a Resource Broker that routes each job onto a specific Computing Element and takes into account the directives of the submitting script, called JDL. The JDL script, composed using the Job Description Language, specifies the InputSandBox, that lists the files to be submitted to grid, and the OutputSandBox, which are the output files to be retrieved. The software that gives access to the distributed platform is made of a set of tools by which secure communications can be established between the grid infrastructure and the User Interface.
2. Implementation The core of our technology is a PHP library (in the middle of Fig. 1), that creates a pipeline relying on independent engines (at the bottom in Fig. 1) in order to generate web pages for the interaction with users (at the top in Fig. 1). The visualization of the SBML model requires different components: data retrieval from the Cell Cycle Database, the SBML parser and the MathML to HTML converter. The converter itself is a pipeline which accomplishes the translation of mathematical expressions included
in SBML models from MathML to HTML and so makes the their visualization possible to view on a web browser [14 - 17]. Through the interface which allows the setting of initial conditions and XPPAUT internal options, the PHP level starts a simulation using XPPAUT in the grid platform. 2.1 User Interface The simulation system has an interactive interface where users can set different values for species concentration, parameters and XPPAUT internal options. This interface allows users to explore model behaviors starting from different initial conditions or setting the solver in different way, by changing, for example, the integration method. Algebraic rules are listed to lead the user to a correct initialization. In the SBML file model species concentrations and parameters values could be initialized internally by assignment rules: in this case for species or parameters the string “AssignRule” is placed in the input form associated with it. The XPPAUT input file is created by adding users selections to an existent XPPAUT input file, stored in the database, which contains equations and other information for a correct simulation.
Figure 1: The simulation engine workflow. At the bottom, there is the system used to simulate the models; in the middle, the software pipeline that manages the system; at the top, the user interface.
2.2 The distributed approach The user interface works on the top of a set of script that are delegated for job submission, the monitoring and the retrieval of the results. Using this solution, the simulation can be coordinated by a single server, on which the grid User Interface software is installed, obtaining a scalable system according to the grid performance. For each set of ODE system simulation which must be calculated, a grid job is submitted: it means that according to the user parameters selected a JDL script is dynamically generated with the information about the input and the related job requirements. The number of equations which have to be simulated in a specific group is related to the computation time needed for each job and then to the scalability of the system. The jobs are routed by the Resource Broker to the best Computing Element that
is available at the moment. The ODE solver system is deployed on the grid node at job execution time and the results are retrieved to the User Interface from where the execution of the jobs are automatically monitored and, in case of failure, re-submitted to the grid infrastructure. When a simulation job is finished the result can be downloaded and quickly viewed on a 2D plot. A graphical interface allows the users to plot one or more of the species involved in the model on the y axis, while on the x axis generally the time is indicated. Thus, concentration versus time or concentration versus concentration plots can be generated. Graphs are images exported in png file format using Gnuplot [18].
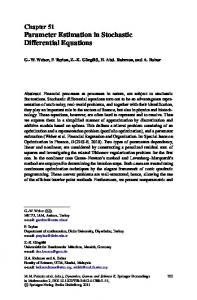
3. Results As test case let us consider a model of G1 to S transition in mammalian cell cycle process [3]. This model is essentially focused on the main key points which characterize the G1 to S transition in mammalian cells: the restriction point R and the progression towards the S-phase. These points involves a small set of proteins, including the transcription factor family of E2F/DP dimers (E2F1-6, DP1 and DP2), the pocket protein family, including the tumor suppressor pRB (retinoblastoma), which are the central regulators of the mammalian cell cycle. In particular, E2F/DP regulate the transcription of a large number of genes which have a crucial role in the G1 to S transition, while pRB has a crucial role as the main inhibitor for the progression if the cell cycle from the G1 phase to the DNA synthesis phase (S-phase). The model requires to be manually written in SBML format using JigCell Model Builder [11]. By accessing the Cell Cycle Database web interface the user can explore and simulate the model. The models stored in our resource can be analyzed by the user from two different point of view: the first concerns the general information relating to the model, mainly regarding the model publication paper, the second focuses mainly on the information related to the SBML model data structure that makes the simulation of the model possible. Using the first possibility of exploration the user can retrieve information related to abstract, model wiring diagram and the list of all the proteins involved in the model which are linked to their Cell Cycle Database entries. The abstract of the paper is directly linked to E-Biosci system [19], a literature search engine developed in order to automatically search the scientific literature based on a description as input query. The E-BioSci system relies on performing a conceptual fingerprinting comparison in several literature databases. On the other hand, browsing the model information from the mathematical point of view, the user can explore the whole SBML data, selecting the different model component to visualize. In case of the G1 to S transition model user can observe 5 unit definitions, 1 compartment, 9 species, 41 parameters, 22 reactions, 2 function definitions and 9 ODEs. An example of the visualization of the equations is shown in Figure 2. The direct simulation of the model is possible through a specific interface, as described before. This interface is composed of four tables which contain species, algebraic rules, parameters and XPPAUT internal options such as total integration time or the integration method. All components are initialized with the default values. Algebraic rules remind the user that some species have constraints on their initial values, while the string “AssignRule” reminds the user that the associated species or
parameter values cannot be initialized because there is an assignment rule defined in the model. When the simulation has been correctly completed, the output retrieving and the results visualization are possible. User can choose the species to plot on the graphs. The plot of the time course of pRB (labelled pRB_1) and E2F/DP (labelled E2F1_1) is shown in Figure 3 as an example. Even if initial conditions are different (and hence the quantitative solution will be different) we can conclude that the model behaviour calculated with our system and the one calculated in the work previously discussed [3] and used as test case are the same.
Figure 2: ODE system from the test-case model which is shown in the user interface.
Figure 3: The results plot interface, where pRB (red curve) and E2F (green curve) time course are shown.
4. Discussion The implementation is now capable of simulating single ODE system which describe a specific cell cycle model stored in the Cell Cycle Database. The model simulation engine is able to solve a single simulation run, but it is only the preliminary step towards the implementation of a wider system able to estimate the model which fits with real biological data the best, through a parameter estimation pipeline. The best model that fits the experimental data in a statistical sense can be found both through stochastic and deterministic mathematical methods. In the context of stochastic approach to parameter estimation, some methods for global optimization can be considered. In particular, the evolutionary computation are population-based stochastic methods which rely on the idea of biological evolution [20]. The evolutionary computing methods generate solutions close to optimum by iteratively creating new “generations” in numerical form. Those methods are generally classified into three groups: Genetic Algorithms, Evolutionary Programming and Evolutionary Strategies, which is considered the most efficient and robust especially for continuous problems, like ODE systems resolution [21]. In the case of the deterministic approach, the estimation of the best model is possible through linear regression, that is a statistical method of modeling through a linear function the conditional expected value describing the model in function of the parameter. The most frequent linear regression method used in systems biology is the method of least-squares [22], a mathematical optimization technique which attempts to find a function which closely approximates the data in order to find the model that best fits the biological measurements. We are implementing a system for the parameter estimation in the context of computational biology based on the grid technology. Our approach aims to find the best parameter set by computing many different simulation with the Evolutionary Strategy algorithm using the grid platform. This system essentially differs from the other grid-based parameter estimation approach [5,7] in the type of algorithm used and grid platform on which the computation is performed. Considering the ODE system describing the G1 to S transition model presented as example in the previous results [3], the simulation software XPPAUT needs approximately 4 seconds to achieve the numerical solution for 1000 time units using a Stiff integrator on a Intel Pentium 2.0 Ghz CPU with 1GB RAM. In the case of evolutionary computation to perform the parameter estimation, where a population of 300 individuals for 10000 generations is considered, the total time spent for a single simulation takes about 140 days. To overcome the complexity of the parameter estimation process, which can be very time-consuming due to the high number of parameter combination values and simulations needed to fit data, the computation can be distributed on several computers using techniques of High Performance Computing, like grid, which makes the parameter estimation possible through the use of thousands CPUs. Through mathematical modeling the prediction of the system behavior is possible and also unexpected properties of the system may emerge. In particular, the simulation of the cell cycle pathway allows a better understanding of cell cycle control in normal and transformed mammalian cells which is useful to put on a more rational basis the discovery of anticancer drugs.
5. Conclusion We present a grid-oriented approach to solve ODE systems describing cell cycle models, in order to make the numerical simulations of the biological process easier and more accurate. We choose to perform simulations using a High Performance Computing platform like the grid because our system is designed with the aim to estimate the best model computing many different simulations of each model. To accomplish this task we implement a pipeline useful to visualize the mathematical information related to cell cycle models and a system to simulate the whole process using the grid platform.
Acknowledgement This work has been supported by the Italian FIRB-MIUR projects "Italian Laboratory for Bioinformatics Technologies - LITBIO'' and “ITALBIONET” and by the European "Specific Support Action BioinfoGRID'', "EGEE'' projects and the INTAS grant .
References [1] [2] [3] [4] [5] [6]
[7] [8] [9] [10] [11] [12] [13] [14] [15] [16] [17] [18]
K.C. Chen, L. Calzone, A. Csikasz-Nagy, F.R. Cross, B. Novak, JJ. Tyson, Integrative analysis of cell cycle control in budding yeast, Mol Biol Cell. 15(8) ( 2004), 3841-62. Z. Qu, J. N. Weiss & W. R. MacLellan, Regulation of the mammalian cell cycle: a model of the G1-toS transition, Am J Physiol Cell Physiol. 284 (2003), C349-64. M. Swat, A. Kel, H. Herzel, Bifurcation analysis of the regulatory modules of the mammalian G1/S transition, Bioinformatics, 20(10) (2004), 1506-11. A. Csikasz-Nagy, D. Battogtokh, K.C. Chen, B. Novak, J.J. Tyson, Analysis of a generic model of eukaryotic cell-cycle regulation, Biophys J, 90 (2006), 4361-79. J.W. Zwolak, J.J. Tyson, L.T. Watson, Parameter estimation for a mathematical model of the cell cycle in frog eggs, J. Comput Biol., 12(1) (2005), 48-63. Paul T. Boggs, Richard H. Byrd, Janet Rogers Donaldson and Robert B. Schnabel (1989), ``ODRPACK -- Software for Weighted Orthogonal Distance Regression,'' ACM Transactions on Mathematical Software, Vol. 15, No. 4, pp 348-364. P.K. Dhar et al., Grid Cellware: the first grid-enabled tool for modelling and simulating cellular processes, Bioinformatics, 21(7) (2005),1284-1287. T. Ray, P. Saini, Engineering design optimization using a swarm with an intelligent information sharing among individuals, Eng. Opt, 33 (2001), 735–748. B. Ermentrout, Simulating, Analyzing, and Animating Dynamical Systems: A Guide to XPPAUT for Researchers and Students, SIAM 2002, Philadelphia, USA. M. Hucka et al, The Systems Biology Markup Language (SBML): A Medium for Representation and Exchange of Biochemical Network Models, Bioinformatics, 19(4) (2003), 524-531. M. Vass, N. Allen, C.A. Shaffer, N. Ramakrishnan, L.T. Watson, and J.J. Tyson, The JigCell Model Builder and Run Manager, Bioinformatics 20(18) (2004), 3680-3681. Mathematical Markup Language (MathML) Version 2.0 (Second Edition) [http://www.w3.org/Math/] T. Ideker, D. Lauffenberger, Building with a scaffold: emerging strategies for high- to low-level cellular modelling, TRENDS in Biotechnology, 21(6) (2003),255-62. Extensible Stylesheet Language (XSL) Version 1.1. Edited by Anders Berglund (IBM). [http://www.w3.org/Style/XSL/]. XSL Transformations (XSLT) Version 1.0 Edited by James Clark [http://www.w3.org/TR/xslt]. XSLT MathML Library Version 2.0 Edited by Vasil I. Yaroshevich, [http://xsltml.sourceforge.net/]. I. Hutchinson, TTH: a "TEX to HTML" translator [http://hutchinson.belmont.ma.us/tth/]. T. Williams, C. Kelley, GNUPLOT: An Interactive Plotting Program, Version 3.7 organized by: David Denholm.
[19] Grivell L, E-BioSci: Semantic networks of biological information. Information Services & Use 23 (2003),179–182. [http://www.e-BioSci.org/index.html]. [20] D.B. Fogel, Evolutionary computation: Toward a new philosophy of\machine intelligence. IEEE Press, New York, 2000. [21] N. Saravanan, D.B. Fogel, K.M. Nelson, A comparison of methods for self-adaptation in evolutionary algorithms, Biosystems, 36 (1995), 157–166. [22] J. Cohen, P. Cohen, S.G. West & L.S. Aiken, Applied multiple regression/correlation analysis for the behavioral sciences. (2nd ed.) Hillsdale, NJ: Lawrence Erlbaum Associates, 2003.