GPR SIGNAL ANALYSIS: INSTANTANEOUS PARAMETER ESTIMATION USING THE WAVELET TRANSFORM Lanbo Liu Department of Geology and Geophysics, University of Connecticut, Storrs, CT 06269-2045, USA
[email protected] Michael Oristaglio Schlumberger-Doll Research, Ridgefield, CT 06877-4108, USA
[email protected] ABSTRACT The classic approach for estimating instantaneous parameters relies on using the Hilbert Transform (HT). The HT method extracts the instantaneous parameters by comparing the imaginary part with the real part of an analytical signal. The instantaneous parameters obtained this way are frequently contaminated by noises. Using the wavelet transform (WT), one can extract the instantaneous parameters even in different scales. Parameters got by WT are able to characterize signals in different resolutions. The time-frequency analysis using WT is particularly useful when the signal is noisy and non-stationary. As a case study, we have used the WT approach to estimate instantaneous amplitudes and instantaneous frequencies associated with subsurface attenuation caused by gasoline contamination from a GPR profile acquired in the former Wurtsmith Air Force Base in Michigan. Variations of these instantaneous parameters in time-frequency-location domains are in good agreement with attenuation features found from other signal processing approaches. Estimation of instantaneous parameters could be used to serve as one supplementary approach to conventional GPR signal processing routines for extracting more information from a GPR dataset. Key words: Instantaneous parameters, Hilbert transform, Wavelet transform, Attenuation, LNAPL contamination.
INTRODUCTION The concept of instantaneous parameters has been widely used in electric engineering and geophysics (Matheney and Nowack, 1995; Gao et al., 1997). Instantaneous parameters such as the instantaneous amplitude, instantaneous phase, and instantaneous frequency are directly related to geometry and physical property variations of the medium through which the radar signal propagates. Although the concepts of instantaneous parameters have been used for a long time, improving the accuracy and efficiency of calculation algorithm is still of
great interest to geophysicists and electric engineers. The classic approach for estimating instantaneous parameters relies on using the Hilbert Transform (HT). This approach extends a real signal to an analytical signal, by doing the HT for the real signal to get its imaginary counterpart, and extracts the instantaneous parameters by comparing the imaginary part and the real part of the analytical signal. When the signal-to-noise (S/N) ratio is low in some cases, the accuracy of instantaneous parameters derived by HT suffers from high noises. Damping and weighting have been proposed to get a kind of modified instantaneous parameters in order to alleviate the effect of noise in getting dependable estimates (Barner, 1993; Matheney and Nowack, 1995). Nevertheless, it is hard to localize the frequency band of the noises and eliminate their effects by this approach. As an alternate, the wavelet transform (WT) can also be used for the time-frequency analysis. The key advantage of the wavelet transform over the conventional Fourier transform is its capability of localizing target information in both time and frequency domain simultaneously. The wavelet transform distinguishes itself from the Short Time Fourier Transform for time-frequency analysis in that it has a zoom-in and zoom-out capability. Thus the approach is suitable for time-frequency analysis of many geophysical signals. As for deriving the instantaneous parameters by the wavelet transform, WT is able to give an estimate of the parameters in different scales. When the scale is large, the central frequency of the signal becomes lower, and the bandwidth is narrower. Therefore, the resolution becomes poorer. In contrast, when the scale is smaller, the bandwidth becomes larger, and the central frequency is higher. This multi-resolution approach provides more information on time-frequency analysis for GPR signals. By deriving the instantaneous parameters from GPR data, the instantaneous phase may be used to detect thin beds and fractures, and the instantaneous frequency can be related to attenuation distribution associated with wave scattering and intrinsic dispersion. The approach using wavelet transform is particularly useful when
Proceedings of the 7th International Conference on Ground Penetrating Radar (GPR ‘98)
219
dealing with highly noisy and non-stationary signals. As an exercise of this approach we studied the instantaneous amplitudes and instantaneous frequencies of the signal contained in a piece of GPR field data acquired at a groundwater remediation site in the Former Wurtsmith Air Force Base in Michigan (Sauck, et al., 1998; Nash, et al., 1997; Bermejo, et al., 1997). The instantaneous parameter variation is possibly associated with high attenuation caused by an existing gasoline contamination plume (one major species of the so called Light NonAqueous Phase Liquid, or LNAPL) beneath the water table. The results from this application demonstrated that estimation of the instantaneous parameters using the wavelet transform can be regarded as another data processing algorithm to detect electromagnetic property changes and subsurface discontinuous features in attacking engineering and environmental problems.
THE INSTANTANEOUS PARAMETERS The complex (analytical) signal analysis can be used to estimate instantaneous parameters such as the instantaneous amplitude (signal envelope), instantaneous phase, and instantaneous frequency. Barnes (1991) obtained relations between instantaneous frequency and seismic signal attenuation. A given geophysical signal (e.g., seismic or GPR time traces) s(t) can be represented by its envelope a(t) and phase ϑ(t)
s(t) = a(t)cos ϑ (t)
(1)
and the quadrature (imaginary) trace is
s *(t) = a(t)sin ϑ (t )
(2)
and the complex (analytical) trace z(t) is then given by
z(t) = s(t) + is *(t) = a(t)e
iϑ (t )
(3)
The quadrature trace is the Hilbert transform of the real trace. Once the quadrature trace is found, the instantaneous amplitude a(t) and the instantaneous phase ϑ(t) are a(t) = [s(t) + s * (t) ] 2
2 1 /2
(4)
and s * (t) ] (5) s(t) respectively. The instantaneous frequency f(t) is the time derivative of the instantaneous phase:
ϑ (t ) = tan −1 [
f (t) =
1 dϑ (t ) 2π
1 = 2π
dt s(t)
ds * (t) ds(t) − s * (t ) dt dt 2 2 s(t) + s * (t)
(6)
The instantaneous frequency f(t) can have largeamplitude positive and negative spikes. Large spikes in f(t) occur when the denominator of Eqn. (6), which is the square of the instantaneous amplitude a(t), approaches zero more rapidly than the numerator. To reduce the large spikes in the instantaneous frequency, which are not of our interest, two more steps, damping and weighting, can be taken to get a much smoother f(t). By adding a small damping factor to the denominator of Eqn. (6) we get 1 f (t) = 2π
s(t)
ds * (t ) ds(t) − s *(t) dt dt 2 2 a(t ) + ε
(7)
In addition to damping, the instantaneous frequency can also be weighted as t+T
∫ f (t' )w(t' )dt' f (t) = t −Tt + T ∫t −T w(t' )dt'
(8)
where the weight w(t’) can be taken to be the squared instantaneous amplitude. The weighted instantaneous frequency approaches the average Fourier spectral frequency as the time interval T becomes large (Barnes, 1993). Besides damping, weighting the instantaneous frequency will further stabilize the calculation. THE WAVELET TRANSFORM
We summarize the approach for deriving the multi-scale time-frequency analysis by using the wavelet transform as follows. The purpose for using the wavelet transform is to get the instantaneous parameters by definitions in the above section, but in a multi-scale sense. By adding one more dimension (frequency), we may extract more information than using an averaged instantaneous parameter (e.g., using the Hilbert transform) for accounting all the frequency components in one time sequence. If s(t) is the real signal in time domain, g(t) is an analytical wavelet, then the wavelet transform of s(t) with respect to g(t) is defined as
Proceedings of the 7th International Conference on Ground Penetrating Radar (GPR ‘98)
220
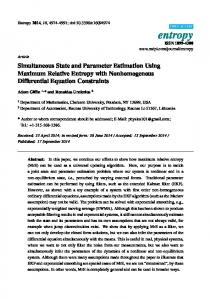
Wavelet Decomposition of Trace No. 450
S (b, a) =
(9)
t −b ) is the complex conjugate of the a t −b ) . In this expression, b is the time delay, integrand g( a and a is the scaling factor. The wavelet transform of a real signal series can also be derived from the frequency domain: where g(
Sample Number
t−b g( )s(t)dt ∫ −∞ a a ∞
1
Scaling Factor
1 S (b, a) = 2π
∞
∫−∞ e
iωb
gˆ (aω )sˆ(ω )dω
(a)
(10)
Wavelet Decomposition of Trace No. 800
1 Cg
∞
∫0 S(b,a )
da = s(b) + iH[s(b)] a
(11)
Sample Number
After getting the wavelet transform of the signal, it can be shown (Gao, et al, 1997) that the following theorem holds true:
with H[s(b)] meaning the Hilbert transform of s(b). In Eqn. (11), the coefficient Cg is Cg =
∞
∫−∞
2 gˆ (ω )
ω
dω
Scaling Factor
(12)
Eqn. (11) states that the analytical signal s(b)+iH[s(b)] can be expressed as the averaged composition of wavelet transform of s(t) over the entire scaling domain. It states that the approaches for getting the instantaneous parameters by HT and WT are interrelated. Nevertheless, The WT approach has the ability to decompose a time trace into components with respect to each scaling factor a. The decomposed subtraces can then be sorted, picked and eliminated, and re-composed to get the noisereduced time sequence. An example of wavelet decomposition is shown as Figure 1 for two GPR time traces. The original signals are shown on the right of both Figure 1a and 1b. They are two GPR monostatic reflection time traces with only a constant gain to compensate depth increase (Sauck, et al. 1998). These two traces were picked up from a GPR profile acquired at a groundwater contamination site (see Figure 2, also in Figure 3 of Bermejo, et al. 1997).
(b) Figure 1. Wavelet decomposition for 2 time traces in a GPR survey profile obtained at the former Wurtsmith Air Force Base, Michigan (Sauck, et al. 1998; Bermejo, et al. 1997) over a gasoline contamination plume. Trace No. 450 (shown as 1a) is acquired at a position outside of the plume on the surface. The scaling factors shown in 1a and 1b on the abscissa need times 0.1 to convert to the scaling factor used in Figures 3 and 4. The position on surface to acquire trace No. 800 (shown in 1b) is directly above the plume. On the left of the original traces are the subtraces obtained by wavelet decomposition. We used the Morlet wavelet (Pike, 1994) t2 imt − 2
g(t) = e e
−
t2 4 imt
− 2e e e
−t 2
(13)
as the wavelet function to conduct WT for the entire analysis described in this paper. From the wavelet decomposition it can be seen that for trace No. 450 the higher frequency components (i.e., scaling factors 6-12) persist till depth corresponding to sample numbers 400 to 450. In contrast, for trace No. 800, high frequency
Proceedings of the 7th International Conference on Ground Penetrating Radar (GPR ‘98)
221
constituents have decayed off when sample number greater that about 200. In hydrogeological reality, the position of trace No. 450 on surface is located outside the contamination plume, while trace no. 800 is in the middle of that plume (Bermejo, et al. 1997). By illustration of this example it is clear that by using the wavelet time-frequency analysis one can gain some insight of the time-frequency structure of a signal. Go one step further, one can also possibly get the noisereduced instantaneous parameters containing contributions from only the desired frequency components by excluding input from those noisy frequency constituents. Parameters obtained this way should represent a noise-free (or close to noise-free) estimate. Consequently, the instantaneous parameters obtained by this approach should have a higher accuracy than that by using the Hilbert transform without consideration of signal structure. A GPR PROFILE OVER A LNAPL PLUME
Sauck et al (1998) and Bermejo et al (1997) reported a case study on using integrated geophysical techniques to image LNAPL (gasoline) contamination plume at the former Wurtsmith Air Force Base in Michigan. In the study portion consists of an surface area of approximately 1,500 feet by 1,500 feet, numerous GPR profiles were surveyed using 100 MHz antenna. A GPR profile (easternmost part of Line 16, see Bermejo et al., 1997) traversing the contaminant plume is shown in Figure 2. In the GPR profile shown in Figure 2, some paleo-dune morphologies underlie this area, undulating between sample No. 450 and 500 (about 40 feet in depth), can be identified. The water table is the most pronounced feature, appeared continuously in the entire horizontal range. It occurs at about 70 nanosecond or 14 feet in depth (close to sample No. 120). A ‘shadow zone’ in the central part (approximately from trace No. 700 to 1050, and below sample No. 200) of the GPR profile can be easily identified and has been interpreted as the effect of a gasoline contamination plume just below the water table (Bermejo, et al. 1997; Sauck, et al. 1998). In the next section, we analyze the time-frequency structures by wavelet transform in detail for two portions we picked up from this profile: 12 traces (trace number 450 to 461) representing the uncontaminated region, and another 12 traces (trace number 800 to 811) representing the area within the contamination plume.
Figure 2. The GPR profile collected at the former Wurtsmith Air Force Base in Michigan, courtesy from W.A. Sauck. The central frequency of the antenna is 100 MHz. The total scan length in travel time is 400 nanosecond, consisting of 512 samples in each trace. A total number of 1,576 traces scanned 300 feet in horizontal distance (oriented with west to the left) on the surface in an approximately east-west direction. THE INSTANTANEOUS AMPLITUDES AND THE INSTANTANEOUS FREQUENCIES OBTAINED FOR FIELD DATA
For multi-trace analysis 3-dimensional matrix (travel time, frequency, and trace number in a GPR profile) is involved in the calculation to derive the instantaneous parameters. Handling 3-D matrix is very memorydemanding. Thus, instead of conducting time-frequency analysis by wavelet transform for the entire profile, which seems impractical for using personal computer, we conducted the analysis for 2 portions of the GPR profile shown in Figure 2, i.e., 12 traces started from trace No. 450, and another 12 traces started from No. 800. We think that these 2 pieces are pretty representative for the hydrogeological condition along the GPR profile. The results for instantaneous amplitude analysis are shown in Figure 3. In Figure 3a, which is the instantaneous amplitude for traces No. 450-461, one can see 2 stripes of amplitude enhancement in the scaling factor range 0.6 and 1.2 (approximately corresponding to 130 to 60 MHz in real frequency). The first high value zone of energy concentration can be seen about 70 ns in travel time. This seems associated with the water table. Another zone with even higher amplitude occurred at greater depth near 300 ns in travel time, reflecting a geological event in that depth, this zone appears to be associated with the existence of the paleo-dune (Bermejo, et al. 1997).
Proceedings of the 7th International Conference on Ground Penetrating Radar (GPR ‘98)
222
In contrast, the instantaneous amplitude obtained from the 12 traces acquired directly above the contaminant plume (trace No. 800-811) shows a quite different feature. First, the overall level of energy (squared amplitude) is lower than the portion outside the plume (please note the scale bar for amplitude is 0.0 to 14.17 for Figure 3a, and 0.0 to 10.0 for Figure 3b). Second, only the energy concentration associated with the water table has shown up, below the water table the energy level in that frequency range has been decayed off rapidly in depth, possibly caused by high attenuation rate in the soil associated with a secondary conductive plume in the aquifer caused by biodegradation of the hydrocarbon product (Sauck et al., 1998). It is worth to mention here, for the benefit of using more 3-D presentation in the future, a careful examination may reveal that the amplitude-frequency-location distribution feature shown in Figure 3, in a 3-D manner, is consistent with the 2-D features shown in Figure 1 for the analyses of 2 single traces. But 3-D presentation may include more information in one graphic expression. The results of instantaneous frequencies obtained from the same portions of the profile are shown in Figure 4. Usually it is much harder to get stable estimates for the instantaneous frequency than getting the instantaneous amplitude, because the instantaneous frequency is much easier to be contaminated by noise. To obtain relatively stable estimate of the instantaneous frequency damping has been applied in the calculation with a value of 0.0001 as the damping factor (see Eqn. 7). It is still premature to present a comprehensive interpretation of the physical significance of Figure 4. However, it appears that we can still see the general trend of lower instantaneous frequency in the lower depth for traces No. 800-811 (shown in Figure 4b), when compare it with the result obtained from traces No. 450-461.
(a)
CONCLUSIONS
We have shown that using the wavelet transform we can extract the instantaneous amplitude and the instantaneous frequency from GPR time traces. Analysis
(b) Figure 3. Three-dimensional block diagram shows the instantaneous amplitudes. (a): from traces No. 450-461; and (b): from traces No. 800-811. When comparing Figures 3 and 4 with Figure 1, the scaling factor on the abscissas needs times 10. Figures 1, 3, and 4 are in the same scaling factor range.
Proceedings of the 7th International Conference on Ground Penetrating Radar (GPR ‘98)
223
approach to conventional GPR signal processing routines for extracting more information from GPR data. ACKNOWLEDGMENTS
We thank Dr. W. A. Sauck provide us the GPR data they acquired at the former Wurtsmith Air Force Base site. This study is supported by Connecticut Department of Transportation (ConnDOT) through the Joint Highway Research Advisory Council (JHRAC). REFERENCES
Barnes, A.E., Instantaneous frequency and amplitude at the envelope peak of a constant-phase wavelet, Geophysics, Vol. 56, pp. 1058-1060, 1991. (a)
Barnes, A.E., Instantaneous spectral bandwidth and dominant frequency with application to seismic reflection data, Geophysics, Vol. 58, pp. 419-428, 1993. Bermejo, J.L., W.A. Sauck, and E.A. Atekwana, Geophysical discovery of a new LNAPL plume at the former Wurtsmith AFB, Oscoda, Michigan, Ground Water Monitoring & Remediation, Vol. 17, pp. 131137, 1997. Gao, J., W. Wang, and G. Zhu, Wavelet transform and signal instantaneous characteristics, Acta Geophysica Sinica, Vol. 40, 1997. Matheney, M.P. and R.L. Norwack, Seismic attenuation values obtained from instantaneous-frequency matching and spectral ratios, Geophys. J. Int., Vol. 123, pp. 1-15, 1995.
(b)
Nash, M.S., E. Atekwana, and W.A. Sauck, Geophysical investigation of anomalous conductivity at a hydrocarbon contamination site, in the Proceedings of SAGEEP ‘97, pp. 675-683, 1997.
Figure 4. Three-dimensional block diagram shows the instantaneous frequencies. (a): from traces No. 450-461; and (b): from traces No. 800-811. Damping has been applied to the instantaneous frequencies with a damping factor of 0.0001.
Sauck, W.A., E.A. Atekwana, and M.S. Nash, High conductivities associated with an LNAPL plume imaged by integrated geophysical techniques, Journal of Environmental and Engineering Geophysics, Vol. 2, pp. 203-212, 1998.
on the time-frequency-location distributions of these parameters may reveal engineering and environmental features in the subsurface. A case study on applying this approach to analyze GPR time traces acquired from a groundwater remediation site is conducted. Results from this study is in agreement with other GPR data processing techniques. The time-frequency analysis using wavelet transform could serve as a supplementary
Pike, C.J., Analysis of high resolution marine seismic data using thewavelet transform, in Wavelets in Geophysics, E.F.-Georgiou and P. Kumar (eds.), Academic Press, Inc., pp. 183-211, 1994.
Proceedings of the 7th International Conference on Ground Penetrating Radar (GPR ‘98)
224