PARAMETRIC MAXIMUM FLOW ALGORITHMS FOR ... - CiteSeerX
Recommend Documents
time-dependent discounted values of mining blocks when designing optimal production phases and ultimate pit .... application of the proposed stochastic optimization app- roach at a ... interest, λ, usually metal price, identifies successive pit.
Section 4 presents the partitioning algorithm for solving ... the algorithm works on a network with linear upper bound ..... (Parametric max-flow min-cut theorem.
their intersection point is accepted as the intersection of two curves. .... 2. 3. 4. 5. Figure 1: Intersection of B ezier curves. A rational parametric curve P(t) is ...
Oct 3, 2002 - hyperplanes of maximum regression depth among a set of n points. We work primarily .... points q0 â Q by increasing its last coordinate toward infinity. .... directions of rays from p that each cross at most i other lines. No cell ...
Feb 16, 1988 - that the corresponding maximum flow or minimum cut satisfies some side ... that the recent maximum flow algorithm of Goldberg and Tarjan can ...
Sun, Sun Microsystems, Java, and the Sun logo are trademarks or registered trademarks of Sun Microsystems, Inc. in the U.S. and other countries. All SPARC ...
[email protected]. Christina Fragouliâ ... model (we will call this ADT model) that takes ...... of Allerton Conference on Communication, Con- trol, and ...
The algorithm falls into the ASCEND class that is standard for hypercube ..... two processors in each step in the given communication pattern (ASCEND) in ...
machines, where jobs can be split among machines so that pieces of a single job can .... Tech(s). Chen's Models [6]. (Section 3). Single parameter, identical ma-.
Nov 9, 2012 - More details on the history of maximum flow in planar graphs can be ... inequality systems if certain additional properties hold. ... hedra, which have first been introduced by Hoffman and Schwartz [9] .... will furthermore make use of
A graph g is called a maximum common subgraph of two graphs, g1 ..... [10] M. R. Garey, D. S. Johnson, âComputers and Intractability: A Guide to the Theory of ...
weight, called the maximum cycle mean, over all directed cycles in the graph. Such a cycle is called a critical cycle. The minimum mean cycle problem and the ...
Aug 19, 2009 - of the convex hull of the resulting point set is as large ... hull must be endpoints of the segments; vertices on the ... ments. Therefore we could get the maximum area ... line l, let the y coordinates of the four intersection points.
been developed for EDF scheduling [6, 1, 2] and for static- priority scheduling [8, 16]. ...... Using the Rate Monotonic Scheduling policy, the task Ï2 can only be ...
Dec 1, 2012 - analysis models to obtain optimal design of water pipe net- work. Introducing a new adaptive penalty function. The pre- sented model has been ...
building block in more complex algorithms, is that of finding the maximum of a ...... HIRSCHBERG, D S., AND SINCLAIR, J.B. Decentrahzed extrema-findlng in ...
Feb 8, 2007 - âDepartment of Mathematics, Tel Aviv University, Tel Aviv 69978, Israel. ... â¡Department of Computer Science, Royal Holloway, University of London, Egham, ..... ematics and Its Applications, Oxford University Press, (2006).
Aug 22, 2017 - Abstract: A group-constrained maximum correntropy criterion (GC-MCC) algorithm is proposed on the basis of the compressive sensing (CS) ...
needed to find the maximum label in a circular configuration of n labeled ... building block in more complex algorithms, is that of finding the maximum of a.
Aug 12, 2011 - arXiv:1108.2664v1 [q-bio.PE] 12 Aug 2011. Fixed-Parameter and Approximation Algorithms for Maximum. Agreement Forests. Chris Whiddenâ.
Jan 4, 2017 - Keywords: maximum sub-array; maximum convex sum; parallel algorithm ... In this paper, we investigate the maximum subarray (MSA) problem ...
correcting code is used to protect data packets by adding redundant (parity) packets. This redundancy is exploited at the receiver side to recover the lost data ...
Mar 6, 2013 - Computer Science and Engineering, The Ohio State University. 3 CNRS ... cases one of our GPU-accelerated algorithms is demonstrated to be .... high degree of parallelism but does not guarantee a maximal set of augmen-.
PARAMETRIC MAXIMUM FLOW ALGORITHMS FOR ... - CiteSeerX
keywords. maximum flow, minimum cut, graph cut, parametric maximum flow, total ... Chambolle's dual algorithm [10], Chan, Zhou, and Chan's primal-dual ... for certain convolution operators A. Recently, fast methods for these ... Applying network flow algorithms for finding minimizers of energies/functions is not new.
PARAMETRIC MAXIMUM FLOW ALGORITHMS FOR FAST TOTAL VARIATION MINIMIZATION DONALD GOLDFARB∗ AND WOTAO YIN† Abstract. This report studies the global minimization of anisotropically discretized total variation (TV) energies with an Lp (in particular, L1 and L2 ) fidelity term using parametric maximum flow algorithms to minimize s-t cut representations of these energies. The TV/L2 model, also known as the Rudin-Osher-Fatemi (ROF) model, is suitable for restoring images contaminated by Gaussian noise, while the TV/L1 model is able to remove impulsive noise from grey-scale images and perform multi-scale decompositions of them. Preliminary numerical results on large-scale two-dimensional CT and three-dimensional Brain MR images are presented to illustrate the effectiveness of these approaches.
keywords. maximum flow, minimum cut, graph cut, parametric maximum flow, total variation, image denoising, MRI. 1. Introduction. Let a grey-scale 2-dimensional image be represented by a function f on a domain Ω in R2 . In this paper, to simplify our presentation, we restrict our discussion to rectangular domains. The ROF (TV/L2 ) [41] and TV/L1 models [2, 34, 12, 51] obtain a decomposition of f , f = u∗λ + vλ∗ , by solving the following models, respectively, (1.1)
ROF:
(1.2)
TV/L1 :
inf T V (u) + λkf − uk2L2 ,
u∈BV
inf T V (u) + λkf − ukL1 ,
u∈BV
for their minimizers u∗λ , where BV is the space of functions of bounded variation, T V (u) is the total variation [53] of u, and f ∈ L1 (Ω). The latter assumption is needed for technical reasons. The ROF model (1.1) was proposed in [41] for obtaining a restored image u∗ from an input image f corrupted by Gaussian noise. Early models for doing this were based on least squares and had the unfortunate property of either smoothing edges or creating spurious oscillations near edges, i.e., the well-known ringing phenomenon. Minimizing T V (u) allows u to have discontinuities; hence edges and important features in the original image are preserved by the ROF approach. The TV/L1 model differs from the ROF model by using an L1 instead of an L2 data fidelity term. Previous work on the TV/L1 model for image/signal processing include Alliney’s pioneering study [2, 3, 4] of the discrete version of (1.2), Nikolova’s [34, 35, 36] discovery of its usefulness for removing impulsive noise, Chan and Esedoglu’s [12] further analysis of it with comparisons to the ROF model, Yin, Goldfarb, and Osher’s [51] study of its multi-scale decomposition properties based on [12], and applications of it in computer vision by Chen et al. [16, 14, 15] and in biomedical imaging by Yin et al. [50]. There are various numerical methods for solving the ROF and TV/L1 models. The most basic one is the time-marching PDE method based on the Euler-Lagrange equations for (1.1) and (1.2), which takes small gradient-descent steps with respect to the objective functions of (1.1) and (1.2). Other methods include Chambolle’s dual algorithm [10], Chan, Zhou, and Chan’s primal-dual iterior-point method [13], Vogel’s multigrid method [43], Vogel and Oman’s iterative method [44, 45], Ito and Kunish’s active set method [31], Li and Santosa’s affine scaling method [33], Wohlberg and Rodriguez’s iteratively reweighted norm method ∗ Department of Industrial Engineering and Operations Research, Columbia University, [email protected]. Research supported in part by NSF Grant DMS 06-06712, ONR Grants N00014-03-0514 and N00014-08-1-1118 and DOE Grants DEFG01-92ER-25126 and DE-FG02-08ER25856. † Department of Computational and Applied Mathematics, Rice University, [email protected]. Research supported by NSF CAREER Award DMS-0748839 and ONR Grant N00014-08-1-1101.
1
2
GOLDFARB AND YIN
[47], and Goldfarb and Yin’s second-order cone programming method [27]. Some of these methods can also be applied to deconvolution problems in which f − u is replaced by f − Au in the ROF and TV/L1 model for certain convolution operators A. Recently, fast methods for these problems have been proposed by Fu, Ng, Nikolova, and Barlow [24] and Wang, Yang, Yin, and Zhang [46, 48, 49]. The former uses an anisotropic discretization of TV combined with a linear programming interior-point method while the latter uses variable splitting and parameter continuation. Our parametric maximum flow based methods were developed by combining our recent work [51] with the graph-cut algorithms in [32] . However, we soon became aware of the work of Darbon and Sigelle [22], which is also based on the graph-cut approach. Later, an anonymous referee brought to our attention the work of Chambolle [11] on a Markov Random Field based method. The authors of these two papers independently proposed essentially identical algorithms. Our algorithms are based on the same graph construction but use a different algorithm for finding the minimum s-t cut in the graphs by solving a sequence of max-flow/min-cut problems in one pass. This max-flow/min-cut algorithm is due to Gallo, Grigoriadis, and Tarjan [25] and has the best complexity bound. While writing this paper we learned that Hochbaum [30] had previously proposed this approach and given its complexity. Our contributions include two different recipes for constructing graphs, an existing graphical approach and a more formal one based on optimization, several modifications to the original parametric max-flow/min-cut algorithm in [25] to improve its efficiency, as well as a mixed algorithm for solving the ROF and TV/L1 models more efficiently by combining the Gallo-Grigoriadis-Tarjan algorithm with the divide-and-conquer approach proposed in [22]. Applying network flow algorithms for finding minimizers of energies/functions is not new. Some of the earliest contributions were made by Balinski [5], Picard and Ratliff [38], and Picard and Queyranne [37]. Subsequent work on imaging include [28], [39], [30], [52], and [40], as well as a large number of papers in computer vision. The rest of the paper is organized as follows. In Section 2, we provide discrete formulations for problems (1.1) and (1.2). In particular, we present various anisotropic discretizations of the total variation functional that allow us to decompose problems (1.1) and (1.2) into a series of decoupled problems in binary variables. In Section 3 we show how to construct capacitated networks whose s-t cuts correspond one-to-one to the binary variables for these decoupled problems. In Section 4 we give a formal justification of the term-by-term network construction in Section 3 based on the linear programming formulation of the min s-t cut problem, and point out that a min-cut can be computed by finding the corresponding s-t max-flow in the network. In Section 5, we present the preflow-flow algorithm of Goldberg and Tarjan [26] for solving a single maxflow/min-cut problem, and its extension [25] for solving a sequence of related max-flow/min-cut problems. In this section we also describe modifications to these algorithms that improve their efficiency in solving the max-flow/min-cut problems associated with the ROF and TV/L1 models. To illustrate the effectiveness of the proposed algorithms, various numerical results on two-dimensional and three dimensional images are presented in Section 6. We also discuss the dependence of the running times of our algorithms on various input parameters and the memory requirements of the algorithms. Finally, we present some conclusions in Section 7. 2. Level Set Problem Formulations. The two-dimensional images in this paper are defined as m×n , where Z+ denotes the set of nonnegative integers that represent the grey-scale levels of matrices in Z+ images. The (i, j)-th element of these matrices represents the grey-scale level or brightness of the (i, j)-th m×n×p image pixel. Similarly, three-dimensional images are represented by three-dimensional arrays in Z+ , in which the (i, j, k)-th element represents the grey-scale level of the (i, j, k)-th voxel. For ease of notation,
PARAMETRIC MAX-FLOWS FOR TV MINIMIZATION
3
we primarily focus on two-dimensional images. Our results for two-dimensional images can be extended to three-dimensional images in an obvious way. Numerical experiments on on both two and three dimensional MRI images are presented in Section 6. m×n m×n and u ∈ Z+ denote, respectively, the input and output images, and v = f − u their Let f ∈ Z+ difference. Hence, the elements of these matrices satisfy
fi,j = ui,j + vi,j
for i = 1, . . . , m, j = 1, . . . , n.
Moreover, we assume that all images u satisfy Neumann conditions on the boundary of the domain Ω, and hence that u0,j = u1,j
and
um,j = um+1,j for
j = 1, . . . , n,
ui,0 = ui,1
and
ui,n = ui,n+1 for
i = 1, . . . , m.
Two different discretized representations of TV, isotropic and anisotropic, are used in image processing. The standard isotropic discretization of TV is T V iso (u) =
Xq |ui+1,j − ui,j |2 + |ui,j+1 − ui,j |2 . i,j
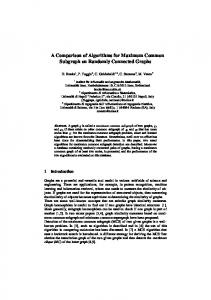
However, unless the elements of u are binary, T V iso (u) cannot be expressed in terms of the super-level indicators of u: 1{u≥l} , for all l ∈ Z+ . (1{u≥l} is a matrix with binary elements 1{ui,j ≥l} ). Therefore, in this paper, we only consider anisotropic discretizations of TV. These depend on which neighboring pixels are used to represent T V (u): the most commonly used neighborhoods, involving 4, 8 and 16 neighbors, respectively, are N 4 (i, j) = {(k, l) : |k − i| + |l − j| = 1}, N 8 (i, j) = N4 (i, j) ∪ {(k, l) : |k − i| = 1, |l − j| = 1}, N 16 (i, j) = N8 (i, j) ∪ {(k, l) : |k − i| + |l − j| = 3, |k − i| ∗ |l − j| 6= 0}. and are depicted in Figure 2.1. For example, these neighborhoods of pixel (3,3) are: N 4 (3, 3) = {(2, 3), (3, 2), (3, 4), (4, 3)},
where x+ = max{x, 0}, we define the following anisotropic discretizations of T V (u) corresponding to N 4 , N 8 and N 16 , respectively: (2.1)
T V 4 (u) :=
X i,j
w4,4 |ui+1,j − ui,j | + w4,4 |ui,j+1 − ui,j | =
X i,j
w4,4 n4i,j (u),
4
GOLDFARB AND YIN
(i − 2, j − 1)
(i − 1, j − 2)
(i − 1, j − 1) 16
(i − 2, j + 1)
8
(i, j − 1) 16
(i + 1, j − 2)
(i + 1, j − 1)
(i − 1, j)
16
16 8
4
(i, j)
4
16
16
8
(i + 1, j)
(i − 1, j + 2)
(i, j + 1)
4
4
8
(i − 1, j + 1)
16
(i + 2, j − 1)
16
(i + 1, j + 1)
(i + 1, j + 2)
(i + 2, j + 1)
Fig. 2.1. A graph representing the 4, 8, and 16-neighborhoods N 4 (i, j), N 8 (i, j), and N 16 (i, j) of (i, j). These neighborhoods consist of those nodes connected to (i, j) by the red (thick), blue (intermediate thick), and all directed arcs, respectively.
where the scalars wp,q are weights chosen according to cut metrics described in [7]. Specifically, for edge weights in a planar graph, [7] presents the formula wk =
(2.4)
δ 2 ∙ Δφk , 2 ∙ |ek |
for all edges of type k, where δ is the grid size (which is unity in this paper), Δφk is the angle that a type-k edge covers, and |ek | is the length of a type-k edge. For each node, the sum of Δφk for all of its outgoing edges equals 2π. For example, in a 4-neighbor graph in which each node (i, j) is connected to N 4 (i, j), all
edges are of the same type, Δφk = π/2 and |ek | = 1. Hence in (2.1), w4,4 =
1 ∙ π/2 π = . 2∙1 4
Similarly, in a 8-neighbor graph there are two types of edges out of each pixel (i, j), those to N 4 (i, j) and those to N 8 (i, j) \ N 4 (i, j). Their weights are given, respectively, by (2.5)
w
4,8
π 1 ∙ π/4 = = 2∙1 8
and √
w
8,8
√ 2π 1 ∙ π/4 √ = . = 16 2∙ 2
√
It is easy to show that w4,16 = 12 tan−1 ( 12 ), w8,16 = 42 ( π4 − tan−1 ( 12 )), and w16,16 = 805 π. Formula (2.4) was derived based upon the Cauchy-Crofton formula, which implies that the length L of a regular, plane curve equals half of the measure m/2 (counting multiplicity) of all lines in the plane that intersect the curve. The weights given in (2.4) make the total weights of the graph edges cut by the curve a good approximate to the measure m/2, and thus to the length L of the curve. For three-dimensional images, we define the following neighborhood and corresponding anisotropic dis-
PARAMETRIC MAX-FLOWS FOR TV MINIMIZATION
5
cretization of T V (u): N 3D,6 (i, j, k) := {(i0 , j 0 , k 0 ) : |i0 − i| + |j 0 − j| + |k 0 − k| = 1},
For each pair of neighboring pixels (i, j) and (l, k), we can express (ui,j − ul,k )+ in terms of the elements of 1{u≥μ} over all grey-scale levels μ = 0, 1, . . . , lmax as follows: (ui,j − ul,k )+ =
(2.9)
lX max
μ=0
(1{ui,j ≥μ} − 1{ul,k ≥μ} )+ ,
where lmax = maxi,j {ui,j } ≤ 2ρ − 1 for ρ-bit grey-scale images (ρ is typically 8, 16, or 32). Using (2.9) and defining
Because the neighborhood relation is reflective, for each neighborhood pair of pixels (i, j) and (k, l), the terms involving both these pixels in (2.12)-(2.14) have the form: (2.15)
Next we express the L1 and L2 fidelity terms in terms of 1{u≥μ} and 1{f ≥μ} . Using the facts that for Pmax{a,b} a, b ∈ Z+ , 1{b 0 or both, then (v, w) is a residual edge, and its residual capacity is equal to cf (v, w) := (c(v, w) − f (v, w)) + f (w, v) > 0,
where the first part of the sum is the maximum flow augmentation over (v, w), and the second part the maximum flow reduction on its reverse edge (w, v). We denote the set of residual edges by E f . For example, let (v, w) and (w, v) be two directed edges. If c(v, w) = 5, c(w, v) = 2, f (v, w) = 3, and f (w, v) = 0, then cf (v, w) = 2 and cf (w, v) = 5. The preflow-push algorithm [26] maintains a preflow f and a distance label d(v) for every node v ∈ V .
A valid labeling d for a preflow satisfies: d(s) = |V |, d(t) = 0, and d(v) ≤ d(w) + 1 for all (v, w) ∈ E f with cf (v, w) > 0. It is easy to see that d(v) is less than or equal to the least number of edges in any path from v to t in the residual network Gf = (V, E f , cf ). In the algorithm, d is used to approximate this “shortest path distance” to direct preflow pushes from nodes with excess along approximately shortest paths to t. Intuitively, since t is the destination of flow, pushing along a shortest path to t reduces the total number of pushes required. Initially, all excess resides at the source node s. A node v is called active if ef (v) > 0; hence s is the only active node. The preflow-push algorithm pushes the excess at s to its adjacent nodes v in G by saturating
the edges (s, v) ∈ E (i.e., letting f (s, v) = c(s, v)), so these nodes v become active and s becomes inactive. Then, the algorithm iteratively improves the preflow f by pushing the excess residing at active nodes v toward t along admissible edges (v, w) ∈ E f , defined as those satisfying d(v) = d(w) + 1, while also updating d dynamically to better reflect the shortest distances to t. Since d(t) = 0 and preflow is pushed from nodes with larger labels d to those with smaller labels, the sink node t is the ultimate destination of the pushed flow. Without going into the details of the algorithm, it is still easy to see that ef (t) gradually increases and finally reaches its maximum. When this happens, there is, generally, still some excess at internal nodes, that are disconnected from t in the residual network (otherwise, this excess could be pushed to t). This remaining excess is then pushed back (i.e., returned) to s. These pushes happen to an active node v when d(v) is increased and becomes greater than d(s). After all remaining excess is returned to s, the algorithm terminates with a max-flow f from s to t. We note that returning excess to s is not necessary for finding a min-cut; see Theorem 5.1 below and the discussion following it. The details of the preflow-push algorithm [26] are given in Algorithms 1 and 2, which include two modifications. First, we require that d(v) < |V | for a node v to be active in addition to ef (v) > 0. Second, we employ the gap relabeling heuristic [18, 23] to avoid flow pushes that do not help increase fin (t): if there
14
GOLDFARB AND YIN
ˉ all nodes v with d(v) > dˉ are relabeled to d(v) = |V |. are no nodes that have a distance label equal to d,
With these two modifications, we have the following theorem: Theorem 5.1. In the preflow algorithm using the gap relabeling heuristic, when a node v is defined as active if d(v) < |V | and ef (v) > 0, S = {v : d(v) = |V |} and S = V \ S define a min cut (S, S) at the termination of the algorithm. Proof. We shall show that any edge (v, w), where v ∈ S and w ∈ S, is saturated. First, we have s ∈ S and t ∈ S since d(s) = |V | and d(t) = 0 always. If v = s, then (v, w) is saturated due to the initial saturating pushes from s to its neighbors. If v 6= s and (v, w) is not saturated, then d(w) = |V | − 1, which is from the result [26]: d(w) ≥ d(v) − 1 for any unsaturated edge (v, w). According the gap relabeling heuristic, there
must exist nodes at all distances d = 0, 1, . . . , |V | − 2; otherwise, there is a gap, i.e., a distance less than |V | − 1 without any node, so the heuristic applies to w: this leads to the contradiction d(w) = |V |. However, there are only |V | nodes including s at d(s) = |V | and t at d(t) = 0. Therefore, there must exist a gap, so d(w) = |V |, which contradicts w ∈ S. Theorem 5.1 also shows that any node v with d(v) = |V | no longer has a directed path to t in Gf , so any excess residing at it can only be returned to s. The third modification is to not return this excess to s. Hence, the modified preflow-push algorithm terminates with a maximum preflow instead of a maximum flow. The discharge(v) procedure in Algorithm 2 sends excess at node v to its neighbors. For this purpose,
each node keeps its neighbors in an ordered list, where the order can be arbitrary but must be fixed, and a pointer current edge pointing to an edge in the list. Initially, current edge points to the first edge in the list. When procedure discharge(v) is called, it starts scanning the edge list of v from current edge and moves forward in the list until either all excess at v has been pushed to its neighbors through admissible arcs or current edge reaches the end of the list with excess still left at v. In the former case, current edge points to the last edge in the list in which preflow was pushed, and the procedure terminates. In the latter case, v is relabeled (i.e., d(v) is increased) to generate new admissible edges. After relabeling, current edge of v is reset to the first new admissible edge. As there are usually several active nodes from which to choose, Algorithm 1 always picks an active node with the highest distance label to discharge, and achieves a worst case running time of O(|V |2 |E|1/2 ) [17]. One can order active nodes for discharge in other ways, for example, in FIFO order [26]. See [19] for a comparison of different orderings. We found that the gap relabeling heuristic is very useful for reducing the total number of pushes and relabels and, thus, total running time. Gap relabeling checks, before each call to relabel (i.e., right after current edge of v reaches the end of v’s edge list but v still has excess) whether or not v is the only node with a distance label d0 = d(v); if true, i.e there will be no node v with d(v) = d0 after relabeling v, it skips the relabeling process by directly setting d(v) = |V | for all of the nodes v with d(v) ∈ [d0 , |V | − 1]. These relabeled nodes can never become active, and hence are put in S. To keep track of active and inactive nodes with different labels, efficient implementations of the preflowpush algorithm employ an array of distance buckets1 . All active nodes with the same distance label are stored in the same dedicated bucket, as are all inactive nodes with the same distance label. In addition, three variables dmax , amin , and amax are used to keep track of the current max distance label and min and max distance labels of active nodes. This enables gap relabeling to run at little extra cost. 5.2. The Parametric Max-Flow Algorithm. The data fidelity terms in E1G (U ; μ) and E2G (U ; μ) vary with μ. Therefore, according to the graph constructions in the last section, the capacities of the terminal 1a
type of data structure (see, for example, [20])
PARAMETRIC MAX-FLOWS FOR TV MINIMIZATION
15
Algorithm 1 Preflow-push algorithm saturate (s, v) for all neighbors v of s {Comment: by modifying the residual capacities of (s, v) and excesses e(v) of these v’s} d(s) ← n (inactive), d(t) ← 0 (inactive) for all v ∈ V \ {s, t} do if (s, v) ∈ E then d(v) ← 1 (active) else d(v) ← 1 (inactive) end if end for dmax , amin , amax ← 1 {Comment: dmax , amin , amax denote max distance label, maximum and minimum active node labels, respectively} while there exists an active node in V {Comment: by comparing amin and amax } do pick an active node v with highest d(v) {Comment: Remove v from active bucket amax ; if this bucket is empty, reduce amax by one} discharge(v) end while edges (i.e., edges out of s and into t) are functions of μ. In the network representing E1G (U ; μ), the capacities λ1{fv ≥μ} of (s, v) are nonincreasing in μ while the capacities λ(1 − 1{fv ≥μ} ) of (v, t) are nondecreasing in μ. The same holds for the capacities of (s, v) and (v, t) in the network representing E2G (U ; μ). The capacities of all other (non-terminal) edges do not change with μ. This monotonicity property allows us to use the Gallo-Grigoriadis-Tarjan parametric maximum flow algorithm [25] to compute the max-flows/min-cutes for all values of μ instead of calling a single maximum flow algorithm multiple times for all 2 ρ different values
of μ for ρ-bit grey-scale images. For μ = 0, the min-cut is trivially (S, S) = ({s}, V − {s}) since fi,j ≥ 0 for all (i, j). Theorem 5.2. Models (1.1) and (1.2) can be solved for optimal output images with p-bit gray-scale levels in at most O(nm log(n2 /m) + 2p m log(n2 /m)) time by the parametric max-flow/min-cut algorithm. For Model (1.2), the running time can be reduced to O(nm log(n2 /m)), independent of the gray-scale depth p. This theorem follows from the time bound for the parametric maximum flow algorithm, which we briefly discuss below. Assumption B: for k = k1 , . . . , kK and k1 < . . . < kK , let Gk = (V, E, ck , s, t) be a sequence of networks with the same node and edge sets V and E and terminal nodes s and t, where as functions of k, ck (s, v) for all (s, v) ∈ E is nondecreasing, ck (v, t) for all (v, t) ∈ E is nonincreasing, and ck (v, w) is constant for all other edges (v, w) ∈ E.
Gallo, Grigoriadis, and Tarjan [25] found that the preflow-push algorithm can be modified to compute max-flows/min-cuts in Gk for all k = k1 , . . . , kK in a worst-case total time of O(|V ||E| log(|V |2 /|E|) + K|E| log(|V |2 /|E|)).
For K ≤ O(|V |), this is the best time bound currently known for a single max-flow computation. Their parametric algorithm works as follows. Suppose for a fixed k = kl , the preflow-push algorithm terminates with a set of distance labels dk and a (pre)flow f . When changing k from kl to kl+1 , if ck (s, v) strictly increases, then f (s, v) is replaced by ck (s, v); if ck (v, t) decreases, then f (v, t) is replaced by min{f (v, t), ck (v, t)}. The residual capacities of all affected edges, and the excesses and active statuses of all affected nodes are also updated. The modified (pre)flow f is still a preflow, and the old distance labels d = dk are still valid for
16
GOLDFARB AND YIN
Algorithm 2 discharge(v) Require: v is active {Comment: d(v) < |V | and ef (v) > 0} end-of-edge-list ← false d ← d(v) for (v, w) ← current edge of v to the last edge in list do {Comment: It is recommended to have (v, t) as the first arc of v} if (v, w) is admissible (i.e., d(v) = d(w) + 1 and cf (v, w) > 0) then push(v, w){Comment: f (v, w) ← f (v, w) + min{ef (v), cf (v, w)}} if w 6= t was inactive then move w from the inactive bucket d − 1 to the active bucket d − 1 {Comment: Whenever adding nodes to an active bucket, update amin , amax , dmax } end if if ef (v) = 0 then Break the for loop else if ef (v) > 0 and (v, w) is the last edge in the list then end-of-edge-list ← true Break the for loop end if end if end for if end-of-edge-list {Comment: ef (v) > 0} then if Both active and inactive buckets d are empty then gap relabel (d){Comment: v and all w’s with d(w) > d are relabeled to |V | (they will never become active); dmax , amax ← d − 1} else relabel (v){Comment: d(v) ← min(v,w):cf (v,w)>0 {d(w)} + 1; this task needs to scan all arcs out of v, and assign an unsaturated edge w ˉ with the smallest label as the current arc of v; dmax ← max{dmax , d(v) + 1}}; add v to bucket d(v) (active) end if else {Comment: ef (v) = 0} current edge ← (v, w) add v to the inactive bucket d end if
f . Therefore, if new active nodes are generated by the updates, the preflow-push algorithm can resume and compute a maximum (pre)flow for Gk . The reader should refer to [25] for the details and justification of this parametric algorithm. If our modified algorithm is used, a min-cut (S k , S k ) in Gk can be easily obtained from the min-cut (S , S k−1 ) computed for Gk−1 : S k = {v : d(v) = |V |} is equal to the union of S k−1 and the set of nodes relabeled to d = |V | during the max-flow computation in Gk . k−1
For solving the TV/L1 and ROF models based on the networks constructed in Sections 3 and 4, we compute the min-cuts of those networks for a decreasing sequence of μ values. The number of distinct values of μ is equal to K. It is important to note that the min-cuts obtained by this procedure are nested; more 0 specifically, S k(μ) ⊆ S k(μ ) for any μ > μ0 . This allows one to have a nested sequence of Uμ∗ that can be used to reconstruct u∗ according to (2.18). For the TV/L1 model, K can be much less than the total number of grey-scales, since the capacities of the arcs from s to node (i, j) or from that node to t change only when the value of μ becomes equal to fi,j .
PARAMETRIC MAX-FLOWS FOR TV MINIMIZATION
17
(Refer to the left graph of Figure 3.4.) Consequently, μ only needs to take on the distinct values taken on by all of the fi,j ’s. For many images, the number of distinct gray-scale values is less than the total number of grey-scale levels, so the parametric max-flow algorithm for the TV/L1 model can be applied with a relatively small number of updates. Moreover, since each 1{fi,j ≥μ} only changes at one value of μ, the capacities of associated edges change only once. Consequently, no matter how many updates there are, the total work of updating edge capacities is fixed. Therefore, as one can see from the numerical results in Section 6, the parametric max-flow algorithm is well suited for solving the TV/L1 model. However, this is not the case for the ROF model because the capacity 2λ(μ − 12 ) varies with μ directly, so we need to compute min-cuts for every integer value of μ ∈ [fmin , fmax ], where fmin := min{fi,j } and fmax := max{fi,j }. 5.3. A Two-Threaded Parametric Max-Flow Algorithm. With a little change to the constructed network, we can solve the sequence of max-flow/min-cut problems for an increasing sequence of μ values. Given a max-flow from s to t, we can obtain a max-flow from s0 = t to t0 = s in a new network with all directed edges and flows reversed. Since every non-terminal edges (v, w) has a sibling (w, v) with the same capacity, this only affects terminal edges (s, v) and (v, t), giving new edges (v, t0 ) and (s0 , v); hence, for an increasing sequence of μ values, the monotonicity properties of the capacities of the terminal nodes satisfy Assumption B. Therefor, we can solve the set of max-flow/min-cut problems corresponding to a set of μ-values using two μ sequences at the same time: one sequence with increasing values of μ starting from the minimal μ value and the other with decreasing values of μ starting from the maximal μ value, until the two sequence meet at the same μ value. To fully justify this parallel algorithm, we cannot ignore the nesting of the min-cuts generated by the two threads. In general, a network may have multiple min s-t cuts, and because of this, a particular sequence of min-cuts of a parametric network may not be nested. Therefore, even though each thread generates a nested min-cut sequence, concatenating the two sequences will not usually result in a full sequence that is nested. However, the preflow algorithm computes a min-cut that is S-minimum among all min-cuts, i.e., the ˆ S). ˆ Consequently, the min-cuts computed by the thread with computed S is a subset of all Sˆ for min-cuts (S, decreasing μ’s are S-minimum and increasing; the min-cuts computed by the other thread with increasing μ’s are S 0 -minimum (hence, S-minimum and S-maximum) and decreasing. When the two threads meet at a value of μ, the two sequences of min-cuts can be concatenated into one nested sequence of min-cuts, allowing (2.18) to be applied for computing u∗ . There is no synchronization needed for running the two independent threads. Each thread only needs to check, before the μ of this thread is changed to the next μ0 , whether the other thread has already started or even finished with μ0 . If it has, then the inquiring thread terminates. Therefore, the parallelization overhead is negligible, yielding an algorithm that is almost twice as fast as the single-threaded one. To fully utilize this property, one should implement this two-threaded algorithm on two CPUs or across two computers that do not share memory/cache pipelines (but signal each other for μ) since each thread needs to access memory extensively. 5.4. The Divide-and-Conquer Algorithm. In this section we combine the parametric maximum flow algorithm with aspects of the divide-and-conquer procedure proposed in [30] and later in [22] for image processing. These approaches use ideas of graph contraction and divide-and-conquer first described in [29] for solving parametric max-flow/min-cut problems. Our combined algorithm invalidates the time bound in [29] and [30] but speeds up the calculations for solving the TV/L1 model and especially the ROF model. We first store all of the values k1 , . . . , kK in a binary tree using the following recursive procedure. We let kpK/2q be the root of the binary tree and let k1 , . . . , kpK/2q and kpK/2q+1 , . . . , kK be the values stored
18
GOLDFARB AND YIN
[8]
level 1:
[10]
[3]
level 2:
[1]
level 3:
[4]
[9]
[12]
Fig. 5.1. A sequence of k values, (1, 3, 4, 8, 9, 10, 12) ordered in a binary tree.
in the left and right binary subtrees, respectively, of this root node. The left and right children of the root node are the roots of these subtrees (which are determined recursively). A simple example is given in Figure 5.1. If K + 1 is not a power of 2, then some leaf nodes can be left empty or have the same values as their parents. Next, we describe how the network is modified in going from one level to the next deeper level. Let us consider the case of going from level 1 to level 2. Recall that the parametric algorithm generates min-cuts k (S k , S ), where S k = {v : dk (v) = |V |} using the labels dk obtained at the end of k-th max-flow subproblem, k1 kK kpK/2q that satisfy S k1 ⊆ . . . ⊆ S kK (hence, S ⊇ . . . ⊇ S ). In particular, S , obtained by solving the level k
kpK/2q
1 problem, is a subset of S for all k = k1 , . . . , kpK/2q−1 . Next, we argue that the nodes in S \ {t} do k k not play a role in determining the min-cut (S , S ) for any k < kpK/2q . When k is reduced from kpK/2q , the capacities of the arcs (v, t) are nondecreasing. This may allow some of the excess of flow residing at the nodes in S kpK/2q to be sent to t. However, this additional excess of flow never passes through any node kpK/2q w∈S \ {t} because all edges (v, w), where v ∈ S kpK/2q , are saturated after solving the level 1 problem; kpK/2q hence, the set of nodes, S \ {t}, cannot help route any excess of flows to t in the max-flow/min-cut kpK/2q
problems corresponding to any k < kpK/2q . Consequently, we do not need to include S \ {t}, as well as all edges from or to this set of nodes, in the max-flow calculations for k < kpK/2q after solving the level 1 problem for kpK/2q . Instead of removing any nodes or edges from memory, we disconnect S kpK/2q and kpK/2q S from each other by simply freezing the residual capacities, as well as the flow, in all edges (v, w) with v ∈ S kpK/2q \ {s} and w ∈ S and its induced edges.
kpK/2q
\ {t}, and only consider the sub-network corresponding to S kpK/2q ∪ {t}
When k is increased from kpK/2q , we can derive exactly the opposite result; that is, S kpK/2q \ {s} does not play a role for solving the max-flow problem corresponding to any k > kpK/2q . Therefore, we freeze the nodes in S kpK/2q , as well as any edges from or to this set of nodes, and only consider the sub-network of S
kpK/2q
∪ {s} and its induced edges.
The two sub-networks corresponding to k1 < kpK/2q and k2 > kpK/2q at level 2 have only the frozen kpK/2q edges in between S kpK/2q and S , as well as s and t, in common. Since s and t only have out and in edges, respectively, they cannot transport flow from one sub-network to another. Therefore, the two sub-networks can be combined into one by sharing the same s and t, as well as the frozen edges. The combined network kpK/2q has exactly the same set of nodes and edges, including the frozen ones in between S kpK/2q and S , as the original network with respect to k = kpK/2q . Therefore, the only operations needed for moving from level 1 to level 2 are to update the capacities c(v, t) (hence, ef (v)) and to freeze the set of edges between kpK/2q S kpK/2q and S . It is clear that the above procedure can be recursively applied to the two sub-networks derived from each of the subnetworks at level 2, and from them, to those at level 3 and so on.
PARAMETRIC MAX-FLOWS FOR TV MINIMIZATION
19
1 9 13 15
2 10
14 12
6 11 8
3 7 5
4
Fig. 5.2. The order of max-flow/min-cut computation on a 4-level binary tree.
5.5. Combining Divide-and-Conquer and Parametric Max-Flow. In [22], all of the max-flow problems for the combined sub-networks at each level of the binary tree are solved as one max-flow/mincut problem. We do not do that; however, we also apply our algorithm to the modified version of the original network obtained by freezing certain edges, as described in the previous section, in order to isolate the sub-networks. We traverse the binary tree in right-left preorder, solving the max-flow/min-cut problem associated with each node visited. This order of traversal, which can be defined recursively as visit the root, and then visit (in right-left preorder) the right subtree followed by the left subtree, is illustrated in Figure 5.2 for a 4-level binary tree. As we have shown in Subsection 5.2, when k is increased, one can reuse the preflow and labels corresponding to the previous k; therefore, after solving the problem for some value of k, say kcurrent , the algorithm can solve the right problem for the new value of k, denoted by kright , corresponding to the right child of kcurrent without resetting any of the buckets (recall that buckets are used to store nodes according to their labels), preflow, or labels in memory. However, the same does not apply to the left problem for the value of k, denoted by kleft , corresponding to the left child of the previous node; this problem can only be solved after first resetting all distance labels and thus the buckets. Therefore, if both left and right problems are solved together as one max-flow/min-cut problem as was described in the last subsection, then the buckets are shared by both problems at the same time. Although the nodes in the right problem can still reuse their labels (and hence, remain in the buckets) at the end of kcurrent , those in the left problem, which must be assigned new distance labels (and hence, put into new buckets), will reduce the efficiency of gap relabeling. Consequently, it is more efficient to solve the left and right problems one by one. To minimize memory operations, we first reset the distance labels and buckets for the nodes in the left problem, solve the right problem using the remaining (unchanged) data, and solve the left problem later. When we apply this strategy to the entire binary tree, solving the max-flow/min-cut problems in right-left preorder fashion allows us to maximally reuse data from previous max-flow/min-cut problems. In [25] the authors described a strategy based on solving the max-flow/min-cut problem for each k in both the original and reverse networks by running two parametric preflow algorithms in parallel. Once one of the two algorithms terminates, the other can stop after directly constructing the optimal preflow, labels, and buckets from the data of the one that stops first. Recall from Section 5.3 that in the reverse network, when decreasing the value of k, the data from a previous k can be reused to solve the new problem. Therefore, for each new k (except for the very first one), in exactly one of the original and reverse networks, the preflow algorithm can resume with the data from the previous value of k. Since a max-flow/min-cut solution is obtained once one of the two parallel algorithms stops, it follows that this strategy applied to the entire sequence of max-flow/min-cut problems has a worst-cast complexity bound equal to that of solving a single max-flow/min-cut problem by the preflow algorithm. It is not difficult to apply this strategy together with divide-and-conquer, but we believe that the overhead of running two preflow algorithms in parallel, especially on a single CPU, will slow down the computations because our problems have very sparse networks.
20
GOLDFARB AND YIN
5.6. Other Algorithmic Improvements. The first improvement we make over the standard maxflow algorithms is to remove all terminal arcs (s, v) and (v, t) from the data structure, as suggested in [6, 8] and adopted in the code [9]. Theorem 5.3. Adding a constant capacity to both (s, v) and (v, t) for any node v does not change the min-cut of a network. Proof. We use linear programming duality to prove this. Let G(V, E, c, s, t) denote a network, and G (V, E, c0 , s, t) denote another network that has the same sets of nodes and edges and terminal nodes s and t as G but c0 (s, v) = c(s, v) + Cv , c0 (v, t) = c(v, t) + Cv for some Cv ≥ 0 for all edges (s, v) and (v, t) in 0
E, and c(v, w) = c0 (v, w) for all other edges in E. An s-t cut (S, S) of G(V, E, c, s, t) is minimum if there exists a (pre)flow f such that ef (t) = c(S, S), i.e., the flow value is equal to the cut capacity. Consider f in G0 (V, E, c0 , s, t). Since each s-v-t path has the residual capacity Cv , a flow f 0 can be obtained by augmenting P 0 Cv units of flow over all s-v-t paths in f and hence ef = ef + v:(s,v),(v,t)∈E Cv . Since for every non-terminal P node v either (s, v) or (v, t) crosses the cut (S, S), we have c0 (S, S) = c(S, S) + v:(s,v),(v,t)∈E Cv . Therefore, 0
we have ef = c0 (S, S) from which it follows that f 0 is a max (pre)flow in G0 (V, E, c0 , s, t), and hence (S, S) remains a min-cut in G0 (V, E, c0 , s, t). Using Theorem 5.3, any changes that need to be made to ck (s, v), as a function of k, can be instead ap-
plied to ck (v, t) so that ck (s, v) remains constant in k. To do this, we let cˉk (s, v) ≡ cmax (s, v) = maxk ck (s, v) and cˉk (v, t) = ck (v, t)+[ˉ ck (s, v)−ck (s, v)]. When applying the parametric algorithm to the resulting network G(V, E, cˉ, s, t), we can avoid updating the flow f (s, v) over all edges (s, v) ∈ E after each parameter update. Consequently, after initially pushing flow from s to all of its neighbors v, the flow over all edges (s, v) are no longer changed. This allows us to implement these initial pushes by directly setting e(v) = cˉk (s, v) and not store any data for the edges (s, v) ∈ E in our algorithm.
We can also avoid storing any data for the edges (v, t) ∈ E. Since there is an edge (v, t) for every v ∈ V \ {s, t}, whenever both e(v) > 0 and cf (v, t) > 0, we can augment the current flow f by pushing min{e(v), cf (v, t)} > 0 units of flow from v to t, and thus reduce e(v) or cf (v, t) or both to zero after the push. Therefore, we combine e(v) and cf (v, t) into a new quantity eˉ(v) that is now allowed to be negative: when eˉ(v) ≥ 0, e(v) = eˉ(v) and cf (v, t) = 0; otherwise, e(v) = 0 and cf (v, t) = −ˉ e(v). This change not only saves storage but also implicitly pushes min{e(v), cf (v, t)} units of flow to t whenever it is positive.
6. Numerical results. In this section, we present numerical results that illustrate the effectiveness of our parametric and divide-and-conquer max-flow/min-cut algorithms for solving the TV/L1 and ROF models on large-scale images with either 8-bit (0 to 28 − 1 = 255) or 16-bit (0 to 216 − 1 = 65, 535) gray scales. Our test images include two 512 × 512 2-dimensional images: Barbara and CT, as well as two 181 × 217 × 181 (approximately 7.1 million voxels) 3-dimensional MRI images: MRI-T1 and MRI-T2. The two 2-dimensional original images are depicted in Figure 6.1. The Slices z = 50 and 100 of the two 3-dimensional MRI images are depicted in Figure 6.2. The values of λ used in our tests were determined experimentally. In the TV/L1 model, λ acts like a threshold on scale [51] so the choice of λ depends on the application. In the ROF model, λ determines the amount of noise removed (see [42] for example). The issue of how to optimally select λ is important, but outside the scope of this paper. To evaluate the efficiency of our codes, we used two values of λ in both models for each image, one causing slight over-smoothing and the other slight under-smoothing, to demonstrate how running times depend on λ. We developed our codes in C++ based on HIPR, a code in C available from Goldberg’s Network Op-
PARAMETRIC MAX-FLOWS FOR TV MINIMIZATION
21
Fig. 6.1. Left: the 512 × 512 original image Barbara; Right: the 512 × 512 original image CT
Fig. 6.2. First row from left to right: Images 1 and 2 are Slices 50 and 100 of the 181 × 217 × 181 image MRI-T1; Images 3 and 4 are Slices 50 and 100 of the 181 × 217 × 181 image MRI-T2. Second row: the counterparts of the images in the first row, each with 5% noise.
timization Library www.avglab.com/andrew/soft.html, which implements the highest-label push-relabel algorithm for the single max-flow/min-cut problem. Our code provides a MATLAB interface for input and output, and was compiled as a MATLAB MEX-file. All numerical experiments were performed under Linux Version 2.6.9 on a SUN workstation with an AMD Opteron 1214 CPU and 3GB of memory. We used MATLAB 7.6 (R2008a) to load and save images, as well as to call the codes. In the rest of this section, we compare run times of the parametric and divide-and-conquer algorithms and discuss how these times are affected by various parameters. In particular, we demonstrate that the run times are approximately linear in the number of pixels (voxels) in the input image. 6.1. The Parametric Versus Divide-and-Conquer Approaches for Solving the TV/L1 Model. In Table 6.1, we give the running times for solving the TV/L1 model on Barbara using both the parametric and divide-and-conquer algorithms. For solving the TV/L1 model, the former algorithm is more effective than the latter for all λ values and neighborhoods. For each of the four settings, the running time for the latter algorithm is about twice that for the former algorithm on Barbara, which has 228 different gray-scale values. Even though the parametric algorithm had to perform 227 updates to the flow network constructed for the TV/L1 model on Barbara, each of these updates only affected a small number of edges out of s or into t. The total number of updates applied to the capacities of the edges (s, v) and (v, t) is limited to two for each v corresponding to the pixel (i, j). Specifically, they were changed when μ was increased from fi,j
22
GOLDFARB AND YIN
Image Gray-scale Model Algorithm λ Number of neighbors Graph Generation Time (sec) Parametric Max-Flow Time (sec)
to the next gray-scale level. Therefore, it turns out that the total time required by the parametric algorithm for solving the parametric max-flow problems with 228 levels and thus 227 updates is less than the total time for solving essentially 8 different single max-flow problems plus the overhead of 7 update operations. We also observed similar results in applying the TV/L1 model to other images; that is, the parametric algorithm was always more efficient than the divide-and-conquer algorithm. Therefore, for solving the TV/L1 model, we recommend the parametric max-flow algorithm. For this reason, we do not present times for the divideand-conquer algorithm for solving the TV/L1 model applied to three-dimensional MRI images in Section 6.5 below. 6.2. The Effect of the Number of Neighbors p and the Value of λ. In Table 6.1, we also observe that the running times depend on both the number of neighbors and the value of λ. Using the network in which each node is connected to 16 neighbors took both algorithms more running time to find the min-cuts than with 4 neighbors, but the multiplicative factors are well less than four. Using a small λ also caused the running times to increase because smaller λ’s reduce the capacities of the terminal arcs out of s and into t are proportional to λ. The reduced capacities of the terminal arcs reduces the total amount flow into the network. This makes the non-terminal arcs less likely to be saturated, and thus allow the max-flow to have more and longer paths, each carrying less flow on average, from s to t. Consequently, the preflow-push algorithm performs more pushes and label updates before finding a maximum preflow. Since the value of λ affects the performance of the preflow-push algorithm, which is the subroutine of both the parametric and divide-and-conquer algorithms, the same λ-effect was observed for both algorithms applied to both the TV/L1 and ROF models (Ref. Tables 6.2-6.4). 6.3. The Divide-and-Conquer Approach for Solving the ROF Model. For the ROF model, the comparison between the parametric and divide-and-conquer algorithms yielded the opposite result: the divide-and-conquer algorithm was much more efficient that the parametric algorithm. While the divide-and-
PARAMETRIC MAX-FLOWS FOR TV MINIMIZATION
Image Gray-scale Model Algorithm λ Number of neighbors Graph Generation Time (sec) Parametric Max-Flow Time (sec)
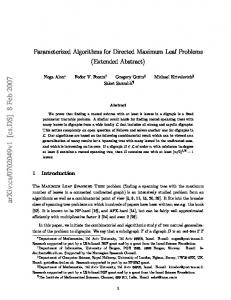
conquer algorithm essentially solves ρ single max-flow problems and incurs an overhead of ρ − 1 updates, the parametric algorithm for the ROF model must perform fmax − fmin + 1 updates, and for each update, the capacities of all arcs into t need to be changed since their capacities depend on μ. The total time spent on these inter-level updates (as many as 255 for an 8-bit grey-scale image versus 7 for the divide-and-conquer algorithm) far outweighs the savings accrued by solving a sequence of max-flow problems in a parametric way utilizing the flow and label information from one problem to the next. Therefore, it was not surprising that the running times of the parametric algorithm for solving the ROF models were so excessive that the parametric algorithm was even far slower than PDE-based and second-order cone programming-based algorithms. Therefore, we did not include the parametric algorithm in any experiments for solving ROF models. Table 6.2 gives the running times of the divide-and-conquer algorithm for solving the ROF models on noisy Barbara with 8-bit and 16-bit gray-scale levels, different lambda values, and different numbers of neighbors. We generated the 16-bit image of noisy Barbara by multiplying the 8-bit image by 2 8 + 1 = 257 because this this scales [0, 28 − 1] to [0, 216 − 1]. Since the TV term is linear but the data fidelity term is 1 quadratic in the gray-scale depth, we need to multiply the data fidelity term by 257 to discount the change of gray-scale depth in order to obtain consistent results from the 8-bit and 16-bit inputs. This is equivalent to dividing λ by 257 when calling the same algorithm on 16-bit images. Since for the 16-bit image of noisy Barbara the divide-and-conquer algorithm took 16 iterations, which doubles those for the 8-bit image of noisy Barbara, the running times on the 16-bit image are also about twice as long as those on the 8-bit image under the same settings of neighborhood and λ. Moreover, in Table 6.2, we observe that the running times are increased if either λ is decreased or the size of neighborhood is increased. The running time of the parametric algorithm for solving the TV/L1 model, however, is not directly affected by the gray-scale depth. No matter what the depth is, the number of sequential max-flows it solves is equal to the number of distinct gray-scale level values in an image, and the total number of capacity updates applied to terminal edges is no more than twice as many as the number of total pixels. Therefore, the running time of the parametric algorithm for solving the TV/L1 model on a 16-bit image, obtained from a 8-bit image by gray-scale multiplication, would be almost the same to that on the 8-bit image. For this reason, we do not present the redundant timing results for solving the TV/L1 model on 16-bit images. 6.4. The TV/L1 Model Applied on the Image CT. The small-scale features in the image CT, depicted in Figure 6.1, make this image a good example for demonstrating the processing by the TV/L1 model. According to the analysis in [51], the TV/L1 model decomposes an image into two parts, one with large-scale cartoons and background, the other with small-scale oscillating features. The selection of scales is determined by the value of λ. The decomposition results obtained with λ = 0.5 and λ = 1.0 using the
24
GOLDFARB AND YIN
Fig. 6.3. The cartoon outputs of the TV/L1 model applied to the image CT with λ = 0.5 (left) and λ = 1.0. (right)
Image Size Modality Gray-scale Model Algorithm λ Number of neighbors Graph Generation Time (sec) Para. Max-Flow Time (sec)
Table 6.4 The TV/L1 and ROF models applied to 3D MRI T1 and T2 images
4-neighborhood are depicted in Figure 6.3. With the smaller λ = 0.5, most fine features in the image CT are kept in the v part, making the u part of the decomposition easier for many image processing tasks, including tracking, segmentation, registration, etc. However, if λ is increased to 1.0, more fine features appear in the u part of the decomposition. In Table 6.3, we give the running times of this experiment with the image CT. Though the images Barbara and CT are very different in content, brightness, contrast, as well as scales of features, by comparing the running times in Table 6.3 of the tests on CT to those in Table 6.1 of the tests on Barbara, we observe that both algorithms took about the same time to process both images. In addition, the running times in Table 6.3 match our previous analysis on how the size of the neighborhood, the value of λ, and the choice of parametric or divide-and-conquer approaches affect the running times. 6.5. 3-dimensional MRI Images. We obtained two 3-dimensional MRI images from BrainWeb at http://www.bic.mni.mcgill.ca/brainweb: MRI-T1 and MRI-T2. T1 and T2 stand for two different modalities for MRI imaging which may give different intensities for the same type of tissue. For example, fat appears bright in T1 images but intermediate dark in T2 images; hemangiomas appear dark in T1 images but bright in T2 images. The in-plane pixel size of the testing MRI images is 1×1mm, and the slice thickness is 1mm. The image size is 181×217×181, so both images have approximately 7.1 million voxels. We also downloaded from BrainWeb T1 and T2 MRI images each with 5% of Gaussian noise. According to BrainWeb, the “percent noise” number represents the percent ratio of the standard deviation of the Gaussian noise versus the signal for a reference tissue. These images are depicted in the second row of Figure 6.2. We applied the TV/L1 model on the noise-free T1 and T2 images, and the ROF model on their
25
PARAMETRIC MAX-FLOWS FOR TV MINIMIZATION
The cartoon outputs of the TV/L1 model applied with λ = 0.5.
The cartoon outputs of the TV/L1 model applied with λ = 1.0.
The denoising outputs of the ROF model applied with λ = 0.3. Fig. 6.4. Results of the TV/L1 and ROF models applied to the three-dimensional MRI images.
noisy counterparts. The running times are given in Table 6.4. For solving these problems, we used the 6-neighborhood for discretizing the TV term, and used two different values of λ for processing each image. Since this was the first time full 3D images were accurately processed by the TV-based models, we present the resulting images, Slides 50 and 100 of each, in Figure 6.4. The running times for this set of experiments on 3-dimensional images are significantly greater than those on 2-dimensional images. However, these times are all less than a minute, suggesting that the TV/L1 and ROF models can be now be practically applied to large-scale 3-dimensional medical images. Consequently, one can consider using the proposed algorithms for preprocessing various medical images for tracking, segmentation, registration, etc. Image Original Size Gray-scale Model Algorithm λ No. of neighbors No. of pixels Graph Gen. Time (sec) Para. Max-Flow Time
Table 6.5 The T V /L1 and ROF models applied to Barbara and CT that are 4 times smaller and larger than the original. The results show that the run times of both codes are approximately linear in the number of pixels.
26
GOLDFARB AND YIN
Image Original Size Gray-scale Model Algorithm λ No. of neighbors No. of pixels Graph Gen. Time (sec) Para. Max-Flow Time
Table 6.6 The T V /L1 and ROF models applied to 3D MR images that are 8 times smaller than the original. The results show that the run times of both codes are approximately linear in the number of pixels.
6.6. The Effect of the Number of Pixels on Run Times and Memory. We found that the run times are approximately linear in the total number of pixels (voxels) given that all other parameters are fixed. To demonstrate this, we applied our codes to the 2D images Barbara and CT and the 3D MR images T1 and T2 in new sizes. To the 512×512 images Barbara and CT each, we generated two new images by cropping the center into a smaller 256×256 piece with a quarter of the pixels and replicated the image four times and combined them into a larger 1024×1024 image with four times as many pixels. For the 181×217×181 images T1 and T2 each, we obtained a smaller image from the central 90×106×90 pixels with 1/8 the number of pixels with respect to the original one. The run time results are given in bold in Tables 6.5 and 6.6. Although it seems that the run times grow slightly faster than linearly according to these results, the same experiments on a laptop with an Intel Core Duo CPU gave run times that are almost exactly linear in the number of pixels. This difference suggests that computer architecture factors such as memory size, bus speed, and the amount of cache may have slightly increased the rate of growth. Memory required by our algorithm grows linearly with the number of pixels. It is dominated by the data of graph nodes and arcs. Each node or arc takes a certain number of bytes to store its associated status, as well as pointers (memory references) to out-going arcs (for nodes), and reverse arcs and head nodes (for arcs). While it is difficult to determine the exact amount of memory required by our code because it is called through MATLAB, which itself takes varying amounts of memory, we observed that the peek memory usages on our 3GB-memory PC reported by the system utility “top” were 6.2%, 6.3%, and 53.0% for 8-bit 512 × 512 images with a 16-neighbor setting, 16-bit 512 × 512 images with a 16-neighbor setting, and 8-bit 181 × 217 × 181 images with a 6-neighbor setting. At idle, MATLAB took 2.9% of memory. 7. Conclusion. This paper focuses on super-fast algorithms for solving the TV based L1 and L2 models as parametric max-flow/min-cut problems. To obtain the max-flow/min-cut formulations, we anisotropically discretize total variation using different neighborhood sizes for different accuracies, and decompose each resulting discretized problem into a sequence of decoupled problems in binary variables, each of which we show to be a min-cut problem in a constructed flow network. A solution of the original TV/L1 or ROF model is constructed from a sequences of nested min s-t cuts, that we obtain using a parametric max-flow/min-cut algorithm modified from Goldberg and Tarjan’s preflow algorithm [26] and Gallo, Grigoriadis, and Tarjan’s parametric preflow algorithm [25]. Our MATLAB/C++ based codes appear to be much faster than any non-graph/network based code and is able to process a full 3-dimensional brain MR image over 7 million voxles on a standard workstation in less than a minute. Our codes can be downloaded from the second author’s homepage.
PARAMETRIC MAX-FLOWS FOR TV MINIMIZATION
27
Finally, we note that even though we do not study solving the more general TV/Lp model, for 1 ≤ p < ∞, a method similar to the one for the ROF model can solve this model. It is also straightforward to extend our method to solving models with a weighted TV and/or weighted Lp -fidelity term. Acknowledgement. We want to thank Jerome Darbon, Paul Rodriguez, William Symes, Yilun Wang, Brendt Wohlberg, and Yin Zhang for their helpful discussions and comments.
28
GOLDFARB AND YIN REFERENCES
[1] W. K. Allard. On the regularity and curvature properties of level sets of minimizers for denoising models using total variation regularization; I. Theory. Preprint, 2006. [2] S. Alliney. Digital filters as absolute norm regularizers. IEEE Transactions on Signal Processing, 40(6):1548–1562, 1992. [3] S. Alliney. Recursive median filters of increasing order: a variational approach. IEEE Transactions on Signal Processing, 44(6):1346–1354, 1996. [4] S. Alliney. A property of the minimum vectors of a regularizing functional defined by means of the absolute norm. IEEE Transactions on Signal Processing, 45(4):913–917, 1997. [5] M. L. Balinski. On a selection problem. Management Science, 17:230–231, 1970. [6] Y. Boykov and V. Kolmogorov. An experimental comparison of min-cut/max-flow algorithms for energy minimization in vision. In Energy Minimization Methods in Computer Vision and Pattern Recognition, volume 2134 of Lecture Notes in Computer Science. Springer Berlin / Heidelberg, 2001. [7] Y. Boykov and V. Kolmogorov. Computing geodesics and minimal surfaces via graph cuts. IEEE International Conference on Computer Vision, 1:26–33, 2003. [8] Y. Boykov and V. Kolmogorov. An experimental comparison of min-cut/max- flow algorithms for energy minimization in vision. IEEE Transactions of Pattern Analysis and Machine Intelligence, 26(9):1124–1137, 2004. [9] Y. Boykov and V. Kolmogorov. maxflow-v3.0. http: // www. adastral. ucl. ac. uk/ ∼vladkolm/ software/ maxflow-v3. 0. src. tar. gz , 2004. [10] A. Chambolle. An algorithm for total variation minimization and applications. Journal of Mathematical Imaging and Vision, 20:89–97, 2004. [11] A. Chambolle. Total variation minimization and a class of binary MRF models. Technical Report UMR CNRS 7641, Ecole Polytechnique, 2005. [12] T. F. Chan and S. Esedoglu. Aspects of total variation regularized L1 function approximation. SIAM Journal on Applied Mathematics, 65(5):1817–1837, 2005. [13] T. F. Chan, H. M. Zhou, and R. H. Chan. Continuation method for total variation denoising problems. Technical Report CAM 95-18, UCLA, 1995. [14] T. Chen, T. Huang, W. Yin, and X. S. Zhou. A new coarse-to-fine framework for 3D brain MR image registration. In Computer Vision for Biomedical Image, volume 3765 of Lecture Notes in Computer Science, pages 114–124. Springer, 2005. [15] T. Chen, W. Yin, X. S. Zhou, D. Comaniciu, and T. Huang. Total variation models for variable lighting face recognition. IEEE Transactions on Pattern Analysis and Machine Intelligence (PAMI), 28(9):1519–1524, 2006. [16] T. Chen, W. Yin, X. S. Zhou, D. Domaniciu, and T. Huang. Illumination normalization for face recognition and uneven background correction using total variation based image models. In 2005 IEEE Computer Society Conference on Computer Vision and Pattern Recognition (CVPR’05), volume 2, pages 532–539, San Diego, 2005. [17] J. Cheriyan and S. N. Maheshwari. Analysis of preflow push algorithms for maximum network flow. SIAM Journal on Computing, 18:1057–1086, 1989. [18] B. V. Cherkassky. A fast algorithm for computing maximum flow in a network. Transactions of the American Mathematical Society, 156:23–30, 1994. [19] B. V. Cherkassky. On implementing the push-relabel method for the maximum flow problem. Algorithmica, 19(4):390–410, 1997. [20] T. H. Cormen, C. E. Leiserson, R. L. Rivest, and C. Stein. Introduction to Algorithms, Second Edition. McGraw-Hill Higher Education, 2002. [21] J. Darbon. Total variation minimization with L1 data fidelity as a constrast invariant filter. In the Electronic Proceddings of the 4th International Symposium on Image and Signal Processing and Analysis (ISPA 2005), Zagreb, Croatia, 2005. [22] J. Darbon and M. Sigelle. Image restoration with discrete constrained total variation, Part I: fast and exact optimization. Journal of Mathematical Imaging and Vision, 26(3):261–276, 2006. [23] U. Derigs and W. Meier. Implementing Goldberg’s max-flow algorithm. ZOR – Methods and Models of Operations Research, 33:383–403, 1989. [24] H. Y. Fu, M. K. Ng, M. Nikolova, and J. L. Barlow. Efficient minimization methods of mixed l2-l1 and l1-l1 norms for image restoration. SIAM Journal on Scientific Computing, 27(6):1881–1902, 2006. [25] G. Gallo, M. D. Grigoriadis, and R. Tarjan. A fast parametric maximum flow algorithm and applications. SIAM Journal on Computing, 18(1):30–55, 1989. [26] A. V. Goldberg and R. Tarjan. A new approach to the maximum flow problem. Journal of the Association for Computing
PARAMETRIC MAX-FLOWS FOR TV MINIMIZATION
29
Machinery, 35:921–940, 1988. [27] D. Goldfarb and W. Yin. Second-order cone programming methods for total variation based image restoration. SIAM Journal on Scientific Computing, 27(2):622–645, 2005. [28] D. M. Greig, B. T. Porteous, and A. H. Seheult. Exact maximum a posteriori estimation for binary images. Journal of the Royal Statistical Society, Series B (Methodological), 51(2):271–279, 1989. [29] D. Gusfield and C. Martel. A fast algorithm for the generalized parametric minimum cut problem and applications. Algorithmica, 7:299–519, 1992. [30] D. Hochbaum. An efficient algorithm for image segmentation, markov random fields and related problems. Journal of the Association for Computing Machinery, 48(4):686–701, 2001. [31] K. Ito and K. Kunisch. An active set strategy for image restoration based on the augmented Lagrangian formulation. Mathematical Modelling and Numerical Analysis, 33(1):1–21, 1999. [32] V. Kolmogorov and R. Zabih. What energy functions can be minimized via graph cuts? IEEE Transactions on Pattern Analysis and Machine Intelligence, 26(2):147–159, 2004. [33] Y. Li and F. Santosa. A computational algorithm for minimizing total variation in imagerestoration. IEEE Transactions on Image Processing, 5(6):987–995, 1996. [34] M. Nikolova. Minimizers of cost-functions involving nonsmooth data-fidelity terms. SIAM Journal on Numerical Analysis, 40(3):965–994, 2002. [35] M. Nikolova. A variational approach to remove outliers and impulse noise. Journal of Mathematical Imaging and Vision, 20(1-2):99–120, 2004. [36] M. Nikolova. Weakly constrained minimization. application to the estimation of images and signals involving constant regions. Journal of Mathematical Imaging and Vision, 21(2):155–175, 2004. [37] J. C. Picard and M. Queyranne. Selected applications of minimum cuts in networks. INFOR Journal (Canada), 20:394– 422, 1982. [38] J. C. Picard and H. D. Ratliff. Minimum cuts and related problems. Networks, 5:357–370, 1975. [39] G. Poggi and A. R. P. Ragozini. Image segmentation by tree-structured Markov random fields. IEEE Signal Processing Letters, 6:155–157, 1999. [40] M. Rivera and J. C. Gee. Two-level MRF models for image restoration and segmentation. In Proceedings of the British Machine Vision Conference, volume 2, pages 809–818, London, 2004. [41] L. Rudin, S. Osher, and E. Fatemi. Nonlinear total variation based noise removal algorithms. Physica D, 60:259–268, 1992. [42] D. Strong and T. F. Chan. Edge-preserving and scale-dependent properties of total variation regularization. Inverse Problems, 19:165–187, 2003. [43] C. Vogel. A multigrid method for total variation-based image denoising. In K. L. Bowers and J. Lund, editors, Progress in Systems and Control Theory: Computation and Control IV. Birkh¨ auser, Basel, Switzerland, 1995. [44] C. Vogel and M. Oman. Iterative methods for total variation denoising. SIAM Journal on Scientific Computing, 17(1):227– 238, 1996. [45] C. Vogel and M. Oman. Fast, robust total variation-based reconstruction of noisy, blurred images. 1998, 7(6):813–824, 1998. [46] Y. Wang, J. Yang, W. Yin, and Y. Zhang. A new alternating minimization algorithm for total variation image reconstruction. To appear in SIAM Journal on Imaging Sciences, 2007. [47] B. Wohlberg and P. Rodriguez. An iteratively reweighted norm algorithm for minimization of total variation functionals. Submitted to IEEE Signal Processing Letters, 2007. [48] J. Yang, W. Yin, Y. Zhang, and Y. Wang. A fast algorithm for edge-preserving variational multichannel image restoration. Rice University CAAM Technical Report TR08-09, 2008. [49] J. Yang, Y. Zhang, and W. Yin. An efficient TVL1 algorithm for deblurring multichannel images corrupted by impulsive noise. Rice University CAAM Technical Report TR08-12, 2008. [50] W. Yin, T. Chen, X. S. Zhou, and A. Chakraborty. Background correction for cDNA microarray image using the T V + L1 model. Bioinformatics, 21(10):2410–2416, 2005. [51] W. Yin, D. Goldfarb, and S. Osher. The total variation regularized L1 model for multiscale decomposition. SIAM Journal on Multiscale Modeling and Simulation, 6(1):190–211, 2006. [52] B. A. Zalesky. Network flow optimization for restoration of images. Journal of Applied Mathematics, 2(4):199–218, 2002. [53] W. P. Ziemer. Weakly Differentiable Functions: Sobolev Spaces and Functions of Bounded Variation. Graduate Texts in Mathematics. Springer, 1989.