826
IEEE TRANSACTIONS ON SPEECH AND AUDIO PROCESSING, VOL. 11, NO. 6, NOVEMBER 2003
Particle Filtering Algorithms for Tracking an Acoustic Source in a Reverberant Environment Darren B. Ward, Member, IEEE, Eric A. Lehmann, Student Member, IEEE, and Robert C. Williamson, Member, IEEE
Abstract—Traditional acoustic source localization algorithms attempt to find the current location of the acoustic source using data collected at an array of sensors at the current time only. In the presence of strong multipath, these traditional algorithms often erroneously locate a multipath reflection rather than the true source location. A recently proposed approach that appears promising in overcoming this drawback of traditional algorithms, is a statespace approach using particle filtering. In this paper we formulate a general framework for tracking an acoustic source using particle filters. We discuss four specific algorithms that fit within this framework, and demonstrate their performance using both simulated reverberant data and data recorded in a moderately reverberant office room (with a measured reverberation time of 0.39 s). The results indicate that the proposed family of algorithms are able to accurately track a moving source in a moderately reverberant room. Index Terms—Acoustic signal processing, generalized cross-correlation, localization, particle filters, time-delay estimation.
I. INTRODUCTION
T
HE problem of locating and tracking a wideband acoustic source in a multipath environment arises in several fields, including sonar, seismology, and speech. In this paper we are particularly interested in speech, where applications include automatic camera steering for video-conferencing, discriminating between individual talkers in multisource environments, and providing steering information for microphone arrays [1]. Traditional approaches to the above problem collect data from several microphones and use a frame of data obtained at the current time to estimate the current source location. These traditional approaches can be divided into two categories: i) time-delay estimation (TDE) methods such as the well-known generalized cross-correlation (GCC) function [2], which estimate location based on the time delay of arrival of signals at the receivers and ii) direct methods such as steered beamforming. Each method transforms the received frame of data into a function that exhibits a peak in the location corresponding to the source. We will refer to this function as the localization function. The practical disadvantage of these traditional approaches is that reverberation causes spurious peaks to occur in the localization function. These spurious Manuscript received November 2, 2002; revised April 23, 2003. This work was supported by the Australian Research Council. The associate editor coordinating the review of this manuscript and approving it for publication was Dr. Walter Kellermann. D. B. Ward is with the Department of Electrical and Electronic Engineering, Imperial College London, SW7 2BT, U.K. (e-mail:
[email protected]). E. A. Lehmann and R. C. Williamson are with the Department of Telecommunications Engineering, Research School of Information Sciences and Engineering, The Australian National University, Canberra ACT 0200, Australia. Digital Object Identifier 10.1109/TSA.2003.818112
peaks may have greater amplitude than the peak due to the true source, so that simply choosing the maximum peak to estimate the source location may not give accurate results. A promising technique that overcomes the drawback of traditional methods is to use a state-space approach based on particle filtering (PF), as recently described in [3], [4]. The key to these new techniques is that the peak due to the true source follows a dynamical model from frame to frame, whereas there is no temporal consistency to the spurious peaks. Using a sequential Monte Carlo method, particle filters are used to recursively estimate the probability density of the unknown source location conditioned on all received data up to and including the current frame. Related work on using particle filters to track multiple moving targets can be found in [5]. In this paper, we formulate a general framework for acoustic source localization using particle filters. We assume the presence of a single acoustic source in a reverberant environment, in which the speed of wave propagation is known (and constant), and the sensor positions are also known. The paper is organized as follows. In Section II, we formulate the source localization problem and present an overview of classical methods. These classical methods are used as a reference to compare with the tracking ability of the particle filter algorithms developed later in this paper. The general framework we propose for acoustic source localization using particle filters is described in Section III. In Section IV, we present a detailed summary of four different algorithms that fit within this framework, including those proposed in [3], [4]. Section V gives a description of the different parameters used to assess the tracking accuracy of each algorithm. In Sections VI and VII, we then present a series of experiments to test the particle filtering algorithms and compare them with the classical source localization approaches. These experiments involve both simulations based on the image method [6], and data obtained from recordings performed in a real office room. II. SOURCE LOCALIZATION A. Signal Model sensors positioned arbitrarily and Consider a collection of located in a multipath environment. Assuming a single source, the discrete-time signal received at the th sensor (where ) is (1) is the complete impulse response from the source where is the source signal, is additive to the th sensor, noise (assumed to be uncorrelated with the source signal and from sensor to sensor), and denotes convolution. The impulse
1063-6676/03$17.00 © 2003 IEEE
WARD et al.: PARTICLE FILTERING ALGORITHMS FOR TRACKING AN ACOUSTIC SOURCE IN A REVERBERANT ENVIRONMENT
response from the source to any sensor can be separated into direct path and multipath terms, giving (2) where (3)
827
as the TDE localization function. As an example, we will consider the TDE localization function for the GCC technique.1 Let denote the data received during a given frame at the th sensor of the th sensor pair, with denoting the total denoting the Fourier transform, number of pairs.2 With represents the frequency domain data received during time frame at the sensors in the th pair. With denoting the th element of the vector , the th element of the TDE localization function for the GCC technique is then
is the sensor is the source location in Cartesian coordinates, is the component of the impulse response belocation, tween the source and the th sensor due to multipath only, and denotes the vector 2-norm. The delay from the source to the th sensor is
is a weighting term. One common choice where for this weighting term is
(4)
(9)
where is the speed of wave propagation. Assume that the data at each sensor are collected over a frame of samples, and let
which results in the well-known PHAT localization algorithm [2]. For the th pair of sensors, the TDE is determined as
(5)
(10)
th sensor for frame . Stack the sensor matrix
Determining the TDEs for all pairs requires one-dimensional searches over the scalar space of possible time delays. For each pair of sensors and TDE, the locus of potential source locations in a two-dimensional setting is a line (or in three-dimensions is a hyperboloid). The source location is then estimated as the location which best fits the potential source loci across all sensor pairs. There has been a large amount of work in the literature concerning how to find this best fit (see e.g., [8]–[11]). In the simulation and experimental results of the TDE methods (GCC and AEDA) presented in Sections VI as that minimizing and VII, we define the source location the distance to each intersection point of the bearing lines with each other. Intersection points lying outside the room boundary are discarded, which provides an effective way of diminishing the contribution of outliers in the TDE measurements. This method is similar to that proposed in [9] and has shown a good performance for the present work compared to other variants proposed in the literature. For the specific implementation of AEDA, we have used subsample interpolation of the delays. During each frame, we have also discarded TDEs obtained from those microphone pairs that produce a TDE that is physically not possible given the microphone spacing and sample rate used. In practice, there are two major drawbacks with the traditional TDE approach: (i) although the true source location will usually correspond to a peak in the TDE localization function, in the presence of multipath it may not always be the global maximum; and (ii) in the presence of noise there is usually no single point at which the source loci from different sensor pairs intersect. These two drawbacks have also been addressed recently in
denote the data at the frames to form the
.. .
(6)
which represents the data received at the array during time frame . We will refer to as the raw data. The problem is to estimate the current location of the source from the raw data. B. Traditional Approach Classical source localization algorithms attempt to determine the current source location using data obtained at the current time only. There are essentially two methods used: time-delay estimation methods (which estimate location based on the time delay of arrival of signals at the receivers) and direct methods. Each method transforms the raw data into a function that exhibits a peak in the location corresponding to the source. Here we briefly review these two methods. 1) TDE Method: Many conventional source localization algorithms partition the sensors into pairs, and attempt to find a time-delay estimate (TDE) for each pair of sensors. These TDEs can be obtained using a variety of techniques, including the adaptive eigenvalue decomposition algorithm (AEDA) [7] and the well-known generalized cross-correlation (GCC) function [2] (and its variants). These techniques act to transform the raw data into another functional form from which time delays can be estimated. Specifically, for a given time delay , let the -dimensional measurement (where is the number of sensor pairs) be (7) is the (algorithm-dependent) function that transwhere forms the raw data to a localization measure that exhibits a peak corresponding to the true source location. We will refer to
(8)
1Note that AEDA differs from GCC in that it returns a single time delay estimate, whereas GCC produces a function which has the TDE as the independent variable. The localization function for AEDA is therefore a delta function. Hence, it cannot be used with the pseudo-likelihood function described in Section III, although it could be used with the Gaussian likelihood function. 2If each sensor belongs to only one pair, the number of sensors M is even, and the sensor pairs are indexed in order, then x (t) x (t), p = 1; . . . ; P , i = 1; 2, P = M=2.
828
IEEE TRANSACTIONS ON SPEECH AND AUDIO PROCESSING, VOL. 11, NO. 6, NOVEMBER 2003
[12] using the notion of realizable delay vectors. Note that TDE methods are an indirect approach to source localization, since they rely on a two-stage algorithm, viz., first estimate time delays for different pairs, then combine these time delays to find the source location. 2) Direct Method: In contrast to the TDE method, direct methods attempt to estimate the source location vector without recourse to pairwise TDEs. In this case, let the scalar measurement be (11) is the direct lowhere is the source location vector, and calization function. As an example of a direct localization function, consider the frequency-averaged output power of a steered beamformer (SBF) [13], [14]. denote the frequency domain data Let received at the th sensor during a given time frame . For a beamformer steered to the location , the localization function is (12) where the integration is computed over the frequency range of is a frequency weight, and interest, (13) is the complex-valued beamformer weighting term on the th the gain applied to the th sensor signal, sensor, with the sensor location, and the distance to some reference point (typically chosen as the centre of the sensor array). If , then corresponds to a conventional delay-and-sum beamformer. It was shown in [15] that, if the is chosen according to the signal gain level of the sensor gain source at the th sensor, then the frequency-averaged steered beamformer output is the optimal maximum likelihood solution to locate wideband signals. It is also stated in [15] that there is no significant performance degradation if the gain is chosen as unity or is modeled by the direct path attenuation only. The source location is estimated from the localization function as (14) Determining the source location requires a single multidimensional search over the vector space of possible source locations. Although direct methods do not require the calculation of intermediate time delays, a multidimensional search over source locations is required—this is potentially computationally very demanding. Finally, observe the similarity between the direct method (12) and the time-delay method (8). In fact, it was shown in [15] that these methods are equivalent when GCC is performed across chosen according to the signal gain all sensor pairs with levels at the sensors in the th pair, and the beamforming sensor is chosen according to the signal gain level at the th gain sensor.
III. FRAMEWORK FOR SOURCE LOCALIZATION USING PARTICLE FILTERING A. Development of a General Framework In this section we formulate a general framework for source localization based on particle filtering (PF). We use a first order model of the source dynamics and define the source state at time as (15) is the true source location in Cartesian cowhere is the source velocity. For a given ordinates, and state , we will denote the location vector of the state as . of the unobserved At time , assume that a measurement state becomes available. This measurement is described by the state-space equation (16) is an unknown, not necessarily linear, function of where . Assume also that the state is the state and a noise term a Markov process, which can be modeled by the state transition relation (17) is a known, not necessarily linear, function of the where . previous state and a noise term is obtained through some Physically, the measurement transformation of the raw data (18) as where we refer to as the localization parameter and the localization function. Observe that the measurements in both the TDE (7) and direct (11) methods can be described by (18). is a -dimensional vector and is a For the TDE method, is a scalar scalar time delay, whereas for the direct method, and is a location vector. The common description of (18) will be used in the sequel. One should note that (16) is a state-space equation that describes the measurements as a function of the unobserved state, whereas (18) describes how the measurements are physically obtained from the raw data. denote the concatenation of all meaLet surements up to time . The aim is then to recursively estimate —the source lothe conditional probability density cation can be estimated as the mean or mode of this density function. Unfortunately, this posterior filtering density is usually unavailable in practice. However, assuming that the posteis available, then the posterior at time rior density at time can be found through prediction and update as [16]
(19a) (19b) is the prior, is the state tranwhere is the likelihood (or measurement sition density, and density).
WARD et al.: PARTICLE FILTERING ALGORITHMS FOR TRACKING AN ACOUSTIC SOURCE IN A REVERBERANT ENVIRONMENT
829
In general no closed-form solution exists for (19), except and in (16) and (17) are in the special case where and are Gaussian. linear, and the noise processes In this case the Kalman filter is the optimal solution. For the acoustic source tracking problem these functions are nonlinear, and hence, the Kalman filter cannot be used directly. A local linearization of the nonlinearity is possible, however, through the extended Kalman filter (see e.g.,[17]). An excellent tutorial overview of other suboptimal solutions to (19) is given in [18]. The approach that we will adopt in this paper is particle filtering. This technique is suitable for nonlinear functions and non-Gaussian noise, and approximates (19) through Monte Carlo simulation of a set of particles (representing samples of the source state) having associated discrete probability masses. As the number of particles becomes very large this set of samples and weights tends to the true distribution, and the particle filter becomes the optimal Bayesian solution to the tracking problem. The generic particle filtering algorithm is described in [18]. With this framework in place, the general algorithm that we propose for source tracking using particle filters is described in Fig. 1. This is a standard particle filtering algorithm, and only steps 2)–4) are specific to the source tracking problem. In implementing this algorithm, there are three algorithmic choices to be made: 1) what model to use for the source dynamics in Step 2); ii) what localization function to use in Step 3); and iii) how to calculate the likelihood function in Step 4). We note that there is also choice to be made in deciding the precise implementation of the PF algorithm, although we will not deal with the many variants of PF methods in this paper (refer to [18], [19] for a review of these algorithms). B. Source Dynamics
Fig. 1.
There are several dynamical models that could be used to represent the time-varying location of a person moving in a typical room, e.g., [20]. One that is reasonably simple but has been shown to work well in practice is the Langevin model used in [3]. In this model the source motion in each of the Cartesian coordinates is assumed to be independent. In the -coordinate, this motion is described as [3]: (20a) (20b) (20c) (20d) is a normally distributed random variable, where is the time period separating two location estimates (with being the frame length in samples and denoting the samis the steadypling frequency), is the source velocity, and state RMS velocity. The model parameters suggested by [3] are , and ; we use these parameter values in our experiments (unless stated otherwise). The dynamics and parameters for the other Cartesian dimensions are identical. In the sequel, we will use (20) to model the source dynamics.
Generic particle filtering algorithm for source tracking.
C. Localization Function The localization function should be chosen such that it has a maximum corresponding to the true source location. It is likely that due to multipath, the localization function may also have peaks at false locations. It is also likely that the true location may not always be the global maximum. There are two classes of possible localization function, corresponding to the two methods used for conventional source localization, viz., TDE and direct methods. 1) TDE Localization Function: In TDE localization, the sensor array is partitioned into pairs, and the measurement is formed according to (18), where is a scalar time delay, and is a vector. The localization function for the th pair . Assume of sensors is denoted by measurements, possible TDEs that from each of these are obtained, with the th TDE for the th sensor pair denoted . These potential TDEs by largest local maxima of would typically be obtained as the . A practical example of an implementation of the TDE localization function is the GCC function given in (8). Note that the localization function can be quite general, incorporating several different TDE algorithms simultaneously. For potential TDEs could be obtained by example, one of the
830
IEEE TRANSACTIONS ON SPEECH AND AUDIO PROCESSING, VOL. 11, NO. 6, NOVEMBER 2003
AEDA with the remaining potential TDEs obtained from the peaks of the GCC. 2) Direct Localization Function: In direct localization, the measurement is given by (18), where is the location vector, and is a scalar. Assume that from this measurement, potential source location vectors are obtained as the largest local maxima , and denote the th potential location as of . A practical example of an implementation of a direct localization function is the steered beamforming function in (12).
where is the th potential location obtained from the th sensor pair, and (24) the location is the TDE corresponding to the state, with of the th sensor in the th pair. Assuming that the measurements across sensor pairs are independent, the complete likelihood function becomes (25)
D. Likelihood Function For a given state , the likelihood function measures the likelihood of receiving the data . The likelihood function should be chosen to reflect the fact that peaks in the localization function correspond to likely source locations. It should also reflect the fact that occasionally there may be no peak in the localization function corresponding to the true source location (such as when the source is silent). The position of the peak may also have slight errors due to noise and sensor calibration errors. We propose the following two classes of likelihood function. 1) Gaussian Likelihood: The Gaussian likelihood function we develop here is essentially identical to that proposed in [3]. If potential locations have been obtained from the localization function, then the Gaussian likelihood function is formed by assuming that either one of these potential locations is due to the true source location corrupted by additive Gaussian noise, or none of the potential locations is due to the true source location. There are two possible ways of forming the likelihood function, depending on whether a TDE or direct localization function is used. For a direct localization function, the likelihood function is formed as
2) Pseudo-Likelihood: The idea behind this approach is that the localization function itself is typically a continuous function which could be used directly as the basis of a pseudo likelihood function. A lower bound is included to allow for the case where no peak in the localization function corresponds to the true source location. Again, there are two possible ways of forming the likelihood function, depending on whether a TDE or direct localization function is used. For a direct localization function, the pseudo-likelihood function we propose is (26) , , and . The purpose of is to where help shape the localization function to make it more amenable ensures that to recursive estimation. The design parameter the pseudo-likelihood function is nonnegative (since the localcan be negative), and also fulfils a role ization function similar to that of in the Gaussian likelihood. For a TDE localization function, the pseudo-likelihood function is
(21) denotes a Gaussian distribution with mean where and variance evaluated at . The potential locations obtained from the localization function are denoted by , and is the localization parameter corresponding to the state. is the prior probability that none of The value of the potential locations is due to the source location,3 and is the prior probability that the th potential location is the true source location. Without prior knowledge of likely source locations, one would typically choose (22) For a TDE localization function, the likelihood function for the th sensor pair is
(27) where (28) given by (24), , and . with 3) Discussion: The Gaussian likelihood has the advantage that it treats all peaks as being equally likely, although it requires a search over the localization function to find the peaks. The pseudo-likelihood does not require such a search, but imposes a weighting on the possible source positions proportionally to the localization function (i.e., a larger peak will be treated as a more likely source location than a smaller peak—this implicit weighting may not always be advantageous). IV. SUMMARY OF PROPOSED ALGORITHMS
(23)
q
3A larger value of indicates that the true source location is often not among the candidates. This is likely in cases where there is a high level of reverberation, or the source is often silent.
K
The framework developed in Section III is rather general and can be implemented using a wide class of TDE or direct localization schemes. To clarify this development, here we summarize four specific PF algorithms corresponding to each of the likelihood-localization pairs that we proposed in Section III.
WARD et al.: PARTICLE FILTERING ALGORITHMS FOR TRACKING AN ACOUSTIC SOURCE IN A REVERBERANT ENVIRONMENT
831
A. GCC Localization With Gaussian Likelihood (GCC-GL) Organize the sensor array into pairs. Implement the PF algorithm in Fig. 1, with steps 3) and 4) as follows. Step 3: For each sensor pair, calculate the GCC (8) across a set of candidate time delays. Find the largest local maxima in the GCC function and denote the corresponding time delays as . Step 4: For each resampled state calculate the likelihood function using (23)–(25). B. GCC Localization With Pseudo-Likelihood (GCC-PL) pairs. Implement the PF Organize the sensor array into algorithm in Fig. 1, with steps 3) and 4) as follows. Step 3: For each sensor pair, calculate the GCC (8) only at the time delays , where these time corresponding to the resampled states delays are found using (24). Step 4: For each resampled state calculate the likelihood function using (24), (27) and (28). C. SBF Localization With Gaussian Likelihood (SBF-GL) Implement the PF algorithm in Fig. 1, with steps 3) and 4) as follows. Step 3: Calculate the steered beamformer output power (12) over a set of candidate source locations. Find the largest local maxima in the output power function and denote . Step the corresponding location vectors as calculate the likelihood function 4: for each resampled state using (21). D. SBF Localization With Pseudo-Likelihood (SBF-PL) Implement the PF algorithm in Fig. 1, with steps 3) and 4) as follows. Step 3: calculate the steered beamformer output power only at the set of location vectors corresponding to the resam. Step 4: for each resampled state calculate pled states using (26). the likelihood function
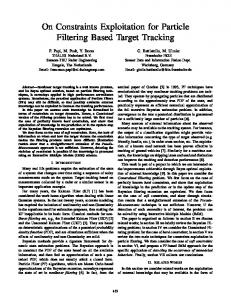
Fig. 2.
RT
Typical microphone signal simulated with the image method for
= 132 ms.
resampled states. No multidimensional searches are required. This algorithm was proposed in [4]. V. ANALYSIS OF THE TRACKING ACCURACY In Sections VI and VII, we will present the results from a series of experiments using simulated as well as real audio data, performed in order to determine the performance of the various algorithms proposed in Section IV together with traditional algorithms presented in Section II-B. These tests allow for a comparative assessment of the tracking ability of each method when used in a moderately reverberant and noisy environment. We first give a brief description of the different parameters used to assess the overall tracking accuracy for each algorithm simulation. Three different parameters have been implemented in order to provide a reproducible and algorithm-independent assessment of the tracking ability. Only the first parameter (root mean square error) is applicable to the traditional localization methods described in Section II-B; the other two are based on the specific distribution of the particles for PF algorithms. 1) Root Mean Square Error (RMSE): For each frame of raw received from the sensors, the tracking algorithm dedata of the current source location. The livers an estimate square error for time frame is computed as:
E. Discussion Algorithm A (GCC-GL) requires the calculation of separate GCC functions across a set of time delays. It also requires one-dimensional searches to find the candidate TDEs. This algorithm is essentially that proposed in [3]. Note that the GCC can be implemented efficiently using the FFT, although the time delays are restricted to a specific set of values (determined by the sampling frequency and the number of points in the FFT). separate Algorithm B (GCC-PL) requires calculation of GCC functions only at the specific time delays corresponding to the resampled states. It is not necessary to perform any searches. Because the time delays are determined by the resampled states, however, the FFT cannot be used to calculate the GCC in this algorithm. Algorithm C (SBF-GL) requires the calculation of a steered beamformer response over the set of all possible source locations (this set is potentially very large). Furthermore, it requires a multidimensional search to find the candidate source locations. We believe that this particular algorithm is too computationally demanding to be viable. Algorithm D (SBF-PL) requires the calculation of the steered beamformer response only at the locations corresponding to the
(29) The RMSE value then corresponds to the square root of the average value of the variable , averaged over the total number of frames in the audio sample. This parameter gives an indication about how much the source location estimate deviates from the true source position. A high RMSE value hence always reflects an inaccurate tracking ability. 2) Mean Standard Deviation (MSTD): For each time frame , the standard deviation of a particle set around its estimate is defined as (30) Similarly to the RMSE parameter, the MSTD value corresponds to the variable averaged over the total number of frames processed by the algorithm. The MSTD parameter is an accuracy measure of the estimated source position delivered by a particle filter. A large value means that the position estimate results from a widely spread particle set, indicating a low level of estimation certainty.
832
IEEE TRANSACTIONS ON SPEECH AND AUDIO PROCESSING, VOL. 11, NO. 6, NOVEMBER 2003
Fig. 3. Example plots showing typical tracking results for two classical and two PF-based methods. Solid lines are the algorithms’ estimate of the source location, dotted lines represent true source position. The audio sample used was simulated with the image method for a reverberation time RT = 132 ms.
3) Frame Convergence Ratio (FCR): We first define the term convergence as follows. For time frame , a particle filter is said to be converging toward the true source position if this latter lies within one standard deviation from the estimated source location . In other words, a particle filter is convergent if the following inequality holds: (31) where accounts for the inaccuracy of the source position measurements during the recording of the audio samples. The parameter FCR is defined as the percentage of frames for which the particle filter has been found to converge, over the entire audio sample length. It must be noted here that the FCR value depends indirectly on the MSTD parameter. If the particles are widely spread around the source location estimate, the probability of the true source lying within one standard deviation of the estimate is higher, which in turn implies a higher FCR value. Hence, a high FCR percentage may be partly resulting from a large MSTD value.
VI. IMAGE METHOD SIMULATIONS In this section, we present the tracking results obtained using synthetic audio data for the classical GCC, AEDA and SBF approaches. Results obtained from algorithms SBF-PL and GCC-GL are also shown here as generic representatives of the PF methods (these two particle filtering methods were presented in [3] and [4], respectively). We consider a two-dimensional tracking problem where the height of the source is set to be the same as the height of all the microphones. A. Simulation Setup For all the results presented in this section, the audio data at each sensor was obtained using the image method for simulating small-room acoustics [6] for a set of reverberation ranging from 0 to 0.79 s. The simulation setup was times defined to match the experimental setup used in Section VII as closely as possible: the room dimensions were set to 2.9 m 3.83 m 2.7 m, and 8 microphones were used in total,
WARD et al.: PARTICLE FILTERING ALGORITHMS FOR TRACKING AN ACOUSTIC SOURCE IN A REVERBERANT ENVIRONMENT
the positions of which were defined as shown in Fig. 5 at the constant height of 1.464 m. A single sample of simulated audio data has been used to obtain the results presented in this section. Fig. 5 shows the corresponding source trajectory (distance of approximately 1.6 m) defined for the image method simulations. The source signal used was the speech utterance “Draw every outer line first, then fill in the interior” pronounced by a male speaker and looped twice, yielding a length of about 7.2 s. The sensors’ signals were generated by splitting the source signal into 120 frames along the source’s path (resulting in a frame length of about 60.4 ms). The data received at each sensor was obtained by convolving these frames of source signal with the corresponding impulse responses resulting from the image method between the source’s and sensor’s positions. After recombining the convolution results, random Gaussian noise was finally added to each microphone signal yielding an SNR level of about 20 dB. Fig. 2 shows a typical signal generated for microphone 1 using this setup and for a reverberation time of .
833
Fig. 4. Average RMS error for three classical (GCC, SBF, AEDA) and two PF-based (GCC-GL, SBF-PL) source localization methods, plotted versus reverberation time. The audio data was simulated with the image method for small room acoustics.
B. Simulation Results Each of the methods under investigation in this section was values and using the same simulated for a variety of setup as given above. Fig. 3 shows typical tracking results . The tracking obtained for some of them for quality of the classical methods (especially GCC and SBF) rapidly degrades for increasing reverberation times, and plots of the tracking results for these methods become unusable for values. larger Fig. 4 gives a good insight into this kind of behavior. It shows the RMSE obtained for each algorithm as a function of the value resulting from the image method computations. For the two PF algorithms (SBF-PL and GCC-GL), the RMSE plotted in Fig. 4 corresponds to the average RMS error resulting from 100 algorithm runs using the same audio sample and simulation setup. C. Discussion As clearly depicted in Figs. 3 and 4, methods based on a sequential Monte Carlo principle show a distinct improvement in tracking ability compared to more traditional source localization methods. Fig. 4 shows that for practically relevant levels of performance (i.e., for RMSE values close to zero), PF-based methods are able to deal with reverberation levels two to three times higher than classical localization methods. As has been previously reported [7], AEDA consistently gives the best results of the classical techniques. As shown in Fig. 3, the presence of outliers in the observations computed from the raw data appear as spurious peaks in the tracking results of these classical methods. The frequency of these peaks increases dramatically as the reverberation time becomes larger, which results in a deterioration of the overall tracking ability. On the other hand, PF-based methods provide an efficient way of filtering these peaks out and hence prove to be more robust to reverberation and noise.
Fig. 5. Room layout with microphone positions (black circles numbered from 1 to 8, positioned at a constant height of 1.464 m), and showing a typical example of source trajectory (dashed arrow).
VII. REAL AUDIO EXPERIMENTS In Section VI, we have described the tracking accuracy of classical as well as PF-based methods using synthetic audio data. In this section, we use real audio samples recorded in a typical office room to assess the tracking performance of these algorithms when used in a moderately reverberant environment. Again we consider a two-dimensional tracking problem. A. Experimental Hardware Setup The recording environment was a typical office room measuring roughly 2.9 m 3.83 m 2.7 m, with various encased and protruding spaces (windows, door, column, etc.). A number of office furniture objects were also present in the room during the recordings. A near to scale diagram of the room layout is presented in Fig. 5. The level of reverberation in the room was experimentally measured by means of a loudspeaker emitting a high level white noise signal. Measuring the 60 dB decay period of the
834
IEEE TRANSACTIONS ON SPEECH AND AUDIO PROCESSING, VOL. 11, NO. 6, NOVEMBER 2003
TABLE I CHOSEN PARAMETER SETTINGS FOR EACH PF ALGORITHM
Fig. 6. Typical example of microphone signal recorded in real office room. The source signal was the sentence “Draw every outer line first, then fill in the interior” (taken from the TIMIT database) pronounced by a male speaker.
sound pressure level after the source signal is switched off, for a number of speaker and microphone positions, provided the fre. The level quency-averaged reverberation time of noise in the room was comparable to typical office noise levels, including mainly a computer fan and an air-conditioning vent on the ceiling. The average SNR recorded at the microphones for the various experiments was calculated to be 9.4 dB (ranging in value from 6.8 dB for the noisiest experiment, to 16.4 dB for the best). The experimental setup made use of a total of 8 microphones organized as one pair on each wall as depicted in Fig. 5. The moving sound source was generated in the room with a loudspeaker in upright position emitting the desired sound signal and following a predefined path at a constant height of 1.464 m (distance from the floor to the center of the speaker cone). For practical reasons, the source trajectory was always a straight line, showing a variety of lengths and orientations (mainly from one side or corner of the room to the other, within the unused floor area). Fig. 5 shows a typical example of such a source trajectory. Due to the practical method used to move the sound source in the room, a small source of error may have been introduced when monitoring the position of the speaker for the duration of the recording. The maximum deviation of the actual speaker path from the desired source trajectory was estimated to be less than 10 cm in every direction. The measurement inaccuracy parameter in (31) was therefore set to 0.1 m. The audio samples used as source signals were speech utterances by male speakers with a sample length varying from 3.6 s to 7.5 s. Fig. 6 shows a typical example of sensor signal recorded with microphone 1 as the loudspeaker was moving with constant velocity across the room. The sensor signals were all sampled at 8 kHz and band-pass filtered between 300 and 3000 Hz prior to source localization processing. B. Experimental Software Setup 1) Tuning of PF-Based Algorithms: The main objective of the simulations presented in this section is to give a comparison of the classical and PF-based methods described above with each other. In order to ensure a fair algorithm comparison, the parameters of each PF algorithm were independently tuned using a reference audio sample to achieve the best particle filter performance. This process was done empirically by running each algorithm a number of times with varying parameters until a satisfactory performance was achieved. Table I presents the parameter settings chosen for each PF algorithm. For algorithm SBF-GL, the beamformer output power was computed over a set of candidate locations distributed on a grid across the room with a uniform spacing of 0.15 m.
Fig. 7. Beamformer output power function used as pseudo-likelihood in algorithm SBF-PL, for one signal frame.
The PF results given in this section are obtained from the algorithms operating in tracking mode. Higher level problems (e.g., related to the detection and handling of long speech pauses, ways of initializing the particle set at simulation start, etc.) are of course important for a functional system, but we do not examine these issues in the present paper. Consequently, the particle set for each PF algorithm was initialized by placing all the particles at the start location of the sound source in the room. This way, the unpredictable effects of a uniform initial particle distribution were reduced to a negligible level. Thus, we are measuring the ability of the algorithms to track a moving source only. Given the relatively small dimensions of the room, the variand of the source dynamics model given by (20) ables . were set to 0.7 2) Other Considerations: In each algorithm (classical methods included), the incoming sensor signals were split into samples (corresponding to a frame length of frames of 64 ms) multiplied by a Hamming window, and the processing was carried out using a frame overlapping factor of 50%. For the classical SBF method, the output power function of the steered beamformer was computed on a uniformly spaced grid of points across the room with a 0.02 m spacing. C. Experimental Results 1) Example Plots: To illustrate some of the simulation results, we first present some typical plots obtained from algorithm SBF-PL using a sample of real audio data. Fig. 7 shows an example of the function used as pseudo-likelihood plotted for one signal frame over the entire two-dimensional state-space.4 This plot shows clearly the multihypothesis character of the observation: the peak associated with the true 4Note that this figure is shown for illustration purposes only: with algorithm SBF-PL, the likelihood function is evaluated only at the particles’ positions.
WARD et al.: PARTICLE FILTERING ALGORITHMS FOR TRACKING AN ACOUSTIC SOURCE IN A REVERBERANT ENVIRONMENT
835
Fig. 8. Tracking results for one run of algorithm SBF-PL using real audio data, showing the true source trajectory (dotted line) and the estimated path resulting ` ). from the particle filter (solid line). Grey lines represent one standard deviation of the particle set from its weighted mean (estimated source position ^
6
TABLE II EXPERIMENTAL RESULTS: EACH OF THE 6 MAIN ROWS SHOWS THE AVERAGE PERFORMANCE MEASURES (RMSE IN M, MSTD IN M, FCR IN % ) FOR A DIFFERENT SAMPLE OF REAL AUDIO DATA
source is located at the coordinate position , other peaks are clutter measurements due to reverberation. Fig. 8 presents the tracking result in the and coordinates for a 3.8 s run of algorithm SBF-PL. It demonstrates the ability of this method to accurately track the sound source across the room despite the relatively high level of reverberation. This kind of result typically yields tracking quality values of RMSE 0.114 m, MSTD 0.094 m and FCR 95%. 2) Comparative Results: The comparative results shown here have been obtained in the following manner. Each of the four PF methods under test was run 100 times with each one of 6 different samples of real audio data, implying a variety of source signals and trajectories. Since a different level of performance is usually achieved for different source signals and paths, the results obtained for each of the audio samples are given separately. Table II contains the values obtained for the performance assessment parameters averaged over the 100 real audio simulations. As for the classical (SBF, GCC, and AEDA) results presented in this table, a single run of each algorithm has been used to generate the RMSE value for each audio sample. Contrary to PF-based methods (where the resampling and prediction steps introduce some degree of randomness), these classical methods will generate the exact same tracking results when applied twice to the same audio sample.
of tracking difficulty for the algorithms, resulting typically from the quality of the audio signals and the specific trajectory of the sound source. As expected, these comparative results also demonstrate the major tracking improvement of PF-based methods versus classical source localization algorithms. When comparing PF methods only, results from Table II tend to show that algorithm SBF-PL generally works better than the other methods, yielding on average lower RMSE and higher FCR values. However, more simulations using real audio data may be required in order to fully verify this statement. The MSTD values shown in Table II are more or less constant for each PF-based algorithm. This reflects the fact that the MSTD value is mainly resulting from the specific parameter setting chosen for each of these algorithms and that it does not strongly depend on which audio sample is used. To give an indication of the computational complexity of each algorithm, we also measured the CPU time required to process a single audio sample.5 Of the PF methods, both of the pseudo-likelihood algorithms (SBF-PL, and GCC-PL) took 24 s, whereas the Gaussian-likelihood algorithms took 99 s for GCC-GL, and 306 s for SBF-GL. The classical methods required 53 s for GCC, 93 s for AEDA, and several hours for SBF. As well as providing the best performance as measured in Table II, the SBF-PL algorithm is also the most computationally efficient.
D. Discussion In Table II, differences in the overall performance results from one audio sample to the other reflect a variable degree
5We have not attempted to optimize any of the algorithms used. The CPU times reported are based on Matlab implementations.
836
IEEE TRANSACTIONS ON SPEECH AND AUDIO PROCESSING, VOL. 11, NO. 6, NOVEMBER 2003
VIII. CONCLUSIONS Carrying out acoustic source tracking in the practical environment of a moderately reverberant office room is not a trivial task. Even low levels of reverberation or background noise can rapidly become detrimental to classical TDE-based or beamforming methods. Under such adverse conditions, the use of sequential Monte Carlo methods proves to be of advantage compared to these more traditional algorithms. In this paper, we have presented a framework for source tracking using particle filters, and discussed four specific PF-based algorithms, each of them differing from the other in the nature of the observations or in the way the measurement likelihood is computed. Results obtained from three traditional source localization methods have also been investigated and used as reference for an overall comparison of each algorithm’s tracking ability. Using synthetic audio data as well as audio samples recorded in a real office room, we have demonstrated that sequential Monte Carlo methods show a much higher degree of robustness against reverberation and background noise compared to these classical algorithms.
[13] J. H. Dibiase, H. F. Silverman, and M. S. Brandstein, “Robust localization in reverberant rooms,” in Microphone Arrays: Signal Processing Techniques and Applications, M. S. Brandstein and D. B. Ward, Eds. Berlin, Germany: Springer-Verlag, 2001, ch. 8, pp. 157–180. [14] N. Strobel, T. Meier, and R. Rabenstein, “Speaker localization using steered filtered-and-sum beamformers,” in Proc. Erlangen Workshop on Vision, Modeling, and Visualization, Erlangen, Germany, 1999, pp. 195–202. [15] J. C. Chen, R. E. Hudson, and K. Yao, “Maximum-likelihood source localization and unknown sensor location estimation for wideband signals in the near-field,” IEEE Trans. Signal Processing, vol. 50, pp. 1843–1854, Aug. 2002. [16] N. J. Gordon, D. J. Salmond, and A. F. M. Smith, “Novel approach to nonlinear/non-Gaussian bayesian state estimation,” Proc. Inst. Elect. Eng., vol. 140, no. 2, pp. 107–113, Apr 1993. [17] N. Strobel, S. Spors, and R. Rabenstein, “Joint audio-video signal processing for object localization and tracking,” in Microphone Arrays: Signal Processing Techniques and Applications, M. S. Brandstein and D. B. Ward, Eds. Berlin, Germany: Springer-Verlag, 2001, ch. 10, pp. 203–225. [18] M. S. Arulampalam, S. Maskell, N. Gordon, and T. Clapp, “A tutorial on particle filters for online nonlinear/non-Gaussian bayesian tracking,” IEEE Trans. Signal Processing, vol. 50, no. 2, pp. 174–188, Feb. 2002. [19] A. Doucet, N. de Freitas, and N. Gordon, Eds., Sequential Monte Carlo Methods in Practice. Berlin, Germany: Springer-Verlag, 2001. [20] M. Isard and A. Blake, “Condensation-conditional density propagation for visual tracking,” Int. J. Comput. Vis., vol. 29, no. 1, pp. 5–28, 1998.
ACKNOWLEDGMENT The authors thank K. Modrak for the practical measurements and recordings used in Section VII and A. Doucet and N. de Freitas for providing the resampling code used in the particle filter algorithm. REFERENCES [1] M. S. Brandstein and D. B. Ward, Eds., Microphone Arrays: Signal Processing Techniques and Applications. Berlin: Springer-Verlag, 2001. [2] C. H. Knapp and G. C. Carter, “The generalized correlation method of estimation of time delay,” IEEE Trans. Acoust., Speech, Signal Processing, vol. ASSP-24, no. 4, pp. 320–327, 1976. [3] J. Vermaak and A. Blake, “Nonlinear filtering for speaker tracking in noisy and reverberant environments,” in Proc. IEEE Int. Conf. Acoust., Speech, Signal Processing (ICASSP-01), Salt Lake City, UT, May 2001. [4] D. B. Ward and R. C. Williamson, “Particle filter beamforming for acoustic source localization in a reverberant environment,” in Proc. IEEE Int. Conf. Acoust., Speech, Signal Processing (ICASSP-02), Orlando, FL, May 2002. [5] C. Hue, J.-P. Le Cadre, and P. Pérez, “Sequential monte carlo methods for mutliple target tracking and data fusion,” IEEE Trans. Signal Processing, vol. 50, pp. 309–325, Feb. 2002. [6] J. B. Allen and D. A. Berkley, “Image method for efficiently simulating small-room acoustics,” J. Acoust. Soc. Amer., vol. 65, no. 4, pp. 943–950, 1979. [7] J. Benesty, “Adaptive eigenvalue decomposition algorithm for passive acoustic source localization,” J. Acoust. Soc. Amer., vol. 107, no. 1, pp. 384–391, Jan 2000. [8] Y. Huang, J. Benesty, G. W. Elko, and R. M. Mersereau, “Real-time passive source localization: A practical linear-correction least-squares approach,” IEEE Trans. Speech Audio Processing, vol. 9, pp. 943–956, Nov. 2001. [9] M. S. Brandstein, J. E. Adcock, and H. F. Silverman, “A closed-form location estimator for use with room environment microphone arrays,” IEEE Trans. Speech Audio Processing, vol. 5, pp. 45–50, Jan. 1997. [10] E.-E. Jan and J. Flanagan, “Sound source localization in reverberant environments using an outlier elimination algorithm,” in Proc. Int. Conf. Spoken Language Processing, vol. 3, Philadelphia, PA, 1996, pp. 1321–1324. [11] J. O. Smith and J. S. Abel, “Closed-form least-squares source location estimation from range-difference measurements,” IEEE Trans. Acoust., Speech, Signal Processing, vol. 35, pp. 1661–1669, Dec. 1987. [12] S. M. Griebel and M. S. Brandstein, “Microphone array source localization using realizable delay vectors,” in Proc. IEEE Workshop Applications Signal Processing to Audio and Acoust. (WASPAA-01), New Paltz, NY, Oct. 2001.
Darren B. Ward (M’96) was born in Mareeba, Australia, in 1970. He received the B.E. (Hons.) degree in electronic engineering and the B.A.S. degree in computer science from the Queensland University of Technology, Brisbane, Australia, in 1993, and the Ph.D. degree in engineering from the Australian National University, Canberra, in 1997. From 1996 to 1998, he was a Postodoctoral Member of Technical Staff at Bell Labs, Lucent Technologies, Murray Hill, NJ. He has held academic positions at the University of New South Wales and the Australian National University, and since 2000 has been a Lecturer at Imperial College London, U.K. His research interests are in the fields of signal processing and digital communications.
Eric A. Lehmann (S’02) received the Dipl.El.-Ing. diploma from the Swiss Federal University, Zurich, in 1999 and the M.Phil. degree in electrical engineering from the Australian National University (ANU), Canberra, Australia, in 2000. He is currently pursuing the Ph.D. degree at the ANU. His research interests include signal processing, microphone arrays, Bayesian estimation and tracking, with particular emphasis on the application of sequential Monte Carlo methods (particle filters).
Robert C. Williamson (M’90) received the B.E. degree from the Queensland Institute of Technology, Brisbane, Australia, in 1984, and the M.Eng.Sc. (1986) and Ph.D. (1990) degrees from the University of Queensland, Brisbane, all in electrical engineering. Since 1990, he has been at the Australian National University where he is a Professor in the Research School of Information Sciences and Engineering. He is the Director of the Canberra node of National ICT Australia, a member of the Australian Research Council’s Expert Advisory Committee on Mathematics, Information, and Communications Sciences and is on the editorial boards of JMLR and JMLG. His scientific interests include signal processing and machine learning.