shape of natural satellites,3 but were later applied to the imaging of artificial ... resolve meaningful shape estimates, and therefore are only effective for .... Freflect(i) = Rspec(i) + (1 â Rspec (i))(1 â uI ... The sets of particles and their associated weights representing the pdf at tk .... shown the geometry of the simple test case.
AAS 14-210
PARTICLE FILTERING LIGHT CURVE BASED ATTITUDE ESTIMATION FOR NON-RESOLVED SPACE OBJECTS Richard Linares∗ , John L. Crassidis† , Moriba K. Jah‡ This paper discusses the development of a particle filter for attitude and angular rate estimation of a space object using light curve observations. The particle filter approach used is based on the generalized Rodrigues parameters (GRPs) local error representation. The global state used is the quaternion to avoid singularity in the attitude states. Uniform quaternions are generated to approximate a uniform distribution of rotation states. The approach is tested with simulation scenarios and evaluated based error performance and converge rate.
MOTIVATION In recent years space situational awareness, which is concerned with collecting and maintaining knowledge of all objects orbiting the Earth, has gained much attention. The U.S. Air Force collects the necessary data for space object catalog development and maintenance through a global network of radars and optical sensors. Due to the fact that a limited number of sensors are available to track a large number of space objects (SOs), the sparse data collected must be exploited to the fullest extent. Various sensors, such as radars, exist for SO state estimation, which typically includes position, velocity, and a non-conservative force parameter, B ∗ , analogous to a ballistic coefficient. Another piece of useful information is the estimation of the shape of an object, which requires knowledge of the attitude of the SO. Shape estimation is an important issue in the observation of SOs, because the shape influences the dynamics of the object and may enables unique space object identification, beyond just using the object’s translational states. There exists a number of methods for estimating the shape of an object. These methods vary in the sensor type used, technique used to resolve shape, and effective ranges for proper shape resolution. Radar-based methods have been extensively used for shape estimation, which include radar cross-sectioning approaches1 and range Doppler interferometry.2 These techniques were first developed in the field of planetary radar astronomy to estimate the shape of natural satellites,3 but were later applied to the imaging of artificial Earth orbiting satellites. These methods are limited to SOs that are larger than the radar’s wavelength. SOs can be imaged in low-Earth orbits that are much larger in dimension than the wavelength of the radar signal. To image SOs smaller and farther than these ranges requires very powerful radar devices, making these economically unattractive. ∗
Postdoctoral Research Associate, Space Science and Applications, ISR-1, Los Alamos National Laboratory, MS D466, Los Alamos, NM 87545. † CUBRC Professor in Space Situational Awareness, Department of Mechanical and Aerospace Engineering, University at Buffalo, The State University of New York, Buffalo, NY 14260. ‡ Senior Research Engineer, Air Force Research Laboratory. Associate Fellow AIAA.
1
Laser radar-based (LADAR) methods have also been used to estimate the shape of SOs. LADAR provides a three-dimensional scan of the object, which can resolve shape geometry at ranges of 1 km, returning a cloud of points of the measured relative position of an object. Reference 4 uses LADAR scans to perform a least squares fit of the LADAR returns to previously assembled point cloud models to estimate the shape of an SO. Reference 5 developes a filter approach to simultaneously estimate dynamic states, geometric shape, and mass model parameters of a satellite using multiple observations with LADAR sensors. In Ref. 5 a probabilistic map of the SO is constructed using a sensor uncertainty model and the dynamics experienced by the SO to estimate its shape. Using well modeled dynamical relationships of the SO provides enhancements to be implemented within a filter architecture in this shape estimation approach.5 Resolved images have been used to estimate the size and shape of satellites as well.6 These methods work either directly with the pixels of the images or are used to identify features of the SO. Features, such as corners, edges and markers, are located and tracked temporally to estimate higher level motion and the structure of the rigid body.7 The feature-based methods rely on continuously identifying and tracking higher level traits of the SO by using a Kalman filter to estimate feature location and motion parameters. Although these methods estimate the motion of features they do not by themselves provide a detailed estimate of the shape of the object and only give a sparse set of feature points of the object. Pixel-based methods rely on pixel-level information, and use the shading, texture and optical flow of the images to estimate the shape of an object at each time step using a monocular camera. Since these methods rely on pixel-level computations they typically involve very high-dimensional states and therefore are very computationally expensive. These methods are also very sensitive to pixel-level detail and are easily corrupted by unpredictable light intensities, reflective material and wrinkled surfaces. They require high resolution of the object to resolve meaningful shape estimates, and therefore are only effective for space-based sensors and or high resolution ground-based telescopes. Some powerful ground-based telescopes, such as the Air Force Maui Optical and Supercomputing site Advanced Electro-Optical System, can resolve SOs such as Hubble Space Telescope and the International Space Station to very high detail, but most objects are too small and or too distant (making them dim) to lend themselves to ground-based resolved imaging.8 For example operational SOs in geosynchronous orbits and “micro” and “nano” satellites are too small to be resolved using ground-based optical observations. Angular measurements of these smaller objects are still made to provide their coordinates as they traverse the sky. Although the amount of light collected from these objects is small, information can still be extracted from these data which can be used to resolve their shapes. Light curves (the SO temporal brightness) have also been used to estimate the shape for an object. Light curve approaches have been studied to estimate the shape and state of asteroids.9, 10 Reference 11 uses light curves and thermal emissions to recover the three-dimensional shape of an object assuming its orientation with respect to the observer is known. The benefits of using a light curvebased approach over the aforementioned others is that it is not limited to larger objects in lower orbits and it can be applied to small and dim objects in higher orbits, such as geosynchronous. Here light curve data is considered for shape estimation, which is useful because it provides a mechanism to estimate both position and attitude, as well as their respective rates.12, 13, 14, 15, 16, 17 There are several aspects of using light curve data (temporal photometry) that make it particularly advantageous for object detection, identification and tracking. Light curve data are the time-varying sensor wavelength-dependent apparent magnitude of energy (i.e. photons) scattered (reflected) off
2
of an object along the line-of-sight to an observer. Because the apparent magnitude of the SO is a function of its size, orientation, and surface material properties, one or more of these characteristics should be recoverable from the photometric data. This can aid in the detection and identification of an SO after a catalog of spacecraft data with material properties is developed, and may also prove to be powerful for never-seen-before objects. Previously, shape estimation has been investigated using a bank of UKFs in a Multiple Model Adaptive Estimation (MMAE) approach.16 The MMAE approach was able to determine the most probable model within a bank of possible models while estimating rotational and translation states with each UKF within the bank. Reference 16 limited the size of the covariance of the attitude states due to the nonlinearity of the measurements. The current work proposes a particle filter to over come this issue and account for the nonlinearity while approximating a uniform distribution over attitude states. Other studies have looked at adding additional states to the estimation process, including mass,14 general shape,17 and relative inertia15 parameters. With the addition of these additional parameters new nonlinearities are produced and therefore a method for accounting for nonlinear errors and non-Gaussian pdfs is required. This studies a particle filtering approaches applied to light curve processing. The approach used in this work in based on reference 18. Recovering of attitude and angular velocity states with sufficient accuracy is shown in this paper. The main benefit of this paper is the ability of approximating nonGaussian pdfs. The performance of this strategy is demonstrated via simulated scenarios. The organization of this paper is as followings, first the orientation dynamic and kinematic equations a briefly outlined and the faceted shape models used in the simulations are then discussed. Next, the light curve model used in this work is presented. Following this a general particle filter discussion is provide followed by GRP based attitude particle filter outline. Finally, simulation examples are shown along with conclusions. ORIENTATION DYNAMICS AND KINEMATICS In terms of the quaternion, the attitude matrix is given by A(q) = ΞT (q)Ψ(q)
(1)
where �
� q4 I3×3 + [̺×] Ξ(q) ≡ −̺T � � q I − [̺×] Ψ(q) ≡ 4 3×3 T −̺
(2a) (2b)
with
0 −a3 a2 [a×] ≡ a3 0 −a1 −a2 a1 0
(3)
for any general 3 × 1 vector a defined such that [a×]b = a × b. This representation is constrained since the quaternion is of unit length and therefore qT q = 1. The kinematics dynamics are given
3
by a first-order differential equation:
B ω˙ B/I
1 q˙ = Ξ(q)ω � h2 i � −1 B B = JSO − ωB/I × JSO ωB/I
(4a) (4b)
The state vector using for this work is given by
h T x = qB I
T
B ωB/I
iT
(5)
where the shape of the SO and the surface reflection parameters are assumed known. LIGHT CURVE MODEL For this work it is assumed that an optical site records the magnitude of the brightness of the space object (SO) and these measurements are used to estimate the orientation of the SO. The brightness of an object in space can be modeled using a Phong light diffusion model.19 This model is based on the bidirectional reflectance distribution function (BRDF) which models light distribution scattered from the surface due to the incident light. The BRDF at any point on the surface is a function of two directions, the direction from which the light source originates, and the direction from which the scattered light leaves the observed surface. The model in Ref. [19] decomposes the BRDF into a specular component and a diffuse component. The two terms sum to give the total BRDF ρtotal (i) = ρspec (i) + ρdiff (i)
(6)
The diffuse component of Eq. (6), ρdiff (i) represents light that is scattered equally in all directions (Lambertian). The specular component of Eq. (6), ρspec (i) represents light that is concentrated about some direction (mirror-like). Reference [19] develops a model for continuous arbitrary surfaces but simplifies for flat surfaces which is employed in this work. Therefore, the total observed brightness of an object becomes the sum of the contribution from each facet. Under the flat facet assumption the specular term of the BRDF becomes19 ρspec (i) =
p
�n (uI ·uI (i))2 +nv (1−(uIh ·uIv (i))2 ) uIn (i) · uIh u h u (nu + 1) (nv + 1) Freflect (i) 8π uIn (i) · uIsun + uIn (i) · uIobs − (uIn (i) · uIsun )(uIn (i) · uIobs ) (7a)
where the Fresnel reflectance is given by Freflect (i) = Rspec (i) + 1 − Rspec (i)
�
�5 1 − uIsun · uIh (i)
(8)
The parameters nu and nv of the Phong model dictate the direction (locally horizontal or vertical) distribution of the specular terms. The diffuse term of the BRDF for a single facet is " � � � �5 # " � �5 # uIn (i) · uIobs 28Rdiff (i) uIn (i) · uIsun ρdiff (i) = (1 − Rspec (i)) 1 − 1 − 1− 1− 23π 2 2 (9)
4
The apparent magnitude of a SO is the result of sunlight reflecting off of its surfaces along the lineof-sight to an observer. First, the fraction of visible sunlight that strikes an object (and not absorbed) is computed by � Fsun (i) = Csun,vis ρtotal (i) uIn (i) · uIsun (10)
where Csun,vis = 455 W/m2 is the power per square meter impinging on a given object due to visible light striking the surface. If either the angle between the surface normal and the observer’s direction or the angle between the surface normal and Sun direction is greater than π/2, then there is no light reflected toward the observer. If this is the case, then the fraction of visible light is set to Fsun (i) = 0. Next, the fraction of sunlight that strikes an object that is reflected must be computed: � Fsun (i)A(i) uIn (i) · uIobs Fobs = (11) kdI k2 The reflected light of each facet is now used to compute the total photon flux, which is measured by an observer: # "N X Fobs (i) + vCDD (12) F˜ = i=1
where vCDD is the measurement noise associated with flux measured by a CCD sensor. PARTICLE FILTER
Particle filtering approaches are based on Monte Carlo methods, where a probability distribution is represented by set of randomly selected particles. Using the fact that the system in question can be solved for an individual set of initial conditions, the solution for a distribution of initial conditions are approximated by the solutions of a set of particles representing the initial distribution. Given N (i) independent and identically distributed random samples PN x drawn(i)from p(x), i = 1, . . . , N the distribution can be approximated by p(x) ≈ (1/N ) i=1 δ(x − x ) and an arbitrary integral (or expectation) with respect to p(x) can be approximated by Z
N 1 X f (x)p(x)dx ≈ f (x(i) ) N
(13)
i=1
Perfect Monte Carlo sampling assumes the samples are drawn directly from the distribution p(x) and that there are enough particles to represent the mass of the distribution. It can be shown that as Na → ∞, the approximation given by Eq. (13) approaches the true density.20 In the case of the Particle filter each particle is assigned a weight, w(i) ∝ p(x(i) ), whichP represents the probability (i) = 1. A particle of that particle occurring. Then the weights are normalizes such that N i w filter involves four steps, namely, prediction, update (correction), resampling and regularization (roughening), all of these steps constitute a filter cycle. Predictor The sets of particles and their associated weights representing the pdf at tk and tk+1 are denoted (i) (i) (i) (i) by {xk , wk } and {xk+1 , wk+1 }, respectively, where i = 1, . . . , N . The particles at time tk are propagated through the following equation with their weights unchanged: x˙ (i) = f (x(i) , w i )
5
(14)
(i)
(i)
Then the particle at time tk+1 , {xk+1 , wk+1 }, represents the forecast pdf, where N samples w (i) (i)
of the process noise are drawn according to p(w), denoted by wk ∼ p(wk ), i = 1, . . . , N , is the normalized weight of the particle. The process noise w and the measurement noise v are assumed to be zero-mean white noise sequences. Although no Gaussian assumptions are needed, the distributions of the mutually independent xo , w, and v, denoted by p(xo ), p(w) and p(v), respectively, are assumed to be known and Gaussian for this work. Then, the posterior density at k can be approximated as i X p(x(t)) ≈ wi δ(x(t) − xi (t)) (15) i=1
where δ(·) represents the direc delta function, which returns one for an argument of zero and zero otherwise. Equation (15) represents a discrete weighted approximation to the true posterior.
Corrector When measurements are made available, the pdf is updated by updating the weights of each particle using the likelihood of the measurement given each particle. At the update step the weight (i) (i) (i) associated with each particle is updated based on the likelihood function wk+1 = wk p(˜ yk |xk ): (i)
where wk+1 denotes the unnormalized weights. If additive noise is considered the likelihood func(i)
tion has a simple form: p(˜ yk+1 |x(i) ) = p(˜ yk − h(xk )). Then weight update for each particle is based on the likelihood function and given by (i)
(i)
(i)
wk = wk−1 p(˜ yk |xk−1 ) (i)
wk = (i)
(i) wk PN (i) i=1 wk
(16a) (16b)
where the likelihood function p(˜ yk |xk ) depends on the noise process of the observation directly. Resampling and Regularization The variance associated with the weights in sequential importance sampling can only increase over time and eventually all but one particle will have negligible weight.20 To overcome this degeneracy problem resampling is used to discard obsolete particles with small weights and multiply particles with large weights.21 The resampling procedure starts by drawing samples N times from (i) (i) (i) {xk+1 , wk+1 } to obtain N equally weighted particles, {xk+1 , 1/N }. Since resampling duplicates the particles with large weights, generating many identical particles may greatly decrease the number of distinct particles, resampling is usually followed by a regularization step. The regularization step adds small noise to the resampled particles to increase particle diversity.21 A small independent jitter drawn from a Gaussian distribution is added to the identical particles to increase diversity. ATTITUDE PARTICLE FILTER The attitude state errors are represented as error GRPs resulting in a minimum parameter representation for the attitude state error.18 To within first order, the state error covariance of the attitude is invariant whether the errors are parameterized using quaternions or GRPs.22 Therefore the attitude state error-covariance can be directly decomposed into error GRP particles for use in the PF.
6
The particles corresponding to the error GRPs are first converted into error quaternions so that the quaternion particles can be computed. The error quaternion, denoted by δq− k (i), associated with th 23 the i error GRP particle is computed by � � δp − −1 a + δq δ̺− (i) = f (i) χk (i) (17a) 4 k q k 2 2 −a||χδp f 2 + (1 − a2 )||χδp k (i)|| + f k (i)|| − δq4k (i) = (17b) 2 f 2 + ||χδp k (i)|| � − � δ̺k (i) (i) = (17c) δq− k δq4−k (i) where a is a parameter from 0 to 1 and f is a scale factor, which is often set to f = 2(a + 1) so that the attitude error covariance is that of the small roll, pitch and yaw angle errors. Here it is noted that the subscript I and superscript B in qB I and its estimates are omitted in this and the following th sections for clarity. The i quaternion particle is given by a rotation of δq− k (i) about the a priori estimate: − ˆ− ˆ− q (18) k (i) = δqk (i) ⊗ q k (0) where � � q′ ⊗ q ≡ Ψ(q′ ) q′ q
(19)
� − �−1 ˆ− ˆ k+1 (0) δˆ q− k+1 (i) = q k+1 (i) ⊗ q
(20)
After propagation, the particles for the error GRP states are computed with the propagated attitude ˆ− particles. The estimated mean quaternion, q k+1 (0), is stored, and error quaternions corresponding to each propagated quaternion particles are computed as:
where the notation for the conjugate quaternion is defined as: � � −̺ −1 q ≡ q4
(21)
Using the result of Eq. (20), the error GRP sigma points are computed as δp− k+1 (i) = f
δ̺ˆ− k+1 (i) a + δqˆ4−k+1 (i)
(22)
The particle filter approach used in this work is based on the generalized Rodrigues parameters local error representation. The global state used is the quaternion to avoid singularity in the attitude states. Uniform quaternions are generated to approximate a uniform distribution of rotation states. SIMULATION RESULTS Using light curves for satellite orientation and surface parameter estimation have many inherent challenges. This section studies this problem by considering two examples; the first example is a simplified state model to highlight some of these challenges and the second example is a full 3 degree of freedom rotation model. The simple model uses a two-dimensional state with one orientation angle and one angular rate. This simplified model is used to show the challenges that object symmetry poses to light curve process. Using this simplified model a Particle Filter (PF)
7
z
B3
B2 y
B1
uIsun x
θ
uIobs
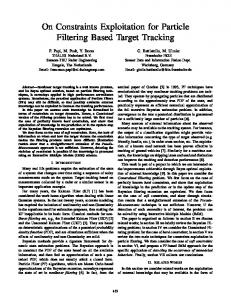
Figure 1. Test Case Definition
technique is used to study the light curve processing problem. The benefit of studying this simplified system is that one can remove the nonlinearities from the dynamic equations and therefore isolating the nonlinearity and ambiguity in the measurement equations, i.e. the light curve model. The second example considers a full orientation state model thats estimates the 3 degree of freedom orientation state of the Space Object using a PF with the local GRP representation discussed earlier. Example 1: Test Case Definition To study the light curve process problem in detail a simplified model is considered. The model consists of triangular prisms, square prisms and regular hexagonal prisms. All shape models considered in this section are orientated such that the B3 direction is aligned with inertial z axis. The shape model are allowed to rotate about their B3 body axis. The parameters included in the state vector are the θ and ω, the between the B1 and x and the angular velocity respectively. Figure 1 shown the geometry of the simple test case. The Sun vector uIsun and observer direction vector uIobs are defined to lie in the x − y plane. The dynamic model for this simple test case is given by θ˙ = ω
(23a)
ω˙ = 0
(23b)
Then the system and measurement equations can be written in the following form: x˙ = Ax
(24a)
y = h (x, p) + v
(24b)
where A=
�
0 1 0 0
�
(25)
and h (x, p) is the nonlinear light curve measurement function and p is a vector of the light curve model parameter, such as shape and surface parameters. Figures 2 and 3 show the simulation results for the PF applied to example 1. Figure 2 show a histogram of the particles evolving over time. From this figure we can see the solution is bimodal
8
and consist of two distinct peaks. This is due to the fact the shape has symmetries and these two peak represent likely orientation based on the data. Figure 3 shows these two peaks at different times. Form this figure it can be seen one of the peaks reduces in size as more measurements are processed. The new observations reduce the likelihood that this second orientation is correct. This shows the benefit of the PF the non-Gaussian and bimodal distributions that can arise for the light curve processing problem.
(a) Attitude (Deg)
(b) Attitude (Deg) Centered
Figure 2. Histogram of Attitude Particles
Example 2: Light Curve Based Attitude Estimation This section discusses a simulation example of the use of the PF approach for space object characterization. In this section the light curve models discussed earlier are used to simulate an object in a near Geosynchronous Orbit (GEO) orbit. The model used is a rectangular prism and the same initial attitude and positions states or used for this case as was used earlier. The orbit is assumed know and only the attitude and angular velocity is estimated. The simulation conditions are given by • Geographic position of the ground site is 0◦ North, 172◦ West with 0 km altitude • The orbital elements are given by a = 25864.16932 km, e = 0.743, i = 30.0083 deg, ω = Ω = 0.0 deg and M0 = 91.065 deg • The initial time of the simulation is May 8, 2007 at 5:27.55 UTC √ √ T • Initial quaternion: qB I = [1/ 2 0 0 1/ 2] • A constant rotation rate, defined as the body rate with respect to the inertial frame (represented B in body coordinates) is used given by ωB/I = [0 0.00262 0]T rad/s For this simulation scenarios, measurements of apparent magnitude are produced using zero-mean white-noise error processes with a standard deviation of 0.05 for magnitude. The initial errors for the states are 50 deg for all three attitudes, 1, 000 deg/hr for the rotational rate. The time interval between the measurements is set to 1 seconds and data are simulated for 1 hour. The simulation results for the PF approach applied to light curve measurement processing is shown in Figure 5. This figure include both the attitude and angular velocity estimation error for
9
1400
1600
1200
1400 1200 1000
Counts
Counts
1000
800
600
400
800 600 400
200
200
0 −1
−0.5
0
0.5
1
0 −1
1.5
Attitude (Degs)
−0.5
(a) Attitude (Deg)
0
0.5
1
Attitude (Degs)
1.5
(b) Attitude (Deg)
4500 4000 3500
Counts
3000 2500 2000 1500 1000 500 0 −0.2
0
0.2
0.4
0.6
0.8
Attitude (Degs)
1
1.2
(c) Velocity Error (Deg/Hr)
Figure 3. Histogram of Attitude Particles at t = 2s t = 1 min t = 4 min
the scenario used. From Figures 5(a) and 5(c) we can see that the PF approach preforms well in estimating both the angular velocity and attitude states. Further investigation is required both from the example shown in this section, but it can be concluded that the PF Filtering approach is well suited for nonlinear problems and therefore for space object characterization. CONCLUSION In this paper, a PF estimation scheme using light curve measurements was presented and used to estimate attitude and angular velocity of a space object (SO) with an assumed shape. Two simulation cases were considered, the first case was a simplified state model to highlight the challenges an object with symmetry poses to light curve process. The second case was used a full orientation state model to estimation the 3 degree of freedom orientation state of the Space Object. The light curve model used was based on the Ashikhmin-Shirley BRDF and showed good performance for simulated and real data examples. Simulation results indicated that the performance PF for the light curve processing problem is promising. REFERENCES [1] Sato, T., Wakayama, T., Tanaka, T., Ikeda, K.-i., and Kimura, I., “Shape of Space Debris as Estimated from Radar Cross Section Variations,” Journal of Spacecraft and Rockets, Vol. 31, No. 4, July-Aug. 1994, pp. 665–670.
10
ω1 (deg/hr)
0 −10
0
0.2
0.4
0.6
0.8
1
ω2 (deg/hr)
10 0 −10
0
0.2
0.4
0.6
0.8
1
10
ω3 (deg/hr)
Roll (Deg) Pitch (Deg) Yaw (Deg)
10
0 −10
0
0.2
0.4
0.6
0.8
1
Time (Hr)
50 0 −50
0
0.2
0.4
0.6
0.8
1
0
0.2
0.4
0.6
0.8
1
0
0.2
0.4
0.6
0.8
1
50 0 −50 50 0 −50
Time (Hr)
(a) Attitude Error
(b) Angular Velocity Error
Figure 4. Light Curve PF Full State Example
[2] Walker, J. L., “Range-Doppler Imaging of Rotating Objects,” IEEE Transactions on Aerospace and Electronics Systems, Vol. AES-16, No. 4, Jan. 1980, pp. 23–52. [3] Hagfors, T., “Mapping Planetary Surfaces by Radar,” Proceedings of the IEEE, Vol. 61, No. 9, Jan. 1973, pp. 1219–1225. [4] DiMatteo, J., Florakis, D., Weichbrod, A., and Milam, M., “Proximity Operations Testing with a Rotating and Translating Resident Space Object,” AIAA Guidance, Navigation and Control Conference, Chicago, IL, Aug. 2009, AIAA-2009-6293. [5] Lichter, M. D. and Dubowsky, S., “State, Shape, and Parameter Estimation of Space Objects from Range Images,” Proceedings of the 2004 IEEE International Conference on Robotics & Automation, New Orleans, LA, April 2004, pp. 2974–2979. [6] Young, G.-S. J. and Chellappa, R., “3-D Motion Estimation using a Sequence of Noisy Stereo Images: Models, Estimation, and Uniqueness Results,” IEEE Transactions on Pattern Analysis and Machine Intelligance, Vol. 12, No. 8, Aug. 1990, pp. 735–759. [7] Broida, T. J. and Chellappa, R., “Estimating the Kinematics and Structure of a Rigid Object from a Sequence of Monocular Images,” IEEE Transactions on Pattern Analysis and Machine Intelligence, Vol. 13, No. 6, June 1991, pp. 497–513. [8] Hall, D. T., Africano, J. L., Lambert, J. V., and Kervin, P. W., “Time-Resolved I-Band Photometry of Calibration Spheres and NaK Droplets,” Journal of Spacecraft and Rockets, Vol. 44, No. 4, July 2007, pp. 910–919. [9] Kaasalainen, M. and Torppa, J., “Optimization Methods for Asteriod Lightcurve Inversion I: Shape Determination,” Icarus, Vol. 153, No. 4, Jan. 2001, pp. 24–36. [10] Kaasalainen, M. and Torppa, J., “Optimization Methods for Asteriod Lightcurve Inversion II: The Complete Inverse Problem,” Icarus, Vol. 153, No. 4, Jan. 2001, pp. 37–51. [11] Calef, B., Africano, J., Birge, B., Hall, D., and Kervin, P., “Photometric Signature Inversion,” Proceedings of the International Society for Optical Engineering, Vol. 6307, San Diego, CA, Aug. 2006, Paper 11. [12] Jah, M. and Madler, R., “Satellite Characterization: Angles and Light Curve Data Fusion for Spacecraft State and Parameter Estimation,” Proceedings of the Advanced Maui Optical and Space Surveillance Technologies Conference, Vol. 49, Wailea, Maui, HI, Sept. 2007, Paper E49. [13] Linares, R., Jah, M. K., and Crassidis, J. L., “SPACE OBJECT AREA-TO-MASS RATIO ESTIMATION USING MULTIPLE MODEL APPROACHES,” Advances in the Astronautical Sciences, Vol. 144, 2012, pp. 55–72. [14] Linares, R., J. M. K. L. F. A. C. J. L. and Kelecy, T., “Astrometric and Photometric Data Fusion For Inactive Space Object Feature Estimation,” Proceedings of the International Astronautical Federation 2011, Cape Town, South Africa, 2011. [15] Linares, R., L. F. A. J. M. K. and Crassidis, J. L., “Space Object Mass-Specific Inertia Matrix Estimation from Photometric Data,” AAS Guidance and Control Conference, Breckenridge, Colorado, 2012.
11
15
50
14.5
40 30
14
20
θ (deg)
Magnitude
13.5 13 12.5 12
0 −10 −20
11.5
−30
11 10.5
10
−40 0
10
20
30
40
50
−50
60
0
10
20
Time (min)
30
40
50
60
Time (min)
(a) Magnitude
(b) Attitude Error Angular Rate Errors (deg/hr)
50 40 30
θ˙ (deg/hr)
20 10 0
−10 −20 −30 −40 −50
0
10
20
30
40
50
60
Time (min)
(c) Angular Velocity Error
Figure 5. Light Curve PF Simple State Example
[16] Linares, R., J. M. K. and Crassidis, J. L., “Astrometric and Photometric Data Fusion for Resident Space Object Orbit, Attitude, and Shape Determination Via Multiple-Model Adaptive Estimation,” Proceedings of the AIAA Guidance Navigation and Controls Conference, Toronto, CA, 2010. [17] Linares, R., J. M. K. and Crassidis, J. L., “Inactive Space Object Shape Estimation Via Astrometric And Photometric Data Fusion,” Proceedings of the 22nd AAS/AIAA Space Flight Mechanics Meeting, Charleston, South Carolina, 2012. [18] Cheng, Y., “Particle Filtering for Attitude Estimation Using a Minimal Local-Error Representation Mississippi State University , Mississippi State , MS 39762-5501,” Aerospace. [19] Ashikmin, M. and Shirley, P., “An Anisotropic Phong Light Reflection Model,” Tech. Rep. UUCS-00014, University of Utah, Salt Lake City, UT, 2000. [20] Sloan, I. H. and Woniakowski, H., “When Are Quasi-Monte Carlo Algorithms Efficient for High Dimensional Integrals?” Journal of Complexity, 1998, pp. 1–33. [21] Djuric, P. and Goodsill, S., “Special Issue on Monte Carlo Methods for Statstical Signal Processing,” IEEE Trasactions on Signal Processing, Vol. 50, No. 2, 2002. [22] Markley, F. L., “Attitude Error Representations for Kalman Filtering,” AIAA Journal of Guidance, Control, and Dynamics, Vol. 26, No. 2, March-April 2003, pp. 311–317. [23] Crassidis, J. L. and Markley, F. L., “Unscented Filtering for Spacecraft Attitude Estimation,” Journal of Guidance, Control and Dynamics, Vol. 26, No. 4, July-Aug. 2003, pp. 536–542.
12