P. Umapathi Reddy et al. / International Journal of Engineering Science and Technology (IJEST)
PARTICLE SWARM OPTIMIZATION BASED APPROACH FOR LOSS REDUCTION IN UNBALANCED RADIAL DISTRIBUTION SYSTEM P. UMAPATHI REDDY Department of Electrical and Electronics Engineering, Sree Vidyanikethan Engineering College, A.Rangampet, Tirupati, Andrapradesh, India-517102.
[email protected], Tel: +91 9440540663.
S. SIVANAGARAJU Department of Electrical and Electronics Engineering, Jawaharlal Nehru Technological University College of Engineering Kakinada, Kakinada, Andrapradesh, India.
[email protected]
P. SANGAMESWARA RAJU Department of Electrical and Electronics Engineering, Sri Venkateswara University College of Engineering , Tirupati, Andrapradesh, India-517502.
[email protected] Abstract: The losses at distribution level contribute a major portion of power system losses. Proper sizes of shunt capacitors in unbalanced radial distribution systems (URDS) can reduce some portion of this loss and can improve the voltage profile of the feeder section. Most conventional optimization techniques are in capable to solve this hard combinatorial problem with set of operating conditions where as particle swarm optimization (PSO) algorithm is very suitable. This paper presents an efficient algorithm for determining the location, type and size of capacitor bank to be installed in unbalanced radial distribution system. The main objective function formulated consists of two terms: Cost of energy loss and cost related to capacitor purchase and capacitor installation, so that the fitness function is to be maximizing for the net saving. Keywords: Power Loss Indices, Capacitor banks, Loss Minimization, Unbalanced Radial Distribution Systems, Particle Swarm Optimization. 1.0
Introduction
There are several methods have been proposed [Abdul-Salam, et.al,(1994), Baran, M.E ;et al,( 1989)] to analyze this Capacitor placement problem in the past in the area of reactive power compensation for radial distribution networks. [Bridenbaugh, C. J; Di Mascio,et al,(1992)] Voltage improvement through capacitor and Capacitor optimization is analyzed.[ Sundhararajan and Pahwa et al,(1994) ] used genetic algorithm for obtaining the optimum values of shunt capacitors. They have treated the capacitors as constant reactive power load. [T.S.Abdul salma et al,(1994)] proposed a heuristic technique, which brings about the identification of the sensitive buses that have a very large impact on reducing the losses in the distribution systems. [C.S.Chen et al,(1995)] developed a systematic method of optimally locating and sizing of the shunt capacitors compensation on distribution feeders by taking into account the mutual coupling effect among phase conductors. The capacitor placement and sizing problem is a nonlinear integer optimization problem, with locations and ratings of shunt capacitors being discrete values. Series capacitors and shunt capacitors [Carlise, J.C.; El-Keib et al,(2000):] are widely used in distribution systems due to various limitations in the usage. Mainly capacitors are used to develop reactive power near the point of consumption. Shunt capacitors are commonly used in distribution systems for reactive power compensation for several reasons, in particular in order to reduce power losses, to improve the voltage profile [Das, D; Kothari et al,(1995)] along the feeders and to increase the maximum power flow through cables and transformers. The proposed method was demonstrated both the balanced and unbalanced systems. [S.K. Goswami et al,(1999)] developed heuristic rules for the determination of the most sensitive capacitor placement problem. Using these rules, a technique was developed to identify a number of probable capacitor locations in a distribution network [H. Kim and S.K You et al,[1999] used genetic algorithm for obtaining the optimum values of shunt capacitor bank. They have treated the
ISSN : 0975-5462
Vol. 3 No.11 November 2011
8030
P. Umapathi Reddy et al. / International Journal of Engineering Science and Technology (IJEST)
capacitors as constant reactive power loads. [Mady, IB et.al,(2009)] proposed optimal sizing of capacitor banks and distributed generation in distorted distribution networks by genetic algorithms. [Eajal,A. et.al,[2010] a technique was developed for optimal capacitor placement and sizing in unbalanced distribution systems with harmonics consideration using particle swarm optimization. In this Paper, power loss indices (PLI) analysis used for capacitor placement problem and also presents a candidate bus identification method to determine the best locations for Optimal capacitor placement. The PSO based approach is used to find the optimal sizing of the capacitor bank in unbalanced radial distribution systems. 2.0 Mathematical Formulation The objective function formulated includes the energy cost, capacitor installation cost and purchase cost, so that the fitness function is to be maximized for the net savings function (f) by placing the optimal size of the capacitor. The objective function can be expressed as: nb nc nb abc abc Maximize f EC Ploss j Ploss j T a IC nc CC CB j 1 j 1 j 1
(1)
Where, EC is energy Cost in Rs/kWh T is time Period in hours
abc is the total active power loss before capacitor placement P loss j abc is the total active power loss after capacitor placement P loss j α is the depreciation factor
IC is the installation cost nc is the number of capacitor buses CC is the cost of the three phase capacitor
CB abc is the capacitor bank rating in kVAr i 3.0 Candidate Buses for the placement of Capacitors The proposed candidate bus identification method for capacitor placement is explained with 25 bus URDS whose single line diagram is shown in Fig 2. The line and the load data of this system are given in [20]. After performing the base case load flows, total active power loss of system is 150.1225 kW. After compensating the reactive power injection at each bus in all the phases equal to local reactive load of the system at that particular bus, perform the load flows as explained in [5] and record the total active power loss and loss reduction of the system. This procedure is repeated for all remaining buses except source bus. The power loss indices (PLI) are calculated as
PLI[i]
Loss.reduction[i] Min.reduction Max.reduction Min.reduction
(2)
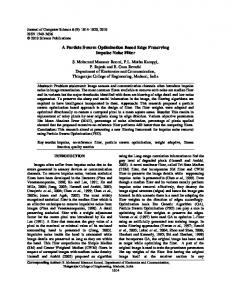
1 0.9
Power LossIndex
0.8 0.7 0.6 0.5 0.4 0.3 0.2 0.1 0 0
5
10 15 Bus Number
20
25
Fig.1 Plot between bus number and Power Loss Index
The most suitable buses for the capacitor placement are chosen based on the condition that PLI must be greater than PLI tolerance value should be lies in between ‘0’ and ‘1’. The tolerance value for a chosen system is selected by experimenting with different values in descending order of the PLI limits. The best value of the tolerance value gives the highest profit and satisfies the system constraints. Fig.1 shows power loss index Vs bus number for 25 bus URDS. From experimentation the best value of PLI tolerance is set as 0.4. It is concluded
ISSN : 0975-5462
Vol. 3 No.11 November 2011
8031
P. Umapathi Reddy et al. / International Journal of Engineering Science and Technology (IJEST)
that buses 9,12,14,15 are the best candidate uses for the capacitor placement. Assume capacitor at candidate uses with size varying the integer steps of the standard size capacitors (50 kVAr per phase). 3.1 Candidate bus identification algorithm The algorithm of identifying the candidate buses for best suitable for capacitor placement is explained in given below: Step 1: Read the data for a given unbalanced radial distribution system (URDS). Step 2: Perform the load flows and calculate the base case total active power loss. abc
Step 3: Compensating the reactive power injections ( Qc
) at each bus (except source bus) in all the phases,
run the load flow and calculate the active power loss in each case. Step 4: Calculate the real power loss reduction and power loss indices using the following equation
PLI (i )
X (i) Y , Z Y
i 2,3,.....n.
(3)
Where X(i) = Loss reduction in ith bus; Y = Minimum reduction; Z = Maximum reduction; Step 5: Select the candidate bus whose PLI >PLI tolerance. Step 6: Stop. 4.0 Implementation of PSO (i). Initialization of PSO Parameters Particle swam optimization is a population basic stochastic optimization technique developed by Dr.Eberhart and D.V Kennady in spite by social behavior of bird flocking or fish schooling in 1995. Initialize the PSO parameters like Swarm size(P), number of generations(NG), Initial weight of the weighting function (Wmax), Final weight of the weighting function (Wmin), weighting factors(C1,C2), input system data, control parameters such as lower and upper bounds of bus voltage and maximum number of capacitor banks to be installed at a compensation node. Randomly generate an initial swarm (array) of particles with random positions and velocities. (ii). Evaluation of Fitness Function The fitness function should be capable of reflecting the objective and directing the search towards optimal solution. The system is initialize with a population of random solutions and search for optima by updating generations. Since the PSO proceeds in the direction of evolving best-fit particles and the fitness value is the only information available to the PSO, the performance of the algorithm is highly sensitive to the fitness values. For each particle or swarm, the calculated capacitors are placed at the sensitive nodes and the load flow method is run and the losses, net savings are calculated using Eqn.(1) and these net savings becomes the fitness function of the PSO (as savings are maximized). (iii). Optimal Solution Particle position is updated by adding velocity to its iterative process continued till hundred iterations. So n=100. The advantage of PSO is easy to implement and there are few parameters to adjust optimal solution gives the best position and the corresponding fitness value to the target problem. Information of the best position includes the optimal locations and numbers of capacitor banks at each load level, and the corresponding fitness value represents the maximizing the total savings of the system. This modification can be represented by the concept of velocity (modified value for the current positions). Velocity of each particle can be modified by the following equation
Vi k 1 WVi k C1 rand1 [ Pbest i X ik ] C 2 rand 2 [Gbest X ik ] where,
Vik Vik+1
: Velocity of particle i at iteration k,
W C1,C2 rand1,rand2
: Modified velocity of particle i at iteration k+1, : Inertia weight, : Acceleration Constants, : Two random numbers
X ki
: Current position of particle i at iteration k,
ISSN : 0975-5462
(4)
Vol. 3 No.11 November 2011
8032
P. Umapathi Reddy et al. / International Journal of Engineering Science and Technology (IJEST)
Pbesti : Pbest of particle i, Gbest : Gbest of the group. In the equation (4), k The term rand1 × (Pbest i - X i ) is called particle memory influence
k
The term rand2 × (Gbest - Xi ) is called swarm influence. The rand1, rand2 are the two random numbers with uniform distribution with range of { 0.0 to 1.0 }W is the inertia weight which shows the effect of previous velocity vector on the new vector. A larger inertia weight ‘W’ facilitates global exploration, while smaller inertia weight ‘W’ tends to facilitates local exploration to fine tune.The following inertia weight is usually utilized in equation (4):
W=Wmax -
Wmax -Wmin ×iter itermax
(5)
where,
Wmax : initial value of the Inertia weight, Wmin : final value of the Inertia weight, itermax : maximum iteration number, iter : current iteration number. Accordingly, the optimal types and sizes of capacitors to be placed at each compensation node can be determined: if capacitor bank number during all load levels are identical, then the capacitor at this node can be regarded as the fixed type; if bank numbers at different load levels are not all the same, then the capacitor at this node is of switched type. The size of capacitor banks placed at each compensation node is the product of the maximum bank number and the standard size per bank. (iv) Algorithm for Optimal Location and Size of the Capacitor The detailed algorithm to determine optimal location and size of the capacitor is given below. Read system data such as Line data and Load data of the Distribution system. Initialize the PSO parameters such as Swarm size(P), initial weight & final weight of the weighting function (Wmax & Wmin), weighting factor(Cj), number of generations (NG). Step 3: Obtain the optimal location of capacitor by using PLI(Power Loss Indices) as input. Step 4: Randomly create initial particles where each particle is a solution to the optimal location and size of the capacitor problem. Step 5: Initialize the velocities for the particles. Step 6: Run the load flow for each particle and Compute the value of voltages, total active and reactive power losses at all the nodes. Step 7: Set the local best values for each particle and global best value for the current iteration. Step 8: Update the particle positions & velocity using eqns (4) & (5). Step 9: If the particle position is out of boundary then it is brought back to its nearest boundary value using eqns (5). Step 10: Execute steps 6-9 in a loop for maximum number of generations (NG). Step 11: Stop the execution and display the global best values as the final result of optimal size of the capacitor. Step 1: Step 2:
5.0 Results and Discussion The proposed algorithm is also tested on IEEE 37 bus URDS as shown in Fig.2 whereas voltage regulator has been removed from the original network. Three wire delta operating at a nominal voltage level of the test network is 4.8 kV. All line segments are undergrounded. All loads are spot loads and consist of constant power, constant current and constant impedance.The line and the load data are taken from unbalanced radial distribution test feeder [Subramnyam, J.B.V et al (2009)]. The existing load at each bus is overloaded by 25% in each phase to observe the effectiveness of the proposed method. The capacitor bank considered here is delta connected. After compensating the reactive power injection at each bus in all the phases performs the load flows and records the total active power loss, loss reduction and power loss indices in each case are given in table 3. Fig.3 shows power loss indices for 37 bus URDS. From experimentation shows that the best value of PLI tolerance is set as 0.6. It is concluded that buses 701, 737, 738, 722, 712 are the best candidate buses for the capacitor placement. Voltage values and summary of test results of 37 bus URDS before and after capacitor placement are given in tables 2 and 3. From the results of PSO the size of the capacitor banks obtained at buses 701, 737, 738, 722 and
ISSN : 0975-5462
Vol. 3 No.11 November 2011
8033
P. Umapathi Reddy et al. / International Journal of Engineering Science and Technology (IJEST)
712 are 300, 300, 450, 600 and 150 kVAr respectively. From table 3, it has been observed that the minimum voltages in phases A, B and C are improved from 0.9497, 0.9578 and 0.9445 p.u. to 0.9622, 0.9712 and 0.9598 p.u respectively and total active power loss in each phase of A, B and C is reduced from 31.56, 23.67 and 30.44 to 25.47, 20.41 and 24.99 kW respectively after installing the capacitor banks. Hence, there is an improvement in the minimum voltage and reduction in power loss after installing the capacitor bank. The net saving Vs generation number of 37 bus URDS after capacitor placement is shown in Fig.4. Single line diagram of 37 bus URDS after capacitor placement at their candidate buses are shown in Fig.5.
1 0.9
Power Loss Index
0.8 0.7 0.6 0.5 0.4 0.3 0.2 0.1 0 701
711
721
731 741 751 Bus Number
761
771
Fig.3 Plot between bus number and PLI
781
Fig.4 Net saving Vs Generation Number of 37 bus URDS
Table 1 : Power loss reductions and power loss indices for 37 bus URDS Total active power loss of the system after compensating Qc at each bus Bus no. (in all the phases) (kW)
Loss reduction (kW)
Power Loss Indices(PLI)
701
139.1192
10.0128
1.0000
702
149.1319
0
0
703
149.1319
0
0
730
145.4629
3.6691
0.3664
709
149.1319
0
0
708
149.1319
0
0
733
143.8993
5.2327
0.5226
734
147.0653
2.0666
0.2064
737
139.5848
9.5471
0.9535
738
140.1399
8.9921
0.8981
711
149.1319
0
0
741
147.1058
2.0261
0.2024
713
145.7922
3.3398
0.3336
704
144.5636
4.5683
0.4563
720
144.5793
4.5526
0.4547
706
149.1319
0
0
725
147.7126
1.4194
0.1418
705
149.1319
0
0
742
147.2700
1.8619
0.1860
727
147.4091
1.7228
0.1721
744
147.1512
1.9807
0.1978
729
147.1514
1.9806
0.1978
775
149.1319
0
0
731
147.3530
1.7789
0.1777
732
149.1319
0
0
ISSN : 0975-5462
Vol. 3 No.11 November 2011
8034
P. Umapathi Reddy et al. / International Journal of Engineering Science and Technology (IJEST)
710
149.1319
0
0
735
145.2422
3.8897
0.3885
740
145.5763
3.5556
0.3551
714
147.8824
1.2495
0.1248
718
146.1851
2.9468
0.2943
707
149.1319
0
0
722
140.1873
8.9446
0.8933
724
146.0963
3.0356
0.3032
728
144.7215
4.4105
0.4405
736
148.0144
1.1176
0.1116
712
142.0570
7.0749
0.7066
799 724 722 707
712 701 742
713
704 720
705
702 714 706
729
744
727
703
718 725
728 730
732
708
709
731
736 733 710
775
734 740 735 737
738
711
741
Fig.2 Single line diagram of IEEE 37 node URDS Table 2: Voltage values of 37 bus URDS for capacitor placement Without compensation Bus No. 799 701 702 703 730 709 708 733 734 737 738 711 741 713 704 720 706 725 705 742 727
ISSN : 0975-5462
With compensation PSO
|Va|(p.u)
|Vb|(p.u)
|Vc|(p.u)
|Va|(p.u)
|Vb|(p.u)
|Vc|(p.u)
1.0000 0.9863 0.9781 0.9709 0.9652 0.9634 0.9607 0.9582 0.9547 0.9512 0.9501 0.9498 0.9497 0.9763 0.9740 0.9727 0.9726 0.9725 0.9761 0.9757 0.9697
1.0000 0.9855 0.9772 0.9715 0.9667 0.9651 0.9631 0.9621 0.9606 0.9596 0.9592 0.9590 0.9589 0.9749 0.9718 0.9683 0.9679 0.9675 0.9746 0.9738 0.9709
1.0000 0.9817 0.9719 0.9645 0.9588 0.9571 0.9547 0.9527 0.9494 0.9472 0.9461 0.9451 0.9448 0.9697 0.9672 0.9647 0.9646 0.9645 0.9701 0.9699 0.9635
1.0000 0.9896 0.9839 0.9787 0.9744 0.9730 0.9710 0.9689 0.9660 0.9633 0.9626 0.9623 0.9622 0.9825 0.9807 0.9804 0.9803 0.9801 0.9821 0.9818 0.9775
1.0000 0.9898 0.9844 0.9811 0.9777 0.9766 0.9753 0.9747 0.9739 0.9737 0.9737 0.9735 0.9735 0.9826 0.9800 0.9775 0.9771 0.9768 0.9821 0.9813 0.9805
1.0000 0.9857 0.9790 0.9741 0.9699 0.9688 0.9673 0.9657 0.9632 0.9619 0.9613 0.9604 0.9600 0.9772 0.9755 0.9740 0.9739 0.9738 0.9774 0.9772 0.9731
Vol. 3 No.11 November 2011
8035
P. Umapathi Reddy et al. / International Journal of Engineering Science and Technology (IJEST) 744 729 775 731 732 710 735 740 714 718 707 722 724 728 736 712 Min.Voltage
0.9690 0.9686 0.9634 0.9632 1.0000 0.9542 0.9541 0.9497 0.9737 0.9723 0.9709 0.9707 0.9705 0.9686 0.9536 0.9751 0.9497
0.9705 0.9704 0.9651 0.9642 1.0000 0.9595 0.9593 0.9588 0.9717 0.9714 0.9629 0.9624 0.9619 0.9701 0.9578 0.9737 0.9578
0.9631 0.9630 0.9571 0.9569 1.0000 0.9478 0.9473 0.9445 0.9671 0.9667 0.9631 0.9629 0.9629 0.9627 0.9475 0.9691 0.9445
0.9768 0.9764 0.9730 0.9728 1.0000 0.9655 0.9654 0.9622 0.9805 0.9791 0.9796 0.9796 0.9793 0.9764 0.9650 0.9813 0.9622
0.9801 0.9800 0.9766 0.9757 1.0000 0.9728 0.9727 0.9734 0.9799 0.9797 0.9734 0.9730 0.9724 0.9797 0.9712 0.9814 0.9712
0.9726 0.9725 0.9688 0.9686 1.0000 0.9616 0.9611 0.9598 0.9754 0.9750 0.9737 0.9737 0.9735 0.9722 0.9613 0.9766 0.9598
Table 3: Summary of test results of 37 bus URDS for capacitor placement
Description Node no. Size of the Capacitor(Qc in kVAr) with node number
With Compensation
Without Compensation Phase A
Phase B
Phase C
Existing method[15] Phase A
Phase B
Proposed method
Phase C
Phase A
Phase B
Phase C
701
100
100
100
0
0
0
737
100
100
100
0
0
0
738
---
---
---
722 712
50
50
50
100
100
100
100
100
100
100
100
100
0
0
0
50
50
50
Minimum voltage (p.u)
0.9497
0.9578
0.9445
0.9648
0.9736
0.9630
0.9622
0.9712
0.9598
Max. Voltage Regulation(p.u)
0.0503
0.0422
0.0555
0.0352
0.0264
0.0370
0.0378
0.0288
0.0412
----
----
---
30.0198
37.4407
33.3333
24.8509
31.7535
25.7657
31.5629
23.6694
30.4423
25.3144
20.4179
25.6992
25.4665
20.4095
24.9962
---
---
---
19.797
13.7371
15.5806
19.3151
13.7726
17.8899
Total active Power demand(kW)
885.5629
789.6694
1163.4423
879.3144
786.4179
1158.6992
879.4665
786.4095
1157.9962
Total reactive power loss (kVAr)
24.0124
22.3149
29.1954
20.1642
18.5200
24.8680
20.4053
18.8301
24.6516
----
---
---
16.02588
17.0061
14.8222
15.022
15.6165
15.5634
Total reactive Power demand(kVAr)
442.0124
397.3149
580.1954
438.1642
393.5200
575.8680
438.4053
393.8301
575.6516
Total Feeder Demand (kVA)
989.7457
883.9892
1300.0864
982.4366
879.381091
1293.9118
982.6803
879.51239
1293.18597
Released feeder capacity (kVA)
----
----
7.3091
4.60811
6.1746
7.0654
4.47681
6.90043
Improvement in Maximum Voltage Reg. (%) Total active power loss(kW) Improvement in active power loss reduction (%)
Improvement in reactive power loss reduction(%)
Best Net saving(Rs.)
worst
-----
Average Time of Execution(s)
ISSN : 0975-5462
-----
-----
282308.1142
309007.5027
31107.2205
222161.7348
270417.3564
307764.2194
110.7660
56.4060
Vol. 3 No.11 November 2011
8036
P. Umapathi Reddy et al. / International Journal of Engineering Science and Technology (IJEST)
Fig. 5 Single line diagram of 37 bus URDS after capacitor placement
6. Conclusions In this paper 37-bus unbalanced radial distribution systems is considered for analysis to determine capacitor location and ratings of capacitor banks. This paper presents a simple method to determine suitable candidate buses based on power loss indices for capacitor placement in unbalanced loading is considered for analysis in distribution systems and also addresses capacitor sizing problem for loss minimization using PSO algorithm. An algorithm is developed for optimal capacitor placement and sizing while minimizing power loss and improving the voltage profile. The results indicates efficacy of the proposed method for capacitor placement and sizing. A marginal improvement in voltages has been obtained and time of execution is decreased. It is concluded that PSO is efficient method to solve non linear optimization problems. References [1] [2] [3] [4] [5] [6] [7] [8] [9] [10] [11] [12] [13] [14] [15] [16]
Abdul-Salam, T.S.; Chikhani, A.Y.; Hacka, R; ( 1994): A new technique for loss reduction using compensating capacitors applied to distribution systems with varying load condition, IEEE Trans. on Power Delivery, Vol.9, No.2, pp.819-827. Baran, M.E. ; Wu, F.F. ;( 1989): Optimal sizing of capacitors placed on a radial distribution system, IEEE trans. on Power Delivery, Vol.4, No.1, pp.735-743. Bridenbaugh, C. J; Di Mascio, D. A.; and D’Aquila R.; (1992): Voltage control improvement through capacitor and transformer tap optimization, IEEE Trans. Power Syst., vol. 7, no. 1, pp. 222– 226. Carlise, J.C.; El-Keib;(2000): A.A.A graph search algorithm for optimal placement of fixed and switched capacitors on radial distribution systems, IEEE Trans. on Power Delivery, Vol.15, No.1, pp.423-42 Chen, C.S.; Hsu C.T.; Yan Y.H.;(1995): Optimal distribution feeder capacitor placement considering mutual coupling effect of conductors, IEEE Trans. on Power Delivery, Vol.10, No.2, pp.987-994. Das,D; Kothari, D.P.; Kalam,A; (1995): Simple and efficient method for load flow solution of radial distribution networks, Electric Power and Energy Systems, Vol.17, No.5,pp.335-346. Eajal, A.A; El.Harway, M.E; (2010): Optimal capacitor placement and sizing in unbalanced distribution systems with harmonics consideration using particle swarm optimization, IEEE Transactions on Power Delivery, Vol.25, issue:3, pp.1734-1741. Goswami, S.K .; Ghose.S, Basu. T,K.;(1999): An approximate method for capacitor placement in distribution system using heuristics and greedy search technique, Electric Power System Research, Vol.51, pp.143-151. Gu,Z ; Rizy, D. T;(1996):Neural network for combined control of capacitor banks and voltage regulators in distribution systems, IEEE Trans.Power Del., vol. 11, no. 4, pp. 1921–1928. Haque, M.H.;(1999): Capacitor placement in radial distribution systems for loss reduction, IEE Proc-C, Vol.146, No.5, pp.501-505. Kim, H.; You, S.K;(1999): Voltage Profile Improvement by capacitor Placement and control in unbalanced distribution Systems using GA”, IEEE power Engineering Society Summer Meeting, Vol. 2, pp.18-22. Levitin,G, ;Elmakis.D;(1995): “Genetic algorithm for optimal sec tionalizing in radial distribution systems with alternative supply”, Electric Power System Research, Vol.35, pp.149-155. Mady, I B;(2009): “Optimal Sizing of Capacitor Banks and Distributed Generation in Distorted Distribution Networks by Genetic Algorithms”, Electricity Distribution-Part 1, CIRED -2009. 20th International Conference and Exhibition on, vol., no., pp.1-4, 8-11. Ranjan,R.; Venkatesh,B.; Das.D; (2003): Optimal conductor selection of radial distribution feeders using evolutionary programming, IEEE Conference, pp.1-4. Subramnyam, J.B.V.; (2009): Optimal capacitor placement in unbalanced radial distribution networks Journal of Theoretical and Applied Information Technology vol:6,N0:1,pp106-115. Sundharrajan,S ; Pahwa, A.;(1994): Optimal selection of capacitors for radial distribution systems using a genetic algorithm , IEEE Trans.on Power Systems. Vol.9, pp.1499-1507.
Author’s information Mr.P.UMAPATHI REDDY :He Received B.E from Andra University and M.Tech (Electrical Power Systems) from Jawaharlal Nehru Technological University, Anantapur, India in 1998 and 2004 respectively,
ISSN : 0975-5462
Vol. 3 No.11 November 2011
8037
P. Umapathi Reddy et al. / International Journal of Engineering Science and Technology (IJEST)
Now he is pursuing Ph.D. degree. Currently he is with Department of Electrical and Electronics Engineering, Sree Vidyanikethan Engineering College, Tirupati, India. His research interest includes Power distribution Systems and Power System operation and control. He is Life Member of Indian Society for Technical Education. Dr.S.Sivanaga Raju: He received B.E from Andra University and M.Tech., degree in 2000 from IIT,Kharagpur and did his Ph.D from Jawaharlal Nehru Technological University, Anantapur, India in 2004. He is presently working as Associate professor in J.N.T.U.College of Engineering Kakinada(Autonomous) Kakinada ,Andrapradesh, India. He received two national awards (Pandit Madan Mohan Malaviya memorial Prize and best paper prize award from the Institute of Engineers(India) for the year 2003-04. He is referee for IEEE journals. He has around 75 National and International journals in his credit. His research interest includes Power distribution Automation and Power System operation and control. Dr.P.Sangameswara Raju He is presently working as professor in S.V.U.College Engineering, Tirupati. Obtained his diploma and B.Tech in electrical Engineering, M.Tech in power system operation and control and Ph.d in S.V.University,Tirupati. His areas of interest are power system operation, planning and application of fuzzy logic to power system, application of power system like non-linear controllers.
ISSN : 0975-5462
Vol. 3 No.11 November 2011
8038