Monitoring the performance of servers in a network is a challenging and po- .... passive inference of application-level behavior from TCP headers (Smith et al [4],.
Passive, Streaming Inference of TCP Connection Structure for Network Server Management Jeff Terrell1 , Kevin Jeffay1 , F. Donelson Smith1 , Jim Gogan2 , and Joni Keller2 1
Department of Computer Science ITS Communication Technologies University of North Carolina Chapel Hill, NC 27599 {jsterrel,jeffay,smithfd}@cs.unc.edu, {gogan,hope}@email.unc.edu 2
Abstract. We have developed a means of understanding the performance of servers in a network based on a real-time analysis of passively measured network traffic. TCP and IP headers are continuously collected and processed in a streaming fashion to first reveal the application-layer structure of all client/server dialogs ongoing in the network. Next, the representation of these dialogs are further processed to extract performance data such as response times of request-response exchanges for all servers. These data are then compared against archived historical distributions for each server to detect performance anomalies. Once found, these anomalies can be reported to server administrators for investigation. Our method uncovers nontrivial performance anomalies in arbitrary servers with no instrumentation of the server nor even knowledge of the server’s function or configuration. Moreover, the entire process is completely transparent to servers and clients. We present the design of the tools used to perform this analysis, as well as a case study of the use of this method to uncover a significant performance anomaly in a UNC web portal.
1
Introduction
Monitoring the performance of servers in a network is a challenging and potentially expensive problem. Common approaches are to purchase and install monitoring software on the server, or to use an active monitoring system that generates service requests periodically and measures the response time. Both approaches, while effective, typically require extensive customization to work with the specific server/service at hand. We are developing an alternate approach based on passive collection of packet header traces, and real-time analysis of the data to automatically construct an empirical model of the requests received by servers and the responses generated. These models can be constructed for arbitrary servers with no knowledge of the functions performed by the server or the protocols used by the server. Given these models, we can easily compute important performance measures such as
2
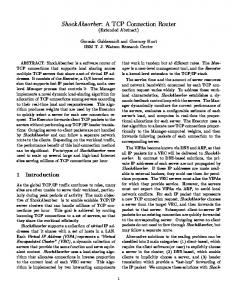
the response times for a server. Using statistical methods originally developed for medical image processing, distributions of these variables can be compared to archived historical distributions for each server to detect performance anomalies. The approach works for arbitrary servers because it relies solely on properties of TCP. Using knowledge of the TCP protocol, packet header traces (consisting of only TCP/IP headers and no application layer headers or payloads) are processed in a streaming fashion to construct a structural model of the application dialog between each server and each client in real-time. This model is an abstract representation of the pattern of application-data-unit (ADU) exchanges that a client and server engaged in at the operating system’s socket interface. For example, if a web browser made a particular request to a web server that was 200 bytes long, and the server generated a response of 12,000 bytes, then by analyzing the headers of the sequence of TCP/IP packets flowing between the client and server, we would infer this request/response structure and represent this dialog as consisting of a single exchange wherein 200 bytes were sent from client to server and 12,000 bytes were sent from server to client. We intentionally ignore transport-layer effects such as segmentation, retransmission, etc. The model can be augmented to include both server-side and client-side “think times” which can be inferred from the arrival time of the packets. We refer to the server-side think times as response times, and they are our primary performance metric. Using off-the-shelf hardware, we have constructed a network monitoring server that is capable of tracing the 1 Gbps link connecting the 40,000 person UNC campus to its upstream ISP, and performing the above analysis continuously, in real-time, for all servers on the UNC campus. We have been continuously tracing the UNC campus and gathering response time performance data for all servers for a period of over six months. During this period we have processed approximately 70 terabytes of packet headers. However, because our representation of client/server dialogs is relatively compact, the complete activity of the UNC servers during this 6-month period requires only 3 terabytes of storage (600 gigabytes, compressed). By mining these data for performance anomalies, we were able to discover a significant performance anomaly that occurred to a major UNC web portal. Over a period of three days in April 2008, the server experienced a performance issue in which the average response time increased by 1,500%. This discovery was made without any instrumentation of the server or even a priori knowledge of the server’s existence. In this paper we present an overview of our method of capturing and modeling client/server dialogs and its validation. The dialogs are represented using a format we call an a-b-t connection vector where a represents a request size, b represents a response size, and t represents a think time. We present the an overview of a tool we have developed called adudump that processes TCP/IP packet header traces in real-time to generate a-b-t connection vectors for all client/server connections present in the network. We then present some results from an on-going case study of the use of adudump to generate connection vectors for servers on the UNC campus network and the mining of these data to under-
3
stand server performance. The tools used in this study and the data obtained will be publicly available for non-commercial use.
2
Related Work
Inferring the behavior of applications from analyses of underlying protocols is not new. For example, several schemes for monitoring web systems via an analysis of HTTP messages have been reported. Feldmann’s BLT system [1] passively extracts important HTTP information from a TCP stream, but, unlike our approach, BLT is an off-line method that requires multiple processing passes and fundamentally requires information in the TCP payload (i.e., HTTP headers). This approach cannot be used for continuous monitoring or monitoring when traffic is encrypted. In [2] and [3], Olshefski et al introduce ksniffer and its improved sibling, RLM, which passively infer application-level response times for HTTP in a streaming fashion. However, both systems require access to HTTP headers, making them unsuitable for encrypted traffic. Furthermore, these approaches are not purely passive. ksniffer requires a kernel module installed on the server system, and RLM places an active processing system in the network path of the server. In contrast, our methods will work for any application-layer protocol and we can monitor a large collection of arbitrary servers simultaneously. Commercial products that measure and manage the performance of servers include the OPNET ACE system3 . ACE also monitors response times of network services but requires an extensive deployment of measurement infrastructure throughout the network, on clients, servers, and points in between. Fluke’s Visual Performance Manager4 is similar and also requires extensive configuration and integration. Also similar is Computer Associates Wily Customer Experience Manager5 . CEM monitors the performance of a particular web server, and in the case of HTTPS, it requires knowledge of server encryption keys in order to function.
3
Measurement
The adudump tool generates a model of ADU exchanges for each TCP connection seen in the network. The design of the tool is based on earlier approaches for passive inference of application-level behavior from TCP headers (Smith et al [4], Weigle et al [5], Hernandez-Campos et al [6,7]). However, while these approaches build application-level models from packet headers in an offline manner, we have extended these techniques to enable online (real-time) inference (i.e. analyzing packets as they are seen at a monitor in a single pass). This affords the capability for continuous measurement of application-level data. 3 4
5
http://www.opnet.com/solutions/application performance/ace.html http://www.flukenetworks.com/fnet/en-us/products/ Visual+Performance+Manager/Overview.htm http://www.ca.com/us/performance-monitoring.aspx
4 C H
T
T
l
i
e
n
t
M
o
n
i
t
o
r
S
e
r
v
e
r
R
e
c
o
r
d
s
P
S
Y
N
t
S
Y
N
/
A
A
C
C
S
Y
N
>
R
T
T
t
0
K
S
S
E
0
K
Q
=
3
7
E
Q
2
t
1
> A
S
E
D
U
Q
=
1
4
6
0
3
7
2
t
A
K
=
3
7
1
2
C
= A
C
1
4
6
0
K
S
E
Q
=
2
2
0
9
Q S
E
3
0 =
3
0
t
2
0
=
3 0
A
C
K
A
D
U
A
S
E
D
U
Q
3
0
=
3
7
0
3
4
t
1
A
K
=
2
C
7
3
A
C
K
=
3
7
3
0
A F
I
D
U
< >