Patch Discrimination as a Function of Handling Time E. H. Leone and I. Este´vez1 Department of Animal and Avian Sciences, University of Maryland, College Park 20742 of discrete patch visitors were significantly greater at the more profitable patches, requiring less handling time. We found a greater number of birds exploiting all 3 patches at larger GS, although we did not detect a parallel increase in aggression. On the contrary, aggression increased only as handling time decreased. These results suggest that at large GS resource monopolization did not occur; birds were most likely involved in scramble competition, particularly at the more profitable patches. Our findings show that broilers are able to discern the handling time required to obtain nutritious feed and adjust their foraging behavior according to the number of competitors.
ABSTRACT We tested male broiler chickens in 3 experimental group sizes (GS) to examine the mediating effects of GS and feed handling time on patch choice. We tested the experimental GS in a 3-patch discrimination trial with patches that contained identical amounts of feed but differed in the proportion of inedible filler material (wood shavings) added. The patch requiring the least handling time offered the highest profitability and was composed of 25% filler and 75% feed (by volume), whereas the mid and low profitability patches contained 50 and 75% filler, respectively. Food consumption, foraging duration, patch residence time, number of foraging bouts, and number
Key words: broiler, foraging behavior, handling time, group size, competition 2007 Poultry Science 86:447–452 When feed resources are scattered and unpredictable, individuals improve their efficiency by foraging in groups (Ranta et al., 1995; Sernland et al., 2003). However the success of this strategy will depend both on resource availability and on the level of competition between group members (Caraco et al., 1989; Ranta et al., 1993), which may lead to limited access for subordinate group members (Stahl et al., 2001). Domestic animals, such as broiler chickens, have been shaped by generations of intense artificial selection geared toward increasing growth and performance-related traits (Dumont and Petit, 1998; Gustafsson et al., 1999; Arcis and Desor, 2003). The present work investigated the ability of broilers to discriminate between patches providing equal total amounts of feed but which varied according to handling time or the ease of consuming edible feed items, and as a function of the level of competition between group members. The patches did not differ in nutrient concentration; identical feed sources and amounts were available at each patch. Under commercial conditions, handling time can vary depending on the amount of litter or other materials that may temporarily accumulate in the feeders. We hypothesized that broilers would forage in the most energy efficient manner, choosing the most profitable sites that required the least handling time and that they would adjust their foraging strategy according to the number of competitors present.
INTRODUCTION In the wild animals forage in a manner that maximizes their net energy gain (Charnov, 1976; Parker and Stuart, 1976; Caraco, 1981). The amount of time spent foraging in an area and the amount of feed consumed will depend not only on the availability but also on the profitability of available resources (McNair, 1982; Alonso et al., 1995). To reach optimum foraging potential animals must not only determine resource quality within an environment but also readily distinguish differences in handling time, or the amount of time required to harvest and utilize resources (Vincent et al., 1996). If feed is equally available but requires greater handling time, then foraging efficiency (profitability) will be reduced and animals will spend a greater amount of time and energy in pursuit of a meal. Animals should therefore determine the abundance of feed and further differentiate between sites that differ according to the required handling time. Research has repeatedly shown that wild species are able to discriminate and accurately choose patches based on handling time, nutrient quality, and net energy gain (Lewis, 1980; Caraco et al., 1989; Valone and Giraldeau, 1993; Alonso et al., 1995; Kie, 1996; Alm et al., 2002; Kacelnik and Brunner, 2002; Schaefer et al., 2003); however, limited work has focused on this ability in domestic species. For any social species, foraging strategies are significantly affected by group dynamics (Este´vez et al., 2006).
MATERIALS AND METHODS Facilities and Experimental Animals
©2007 Poultry Science Association Inc. Received June 14, 2006. Accepted October 23, 2006. 1 Corresponding author:
[email protected]
We conducted this experiment at the applied animal research facilities of the University of Maryland. We ob447
448
LEONE AND ESTE´VEZ
tained a total of three hundred thirty-six 1-d-old male Ross × Ross broiler chicks from a commercial hatchery. Upon arrival at the facility we randomly sorted chicks into 8 different groups of 42 individuals. Each group was placed into a separate pen measuring 1.8 m × 2.4 m (4.5 m2). We maintained a lighting program of 14L:10D; temperature and ventilation programs followed standard practices (Leone et al., 2006). We provided feed and water ad libitum through a central large tubular hopper and a line of nipple drinkers (7 nipples per pen, 6 individuals per nipple) located along 1 side of each pen. We tagged the birds at 3 wk of age on each side of the neck using the Swiftack for Poultry Identification System (Heartland Animal Health Inc.). We left 7 individuals unmarked per pen as replacements in the event of mortalities. The experiment reported here took place when the birds were 8 to 9 wk of age.
Experimental Design During testing each of the 8 groups of 42 birds were divided into 3 experimental groups of 5 (GS5), 10 (GS10), and 20 (GS20) animals. At random we designated 5 individuals per group as focal animals in each of the experimental GS. All 42 birds were housed together in a single home pen throughout the experiment. The 3 experimental GS were housed together to create a homologous social background environment for each experimental testing group, enabling us to measure the distinct and immediate reaction of broilers to a new social environment. We tested the 3 experimental group sizes, all from 1 home pen group, in 3 testing arenas each measuring 2.4 m × 7.3 m. Water was provided ad libitum from a line of nipple drinkers, one at each end of the arena. Birds were feedrestricted for 2 h prior to testing. The 3 experimental patches used for this experiment were constructed from dark brown plastic containers measuring 10 cm in diameter and 14 cm high, attached to a 12-cm-high solid wood platform. To induce competition, we limited feed access at each patch to a single individual by affixing transparent plastic sheeting around the circumference, except for a 4-cm opening on 1 side. We arranged the patches in a triangular fashion in the center of the testing arena, 80 cm apart from one another with each opening facing the center of the triangle. All 3 patches contained 50 g of dry cat food (previously shown to be highly attractive to broilers) and a variable proportion of inedible filler material (wood shavings) that was mixed with the cat food to manipulate handling time. These patches ranged in feed to filler volume ratios between the high profitability (HP) patch with a volume of 25% filler and 75% feed, the medium profitability (MP) patch with 50% filler and 50% feed, and the low profitability (LP) patch with a volume of 75% filler and 25% feed. Patches containing a greater volume of filler required greater handling time because the shavings had to be moved and manipulated to acquire the feed particles and we therefore presumed these patches to be less profitable for the birds. Patches did not differ in nutrient
quality or concentration because the feed available to the birds in each patch was identical in type and quantity, and the filler material provided no nutritional value. We placed a disc on top of the mixture to be removed immediately upon releasing each experimental group into the testing arena. We randomly assigned the position of each patch within the triangular arrangement for each test. We habituated birds to the patches by filling one with 100 g of cat food (no filler) and placing it in each home pen twice daily for 3 consecutive days prior to testing. Groups quickly consumed all of the available feed. We transported 1 experimental GS at a time, in crates, from their home pen to one of the testing arenas. Birds were acclimated to this transportation procedure during the 2 wk prior to the experiment. We randomly assigned the order of testing by home pen and GS. We tested each experimental GS only once. This described experimental protocol was approved by the Institutional Animal Care and Use Committee at the University of Maryland (R03-04).
Behavioral Observations Each experimental trial lasted for 30 min and was video recorded for later analysis using the Observer (v.4.1 Noldus, Leesburg, VA). From these videos we collected continuous data on the identification number of the birds at each of the 3 patches (HP, MP, LP), and calculated the number of foraging bouts, their average duration, the number of distinct visitors, and total patch residence time (PRT). We recorded one foraging bout each time a bird’s head crossed the opening of the plastic sheet. The distinct visitors described the number of different individuals in a GS that fed from the patches during the test. Average foraging duration was defined as the mean length of all foraging bouts occurring in 30 min, and PRT was the total amount of time a patch was occupied by any bird during the test. In addition, at 1-min intervals we collected the total number of individuals located within each foraging area, defined as the 5-cm area surrounding the patch as well as all aggressive interactions that occurred there. Definitions for the different types of aggressive interactions recorded were adapted from Este´vez et al., (2002) and consisted of pecks, threats, leaps, kicks, fights, and fights with pecks. To determine total feed consumption, we weighed the patch prior to and after each testing session because birds were never observed ingesting the inedible filler material (E. H. Leone, personal observation).
Statistical Analysis We conducted all analyses using MIXED model ANOVA in SAS (v. 8.1, SAS Institute, Cary, NC). We examined model assumptions of normality and homogeneity of variance. We log-transformed the number of individuals at each patch and the number of aggressive interactions, and square root transformed the total number of foraging bouts and total feed consumption measures. Be-
PATCH DISCRIMINATION AND HANDLING TIME
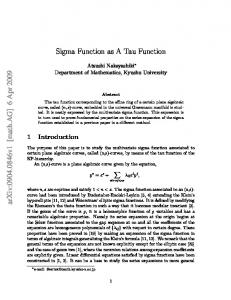
Figure 1. Total feed consumption per 30-min testing period (least squares means ± SEM) according to required handling time or patch profitability (a); high (HP), medium (MP), and low (LP) profitability respectively and as a function of group size (b); GS5, GS10, and GS20, respectively. a–cBars sharing any common letters are not significantly different at P > 0.05 after Tukey’s adjustment.
cause treatment variances were found to be heterogeneous, we used the variance for each patch rather than a pooled variance component for the PRT analysis to satisfy the ANOVA assumptions. We analyzed all data with a MIXED model in which experimental GS and patch profitability were fixed factors and pen was a random blocking factor. We tested 2 a priori contrast statements to determine whether the larger GS (GS10 and GS20) utilized the lower profitability patches requiring greater handling time (MP and LP) to a greater extent than the smaller GS (GS5) for total feed consumption and the number of distinct patch visitors measured. This was done because these comparisons are not explicitly tested by the interaction of GS and patch profitability. We incorporated a Kronecker product into our MIXED model to generate covariance matrices that would allow us to account for multiple dependencies in our variables. This enabled us to calculate 2 variance matrices, an unstructured matrix that accounted for the random effect of pen, and a compound symmetry matrix that accounted for the dependence of the patch choice response variables because all 3 patch treatments were presented simultaneously. Because of the low occurrence of aggressive behaviors we modeled total aggression per individual for statistical analysis, measured as the sum of all aggressive interactions per 30-min testing session. Mean comparisons are reported with a Tukey’s least significant difference adjustment for type I error rates (for review, see Jones, 1984)
RESULTS Total Food Consumption and Number of Patch Visitors We found that patch profitability had an important effect on total feed consumption (Figure 1a; F2,20 = 20.61,
449
Figure 2. Total number of distinct foraging individuals per 30-min testing period (least squares means ± SEM) at each patch (a); high (HP), medium (MP), and low (LP) profitability respectively and according to group size (b); GS5, GS10, and GS20, respectively. a–cBars sharing any common letters are not significantly different at P > 0.05 after Tukey’s adjustment.
P < 0.001); birds consumed more feed from the HP patch, followed by the MP and LP patch. Consumption, as expected, increased with GS (Figure 1b; F2,21 = 4.66, P < 0.05). Mean contrasts revealed that birds at the 2 larger GS (GS10 and GS20) consumed more feed at the 2 lower profitability patches requiring greater handling time (MP and LP) than did the smaller GS5 (t20 = 3.07, P < 0.01). We observed that more birds gained access to the patches not only as profitability increased (Figure 2a; F2,19 = 7.24, P < 0.01) but also as GS increased (Figure 2b; F2,20 = 17.73, P < 0.001). Similarly, the number of distinct visitors at the lower profitability patches requiring greater handling time (MP and LP) was significantly higher for the 2 largest GS (GS10 and GS20) as compared with GS5 (t20 = 5.15, P < 0.001).
Foraging Bouts and Patch Residence Time We observed more foraging bouts at the higher profitability patches requiring the least handling time (Figure 3a; F2,20 = 5.58, P < 0.05). As expected given the increased number of patch visitors, the number of foraging bouts was higher for larger GS (Figure 3b; F2,21 = 4.74, P < 0.05) but was not influenced by the interaction term (F4,23.2 = 0.79, P > 0.05). Not only did we observe a higher number of foraging bouts at the HP patch, but also the average duration increased significantly (Figure 4a; F2,13.2 = 15.69, P < 0.001). We also found that the average foraging bout duration decreased as GS increased (Figure 4b; F2,12.1 = 9.94, P < 0.01). The PRT was longer for the HP patch when compared with the MP and LP patch (Figure 5a; F2,18.2 = 11.86, P < 0.001), likewise we found that total PRT increased with GS because more birds gained access to the patches (Figure 5b; F2,13.2 = 13.20, P < 0.05). None of the patch profit-
450
LEONE AND ESTE´VEZ
Figure 3. Mean number of foraging bouts per 30-min testing period (least squres means ± SEM) according to the handling time required at each patch, or patch profitability (a); high (HP), medium (MP), and low (LP) profitability respectively and according to group size (b); GS5, GS10, and GS20, respectively. a,bBars sharing any common letters are not significantly different at P > 0.05 after Tukey’s adjustment.
ability × GS interactions were significant for average foraging bout duration (F4,14.3 = 1.96, P > 0.05) or PRT (F4,17.4 = 0.54, P > 0.05), indicating that birds at different GS responded consistently to the changes in handling time at each patch.
Resource Competition Overall we observed a relatively low level of contest competition for resources as indicated by the levels of
Figure 5. Total patch residence time (PRT; s) per 30-min testing period (least squres means ± SEM) according to the handling time required at each patch, or patch profitability (A); high (HP), medium (MP), and low (LP) profitability respectively and by group size (b); GS5, GS10, and GS20, respectively. a–cBars sharing any common letters are not significantly different at P > 0.05 after Tukey’s adjustment.
aggression. In all GS a low overall number of birds chose to forage during the trials, despite being feed deprived prior to entering the testing arena. Nevertheless we detected a greater number of total aggressive interactions across all GS at the HP patch, followed by the MP and LP patch (Table 1; F2,20 = 3.68, P < 0.05). Because of the large variation in behavior, we did not find significant differences between the LP patch, requiring the greatest handling time, and the other patches. Surprisingly, the level of aggression was similar across all GS (F2,21 = 0.43, P > 0.05). The interaction effect on aggression was also nonsignificant (F4,23.2 = 0.68, P > 0.05).
DISCUSSION
Figure 4. Mean foraging bout duration (s) per 30-min testing period (least squres means ± SEM) by handling time required at each patch, or patch profitability (a); high (HP), medium (MP), and low (LP) profitability respectively, and by group size (b); GS5, GS10, and GS20, respectively. a,bBars sharing any common letters are not significantly different at P > 0.05 after Tukey’s adjustment.
In this paper we provide evidence for the ability of broilers to select patches containing equal amounts of an attractive feed, but which varied as a function of the handling time required to consume feed particles. Birds quickly and consistently chose the patch offering the highest profitability, enabling them to maximize feed intake. Irrespective of GS, birds in our experiment showed a strong and consistent preference for the HP patch, which required the least handling time. These results agree with previous findings in wild species; however, rather than altering the total amount of feed available (Lewis, 1980; Caraco et al., 1989; Alonso et al., 1995; Alm et al., 2002), here we demonstrated that broilers were able to successfully distinguish between patches varying solely according to handling time. Because the filler material was inedible, foraging from the LP patch was presumably more labor intensive and less profitable than foraging from the MP or the HP patch. Birds were able to quickly discern the differences in required handling time across patches and subsequently visited and fed from the HP patch most often, as indicated
451
PATCH DISCRIMINATION AND HANDLING TIME Table 1. Aggressive interactions at each patch
1
Item
Threats
Pecks
Standoffs
Fights
Fights with pecks
HP MP LP
20 8 4
26 19 10
7 4 4
3 0 0
2 1 0
Chases
Total
Total per bird, per trial
7 5 0
65 37 18
0.26 ± 0.08a 0.16 ± 0.06b 0.07 ± 0.01ab
Means sharing any common letters are not significantly different after a Tukey adjustment (P > 0.05). Total number of aggressive interactions recorded during all testing sessions (n = 8), as well as the mean (±SEM) number of aggressive interactions per bird, per experimental trial at the high profitability (HP), medium profitability (MP), and low profitability (LP) patches. Only total aggression, measured as a combination of all aggressive interactions, was statistically analyzed. a,b 1
by the higher average foraging bout duration and increased PRT and total feed consumption. Birds demonstrated a strong preference for the HP patch despite the fact that all 3 patches contained an equal amount of attainable feed. The results of this experiment are in line with previous work that has demonstrated the energetically sparing foraging strategies of chickens (Andersson et al., 2001; Schutz et al., 2001; Lindqvist et al., 2002). Our experiment is unique in that we presented birds with a novel paradigm of choosing between patches that differed solely in the handling time required to acquire feed rather than changing the total amount of feed available. Prior to data collection the birds had never worked for feed or been exposed to patches with differing handling times or to multiple foraging sites. The novel experimental conditions ensured that the behavioral responses recorded were based entirely on the birds’ ability to immediately distinguish the differences in the handling time of feed at each patch. We examined the foraging strategies of broilers at different GS because it is reasonable to expect that they differ when animals are tested in groups vs. individually (Caraco, 1981). We anticipated that the experimental setup would allow the 3 most dominant individuals in each experimental group to monopolize the patches and restrict the access of all other group members (McBride, 1970). If this were the case then a maximum of 3 individuals should gain access to all patches during the trial. On the contrary, as GS increased so did the number of distinct birds that gained access to the patches. Saturation of the HP patch was more likely to occur at larger GS, forcing a greater number of birds to move to less profitable patches. We found increased use of the MP and LP patches by birds in GS10 and GS20 as compared with GS5. This can be linked to increased difficulty in accessing the HP patch at larger GS because of a greater number of competitors or because of a higher rate of feed depletion of the HP patch with larger GS. It should be noted, however, that at the end of each trial the average litter:feed ratio in the HP patch remained superior to that of the MP and the LP patches. Animals should make use of the best available foraging options. At large GS this entailed visiting the MP or LP patch as a direct result of increased competition generated by larger GS (Newman and Caraco, 1987; Nakagawa, 1990; Koops and Abrahams, 2003). When the HP patch was occupied, birds could stay
and jostle for access or alternatively forage from the lower profitability patches. Our results suggest that individuals in larger GS that were unsuccessful at gaining access to the HP patch moved on to the MP and LP patches. This finding is similar to that of Este´vez et al. (2002) in which birds were tested in GS ranging from 15 to 120 with patches placed in the center and periphery of the pen. In their study the number of individuals visiting the peripheral patch increased as the central patch became quickly saturated at larger GS. This suggests that when patches become saturated individuals opt to move to less profitable patches, results that are similar to what has been reported for wild species (Symington, 1988; Whitten, 1988; Nakagawa, 1990). Although the number of foraging bouts increased with GS, the average foraging duration decreased. This could be the result of a greater number of disturbances occurring as birds jostled for access to the patches at larger GS. Frequent displacement would shorten the average foraging bout duration for any given individual and increase the total number of bouts. Aggressive interactions did not seem to play a role in the effects of GS on foraging bout duration; the frequency of aggression varied solely according to patch quality rather than GS. These findings support the notion that broilers were more willing to expend additional energy in an effort to gain access to the HP patch, as would be expected in a highly competitive foraging environment (Schmidt et al., 1998). We suggest that the profitability of the available resources and possibly the number of actual competitors at the patch is more important in determining aggression than GS alone. In conclusion, our results show that broilers were able to distinguish between patches containing identical total amounts of feed but which varied according to the handling time required. We have also shown that birds are able to adjust their foraging strategy as a function of GS by utilizing patches offering reduced profitability to a greater extent when competition for resources increases. From an applied standpoint our results suggest that if feeders are not properly maintained (specifically manual feeders) and accumulate excessive litter, dust, or other materials, this may lead to unequal profitability across feed resource sites and an uneven bird distribution. These may be less prominent in an automatic feeding system if freshly dispensed feed completely covers any materials remaining in the feeder.
LEONE AND ESTE´VEZ
452
REFERENCES Alm, U., B. Birgersson, and O. Leimar. 2002. The effect of food quality and relative abundance on food choice in fallow deer. Anim. Behav. 64:439–445. Alonso, J. C., J. A. Alonso, M. Bautista, and R. Munoz-Pulido. 1995. Patch use in cranes: A field test of optimal foraging predictions. Anim. Behav. 49:1367–1379. Andersson, M., E. Nordin, and P. Jensen. 2001. Domestication effects on foraging strategies in fowl. Appl. Anim. Behav. Sci. 72:61–62. Arcis, V., and D. Desor. 2003. Influence of environment structure and food availability on the foraging behaviour of the laboratory rat. Behav. Proc. 60:191–198. Caraco, T. 1981. Risk-sensitivity and foraging groups. Ecology 62:527–531. Caraco, T., C. Barkan, J. L. Beacham, L. Brisbin, S. Lima, A. Mohan, J. A. Newman, W. Webb, and M. L. Withiam. 1989. Dominance and social foraging: A laboratory study. Anim. Behav. 38:41–58. Charnov, E. L. 1976. Optimal foraging, the marginal value theorem. Theor. Popul. Biol. 9:129–136. Dumont, B., and M. Petit. 1998. Spatial memory of sheep at pasture. Appl. Anim. Behav. Sci. 60:43–53. Este´vez, I., I. L. Andersen, and E. Nævdal. 2006. Group size, density and social dynamics in farm animals. Appl. Anim. Behav. Sci. (In press) Este´vez, I., R. C. Newberry, and L. J. Keeling. 2002. Dynamics of aggression in the domestic fowl. Appl. Anim. Behav. Sci. 76:307–325. Gustafsson, M., P. Jensen, F. H. de Jonge, and T. Schuurman. 1999. Domestication effects on foraging strategies in pigs (Sus scrofa). Appl. Anim. Behav. Sci. 62:305–317. Jones, D. 1984. Use, misuse, and roles of multiple-comparison procedures. Environ. Entomol. 13:635–649. Kacelnik, A., and D. Brunner. 2002. Timing and foraging: Gibbon’s scalar expectancy theory and optimal patch exploitation. Learn. Motiv. 33:177–195. Kie, J. G. 1996. The effects of cattle grazing on optimal foraging in mule deer (Odocoileus hemionus). For. Ecol. Manage. 88:131–138. Koops, M. A., and M. V. Abrahams. 2003. Integrating the roles of information and competitive ability on the spatial distribution of social foragers. Am. Nat. 161:586-600. Leone, E. H., I. Este´vez, and M. C. Christman. 2006. Environmental complexity and group size: Immediate effects on the use of space in domestic fowl. Appl. Anim. Behav. Sci. (In press) Lewis, A. R. 1980. Patch use by gray squirrels and optimal foraging. Ecology 61:1371–1379. Lindqvist, C. E. S., K. E. Schutz, and P. Jensen. 2002. Red jungle fowl have more contrafreeloading than White Leghorn lay-
ers: Effect of food deprivation and consequences for information gain. Behaviour 139:1195–1209. McBride, G. 1970. The social control of behaviour in fowls. Pages 3–13 in Aspects of poultry behaviour. B. M. Freeman and R. F. Gordon, ed. Br. Poult. Sci., Edinburgh, UK. McNair, J. N. 1982. Optimal giving-up times and the marginal value theorem. Am. Nat. 119:511–529. Nakagawa, N. 1990. Choice of food patches by Japanese monkeys (Macaca fuscata). Am. J. Primatol. 21:17–29. Newman, J. A., and T. Caraco. 1987. Foraging, predation hazard and patch use in grey squirrels. Anim. Behav. 35:1804–1813. Parker, G. A., and R. A. Stuart. 1976. Animal behavior as a strategy optimizer—Evolution of resource assessment strategies and optimal emigration thresholds. Am. Nat. 110:1055–1076. Ranta, E., H. Rita, and K. Lindstrom. 1993. Competition versus cooperation—Success of individuals foraging alone and in groups. Am. Nat. 142:42–58. Ranta, E., H. Rita, and N. Peuhkiri. 1995. Patch exploration, group foraging, and unequal competitors. Behav. Ecol. 6:1–5. Schaefer, H. M., V. Schmidt, and F. Bairlein. 2003. Discrimination abilities for nutrients: Which difference matters for choosy birds and why? Anim. Behav. 65:531–541. Schmidt, K. T., L. J. Seivwright, H. Hoi, and B. W. Staines. 1998. The effect of depletion and predictability of distinct food patches on the timing of aggression in red deer stags. Ecography 2:415–422. Schutz, K. E., B. Forkman, and P. Jensen. 2001. Domestication effects on foraging strategy, social behaviour and different fear responses: A comparison between the red junglefowl (Gallus gallus) and a modern layer strain. Appl. Anim. Behav. Sci. 74:1–14. Sernland, E., O. Olsson, and N. M. A. Holmgren. 2003. Does information sharing promote group foraging? Proc. R. Soc. Lond. B Biol. Sci. 270:1137–1141. Stahl, J., P. H. Tolsma, M. J. J. E. Loonen, and R. H. Drent. 2001. Subordinates explore but dominants profit: Resource competition in high arctic barnacle goose flocks. Anim. Behav. 61:257–264. Symington, M. M. 1988. Food competition and foraging party size in the black spider monkey (Ateles paniscus chamek). Behaviour 105:117–134. Valone, T. J., and L. Giraldeau. 1993. Patch estimation by group foragers: What information is used? Anim. Behav. 45:721– 728. Vincent, T. L. S., D. Scheel, J. S. Brown, and T. L. Vincent. 1996. Trade-offs and coexistence in consumer-resource models: It all depends on what and where you eat. Am. Nat. 148:1038–1058. Whitten, P. L. 1988. Effects of patch quality and feeding subgroup size on feeding success in vervet monkeys (Cercopithecus aethiops). Behaviour 105:35–52.