ABSTRACT. One of the tests carried out on a transformer after assembly is the lightning im- pulse test, for assessment of the integrity of its winding insulation.
IEEE Transactions on Dielectrics and Electrical Insulation
Vol. 9, No. 4; August 200.2
555
Pattern Classification of Impulse Faults in Transformers by Wavelet Analysis P. Purkait Instrumentation Engincering Dcpartment Haldia Institute of Technology Haldia, Midnapore 721 657, India
and ~
s. Chakravorti
Electrical Enginecring Department Jadavpur University Kolkata 700 032, India
ABSTRACT One of the tests carried out on a transformer after assembly is the lightning impulse test, for assessment of the integrity of its winding insulation. In the case of a fault, it has been well established that the pattern of the fault currents contains a typical signature of the nature and location of the insulation failure involved. This paper describes a new approach using the 'wavelet transforms' to classify the patterns inherent in different fault currents. Whereas conventional frequencyresponse analysis based techniques fail to identify the time-localization of a particular frequency component in a time-dependent signal, the wavelets are not only localized in frequency, hut also in time. The 'time-frequency localization' feature of wavelet transform is employed for pattern classification of impulse fault currents of transformers. Results for simulated models of 3,5 and 7 MVA transformers are presented to illustrate the' ability of this approach to classify insulation failures.
1
INTRODUCTION
NSUGTION failure within transformers is considered to be one of the most important causes of failure of power transformers. Impulse testing of transformers after assembly is an accepted procedure for the assessment of their winding insulation strength to surge ovelvoltages. In such tests, impulse voltage sequences are generated in the laboratory and applied to the transformers as per standards [l]. Manufacturing defects or inadequacy of insulation may lead to failure against impulse voltage stresses. The detection of the fault and its location of occurrence, which in many cases may take a long time, have to be determined for taking proper remedial measures. For many years, the applied voltage waveforms and the resulting current waveforms were analyzed manually by studying oscillographic records [Z-61. Such manual interpretation of the waveform patterns for fault identification and classification was strongly dependent on the knowledge and experience of the experts performing the analysis. With the advent of digital recorders and analyzers, there has been an increasing trend to use the frequency domain analysis, particularly the transfer function approach [7-91
I
for fault classification. In recent years, the use of computer aided techniques like expert systems [lo-121 and artificial neural networks (ANN) 1131 have been employed for impulse fault classification in transformers. Wavelets are widely used in areas [14-151 such as singularity detection, data compression, detecting features in images, noise elimination and harmonic distortion in signals. The wavelet technique is an advancement over Fourier transform, which allows each frequency component to be studied with appropriate time resolution. Recently, the wavelet technique has been. applied in transformer condition assessment and fault diagnosis [16-201. The inherent noo-stationary pattern of transformer current waveforms during different fault conditions can be effectively classified using this frequency-selective feature of wavelet transform. Determination of incipient faults involved careful and precise recording of the current wave data [171, whereas location identification of permanent kind of impulse faults required the exact knowledge of the travelling wave velocity in the transformer winding [18]. However, due to the complex nature of the composite insulation system of transformers, determination of exact location of faults within transformer windings is a difficult task in many practical cases. Thus, the present paper aims at classifying different impulse faults in several sections
1070-9878/1/$17.00 0 2002 IEEE
Purkait and Chakravorti: Paltern Classification of Impulse Faults in Transformers by Wavelet Analysis
556
along the length of the winding, instead of pinpointing the exact location of the fault with full confidence level. In this paper, results are reported on the use of wavelet analysis for the pattem recognition of winding current waveforms and classification of impulse faults therein. The study has been based on impulse faults simulated in EMTP models of a range of power transformers commonly used up to a voltage rating of 33 kV.
.-v8
2 WAVELET ANALYSIS
'
2.1
SPECTRUM ANALYSIS AND TRANSFORMATIONS
Mathematical transformations are applied to signals to obtain detailed information from that signal that is not readily available in the raw signal. Most of the signals in practice, are time-domain signals in their raw format. This time-amplitude representation is not always the best representation of the signal for most signal processing related applications. In many cases, distinguished informations are hidden in the frequency content of the signal. The frequency spectrum of a signal shows what frequencies exist in the signal. There are many transforms such as Fourier transform, Hilbert transform, short-time Fourier transform, Wigner distributions, that are used quite often by engineers and mathematicians. I
2.2 TIME-FREQUENCY REPRESENTATIONAND THE WAVELET TRANSFORM Although the Fourier transform is probably the most popular of the transforms being used, it only reveals the magnitude of each frequency component in the signal, but it does not indicate the time instants when these frequency components exist. This information is not required when the signal is so-called stationary. However, if it is necessary to know what spectral component[s] occur at what time instant, the Fourier transform will not he of any help. The problem of time localization of frequency components in FT ' can he solved to a large extent by using short-time Fourier transform (STFT) which applies windows in transforming the input signal. But it does not provide multiple resolutions in time and frequency as the window size is fixed. The wavelet transform [21-231 provides an alternative mode of time-frequency representation. Wavelet transform is capable of providing the time and frequency information simultaneously, hence giving a time-frequency representation of the signal.
2.3 CONTINUOUS WAVELET TRANSFORM (CWT) The continuous wavelet transform (CWT) was developed as an alternative approach to the short time Fourier
c
0.5
0
vs o a 2
0.5 -4
-2
0
2
4
Radian Figure 1. Marlet mother wavelet.
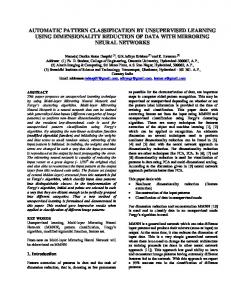
transforms to overcome the resolution problem. The wavelet analysis is done in a similar way to the STF'T analysis, in the sense that the signal is multiplied with a function, the wavelet, similar to the window function in the STFT, and the transform is computed separately for different segments of the time-domain signal. The most significant characteristic of the wavelet transform is that the width of the window is changed as the transform is computed for every single spectral component. It uses short time intervals for high frequency components and long intervals for low frequency components and thereby each frequency component gets treated in the same manner without any reinterpretation of the results. The continuous wavelet transform ( C W ) of the square integrable function f(t) with respect to a mother wavelet q(t) is defined as
where r and s are real and * denotes complex conjugation. Figure 1 shows Morlet mother wavelet, which is defined as
morl(t) = ~ e ~ ' ~ ~ . c o s ~ t
(2)
The constant C is used for normalization in view of reconstruction. As seen in (11, the transformed signal is a function of two variables, T and s, the translation and scale parameters, respectively. The term translation is used in the same sense as it was used in the STFT, it is related to the location of the window, as the window is shifted through the signal. This term, obviously, corresponds to time information in the wavelet transform domain. The scale parameter, which is related to the reciprocal of frequency, provides the information about the frequency contents of the
'
IEEE Ttansactions on Dielectrics and Electrical Insulation
Yo[. 9, No. 4; August 2002
557
Table la. Transformer data far EMPT model. T3 T5
Name
-
T
1428
L cg CS R
0.16
0.08 2.1 1.4
Svmbol
P V D
1206 0.11 9.0
1104 0.025 0.12 5.1
2.4
0.43
0.056
Table l b . Symbols for Table la. QuantiN Power rating Voltage Rating Numher of discs on the HV
Unit kVA kV
winding
Outer diameter of the HV winding Inncr diameter of the HV winding Number of turns in the HV winding Total inductance pcr disc Ground capacitance per disc Series capacitance pcr disc Resistance Der disc
OD ID T
L cg
*n
Fi ing.
CS
2. Equivalent lumped parameter network of the HV
1
d-
signal. Scaling, as a mathematical operation, either dilates or compresses a signal. Larger scales correspond to dilated (or stretched out) signals and small scales correspond to compressed signals.
3 TRANSFORMER MODELS Electromagnetic Transient program (EMTP) based high frequency models 124-251 of a range of transformers commonly used up to 33 kV have been developed for the present study. The power ratings of the three transformers modeled are 3, 5 and 7 MVA, which have been denoted by T3, T5 and T7, respectively throughout this paper. In all the EMTP models, the delta-connected disc winding of the HV sides of all the three transformers have been represented hy a network with lumped parameters as shown in Figure 2. These parameters have been calculated from the practical design data of the three different transformers and are summarized in Table 1. Depending upon the values of Cg, Cs,and L , each of the transformers are found to have their own natural frequencies of oscillation that largely characterizes their impulse responses.
3.1
TYPES OF FAULT
Insulation failures may result in two classes of winding faults in a transformer during impulse tests, namely series and shunt faults. A series fault implies insulation failure betweemthe discs or between the turns, while a shunt fault
R
mm
mm
mH PF PF Ohm
represents insulation failure between the winding and earthed components like tank, core etc. Both these classes of faults may occur anywhere along the entire length of the winding. In the present study, the entire winding has been divided into three sections, namely the line-end, the mid-winding and the earth-end sections, each involving 33.3% of the total length of the winding. In the 3 MVA transformer, consisting of a total number of 89 discs, lineend thus involves disc number 1 to 30, mid-winding section spans from disc 31 to 60 and the remaining discs 61 to 89 are considered as the earth-end section. Similarly in the 5 MVA transformer, having 67 discs in total, the lineend, mid-winding and the earth-send sections consist of discs 1 to 22, 23 to 44 and 45 to 67, respectively. Likewise, the 69 discs of the 7MVA transformer are divided into three equal sections, each having 23 discs. The acronyms used for different types of faults considered in this study are given in Table 2. In each of the sections faults have been simulated in three different locations. Table 3 provides the exact location of the different faults simulated in Table 2. Types of different faults simulated. Acronyms Faults NF SEL
SEM SEE SHL SHM SHE
No-Fault Series Fault at Line-End Series Fault at Mid-Winding Series Fault at Earth-End Shunt Fault at Line-End Shunt Fault at Mid-Winding Shunt Fault at Earth-End
Purkait and Chakrauorti: Pattern Class@,cation of Impulse Faults in Transformers by Wavelet Analysis
558
Table 3. Locations of different faults simulated
Disc involved Fault SEL ~~
2 3
3MVA 1-4 14-17 21-24 31-34 38-41 47-50
SMVA 5-8 12-15 19-22 30-33 36-39 42-45
7MVA 8-1 1 15-lS 19-22 27-30 35-38 41-44
1 2 3
60-63 71-74 79-82
47-50 53-56 59-62
47-50 52-55 58-61
1
2-5 12-15 19-22
7-10 13-16 20-23
6-9 13-16 20-23
3
36-39 45-48 51-54
28-31 36-39 42-45
30-33 37-40 41-44
1 2 3
65-68 70-73 81-84
50-53 58-61 62-65
28-51 54-57 61-64
Location 1
2 3 SEM
SEE
SHL
I
2 3 SHM
1
2 SHE
0.5
1
Time (p)
1.5
I
2
2.5
x lo'
Figure 3. Time-domain current waveform of series fault at earth-
end section of 5 MVA transformer.
the three sections along the length of the winding for all the three transformers. The fault locations have been selected in a random manner, such that they can properly represent the entire span of each of the three sections of the winding. Each fault has been made to involve 5% to 10% of the winding length. Figure 3 shows a sample plot of the transformer winding current obtained by the tankcurrent method corresponding to a no-fault condition and also for SEE at BIL in the 5 MVA transformer. Figure 4 shows similar plots for SHM in the same transformer. All the winding currents considered in this paper have heen calculated on the basis of an incident lightning impulse wave of standard 1.2/50 ys waveshape.
4
as
Figure 4.
I
2
1.5
I 21
Time (ps) "d Time-domain current waveform of shunt fault at mid-
winding section of SMVA transformer.
frequency'analysis of non-stationary signals indicates the time instants at which different frequency components of the signal are present. The winding current waveform containing 1000 sampling points for a time-span of 250 ps was convoluted with the Morlet mother wavelet. The results are plotted in a 3-D surface plot such that the x-axis represents the translation, the y-axis represents the scale, and the contour (z-axis) represents the obtained wavelet 'transform coefficients. Figures 5 and 6 represent the 3-D surface plots obtained from wavelet transform of time-domain BIL current waves of Figures 3 and 4 respectively. Figures 5 and 6 show that contour plots exhibit significant differences for different types of fault occurring within the transformer winding. For classification of such distinctive patterns, relevant parameters were extracted from the wavelet transformed 3-D contours. In this paper, three parameters have been considered viz. the most predominant frequency component, its time of occurrence and the corresponding wavelet coefficient. The most predominant frequency component is calculated as that frequency component which has the highest wavelet transform coefficient among all the translations considered. . .....,.
WAVELET APPLICATION .FOR FAULT CLASSIFICATION
It has been established that any non-stationary signal can he analyzed with the wavelet transforms. Time-
T""dliW
Figure 5. 3-D surface plot of the CWT of the BIL current
form of Figure 3.
wave-
IEEE Transoctions on Dielectrics and Electrical Insulation
Val. 9, No. 4; August 2002
559
. . . ................. . . . . . ...': . .
TSadlllO"
Figure 6. 3-D surface plot of the CWT of the BIL currcnt wave. form df Figure 4. T r a n s l a t i o n (per.unil)
5
RESULTS AND DISCUSSION
The three pattern classification parameters as mentioned in the earlier section are calculated for both series and shunt faults as given in Table 3 for all the three transformers. Figure 7 represents the 3-D scatter plots for these parameters for the 7 MVA transformer. The parameters used for the plots are in per-unit scale i.e. the parameters corresponding to CWT of any BIL current wave is divided by the corresponding parameter obtained from CWT of the no-fault current wave for the same transformer. A close look at Figure 7 reveals that the three shunt faults namely SHL, SHM and SHE form distinct clusters and they can be easily classified separately. The clusters of the series faults, SEL, SEM and SEE in Figure 7 are found to lie too close to be properly distinguished. It is evident that separate scales need to he used for shunt and series fault clusters in order to achieve better clarity in classification.
Scale (perunit)
Translation (perunit) Figure 7. 3-D scatter plot of parameters used far pattern classification of all kinds of faultd in 7 MVA transformer,
Figure 8. 3-D scatter plot of parameters used for pattern classification of series faults in all the three transfomcrs.
Figure 8 thus, represents the 3-D scatter plot of the parameters of fault classification corresponding to series faults only for all the three transformers. Depending upon their individual circuit parameter values as given in Table 1, each transformer is found to form its own clusters characterizing each type of fault. For instance. SEL for the 3 MVA transformer is found to have most predominant frequencies in the range of 1.33 to 1.36 MHz during 22.5 to 23.5 p s time duration. The corresponding ranges of predominant frequencies and time for SEL for the 5 and 7 MVA transformers are 2.2 to 2.3 MHz during 13.5 to 14 p s and 3.4 to 3.7 MHz during 8.5 to 9.0 ps, respectively. The ranges of predominant frequency, their amplitudes (coefficients) and time of occurrences for other types of fault in all the three transformers are summarized in Table 4. A better clarity in the clustering can be found in the 2-D scatter plot of Figure 9 where the CWT coefficients are plotted against the corresponding predominant scales for different types of series fault in the three transformers. The separate clusters formed by the different types of series fault in the three transformers are clearly marked in Figure 9. In order to obtain a more precise time-frequency characterization of the different types of series faults, a 2-D scatter plot of translation vs. scale, extracted from the 3-D scatter plot is presented in Figure 10. Figure 10, thus supports the different clusters formed in Figure 9 in a more distinctive manner. Figures 9 and 10 show that SEL, SEM and SEE faults form distinctly different clusters in each of the transformers. In both Figures 9 and 10, shunt faults have been omitted, since the clusters formed by the different shunt faults are easily distinguishable, as shown in Figure 7 and also because wider axis-limits are necessaly for clustering shunt faults.
Purkait and Chakravorti: Pattera Classification of Impulse Faults in Transformers by Wavelet Analysis
560
Table 4. Time-frequency characterization of fault currents in transformers. Time Predominant Range Freq. Range Coeff. Fault Transf. ( ILS) (MHz) (per-unit) 25.75 15.75 10.75
1.194 2 3.2
1
22.5-23.5 . 13.5-14.0 8.5-9.0
1.33-1.36 2.2-2.3 3.4-3.7
0.93-0.95 0.78-0.82 0.88-0.89
24.0-24.5 14.5-15.0 9.0-10.0
1.27-1.32 2.1-2.2 3.4-3.5
0.95-0.97 0.85-0.9 0.92-0.95
25.0-25.5 15.0-15.5 10.0-10.5
1.2-1.25 2.0-2.1 3.2-3.34
0.95-1.0 0.93-0.97 0.95-0.99
15.5-16.5 9.5-10.0 6.0-6.5
0.8
1.2-2.0 1.8-2.8 1.7-2.7
T3 T5
NF
T7 T3 ~5 T7 T3
SEL
SEM
T5
T7 T3 T5 T7 T3 T5
SEE
SHL
T7 T3 T5
SHM
~
19.5-20.5 12.5-13.5 7.0 8.0
T5 T7
1
1.3 1.6 2.5-3.0 3.4-4.3 4.5-5.75 1.6-1.8 3.5-4.5 4.2 -4.5
17.5-19.0 11.0-12.0 7.0 7.5
T7 T3
SHE
1
~
6 CONCLUSIONS
T
HE nature of winding currents in transformers corresponds to the type and location of impulse faults.
Wavelet analyses of such complex current waveforms have been reported in this paper for classification of shunt as well as series type of impulse faults in transformers. Studies have been carried out using results obtained from EMTP model of three transformers. 3-D as well as 2-D scatter plots using appropriate classification parameters show that different types of fault in a transformer form clcarly delimited separate clusters. Hence, it may be stated that pattern classification of impulse faults in transformers can be done successfully using wavelet analysis.
REFERENCES
0.5-0.6 0.5-0.6 0.51-0.65 0.79-0.83 0.65-0.75 0.77-0.9
[ l ] Power TrmJfomer- Insulation Leu& and Dielectric Tests, IEC Publication 76-3, 1980. I21 Guide to the Lightning and Switching Impulse Testing of Power
Tramfomms end Reactors, IEC Standard, Publication 722, 1982. 131 F. Beldi. "The Impulse Testing of Transformers", Thc Brown Boveri Review, Vol. 37, pp. 179-193, 1950. [4] J. H. Hagenguth, and J. R. Meador, ''Impulse Testing of Power Transformers", AIEE Trans., Vol. 71, pp. 697-704, 1952.
151 C. Aicher, "Experience With Transformer Impulse Failure De. tectian Methods".AIEE Trans., Vol. 67, pp. 1621-1631, 1948. 161 G. B. Harper, "Detection and Diagnosis of Deterioration and Faults in Power Transformers", CIGRE, paper 12.01, pp. 19-25, 1967. [7] R. Malewski and B. Poulin, "Impulse Testing of Power Transformers Using the Transfer Function Method", IEEE Trans. Power Delivery, VoI. 3, pp. 476-490, 1985. 181 I. Bak-Jensen, B. Bak-Jensen, and S. D. Mikkclscn. "Detection
ae
I 0 1
I a9
1
I
052
0%
of Faults and Aging Phcnomena in Transformers by Transfer Functions", IEEE Trans. Power DeliGery, Vol. 10, pp. 308-314, 1995.
I
OS5
053
I
rm
Scawpnrn,
Figure 9. 2-D scatter plot of scale (pu) YS coefficient (pu) cone sponding to series faults for all the three transformers.
[9] R. Vajana and K. Udayakumar, "Fault Location in Power Transformers During Impulse Tcsts", Prac. 2000 IEEE PES Winter Meeting, papcr no. 15-01-06. 1101 P. Purkait and S. Chakravorti, "An Expert System for Fault Diagnosis in Transformers During Impulse Tests",Prac. 2000 IEEE PES Winter Meeting, paper No. 15-0-03.
[Ill M. A. Sanz-Bobi, A. Garcia-Cerrada, J. Rolan, and A. Luengo, "TRAFES: An Expcrt System far Diagnosis of Power Transformers",Prac. of CIGRE symposium, Berlin, paper No. 110-20, pp. 1-6, 1993. [121 C. E. Lin, J. M. Ling, and C. L. Huang, "An Expcrt System for Transformer Fault Diagnosis Using Dissolved Gas Analysis", IEEE Trans. Power Dclivery, Vol. 8. pp. 231-238, 1993. L131 Z . Wang, Y . Liu, and P. 1. Griffin, "A Combined A" and
Expert System Tool for Transformer Fault Diagnosis", IEEE Trans. Power Delivery, Vol. 13, pp. 1224-1229, 1998. 1141 S. Mallat and W. L. Hwang, "Singularity Detection and Procearing with Wavelets", IEEE Trans. Information Theory, Vol. 38, pp. 617-643, 1992. 0 75
08
085
09
095
t
Tarslaim(pehnil1
Figure 10. 2-D scatter plot of translation (pu) YS scale (pu) conespanding 10 series faults for all the three transformers.
1151 H. T. Yang and C. C. Liao, "A De-noising Scheme for Enhancing Wavelet-Based Power Quality Monitoring System", IEEE Trans. Power Delivery, Vol. 16, pp. 353-360, 2001.
IEEE Transactions on Dielectrics and Electrical Insulation
Vol. 9, No. 4; August 2002
[I61 M. Lenr. K. Feser. and G. B. Gharchpetian, "Detection and Localization of Short Circuits in Transformer Windings Based on Wavelet Analysis", Proc. 12th International Symposium on High Voltage Engineering, Vol. 4, paper No. 6-20, pp. 876-879, 2001. [I71 S. K. Pandey and L. Satish, "Mulliresolution Signal Decomposition: A New Tool for Fault Detection in Power Transformers During Impulse Tests", IEEE Trans. Power Delivery, Vol. 13, pp. 1194-1200, 1998. [IS] B. P. Singh; A. Bhoomaiah, and R. K. Tiwari, "Interturn Fault Detection in Power Transformer Using Wavelet Technique", Proc. 12th International Symposium on High Voltage Engineering, Vol. 4, paper No. 6-24, pp. 896-899, 2001. [191 L. Satish, "Short Time Fourier and Wavelet Transform far Fault Dctection in Power Transformer During Impulse Tests", IEEE Proc., Vol. 145, pp. 77-84, 1998. [201 P. Kang and D. Birtwhistle, "Condition Assessment of Power Transformer on-load Tap Changers Using Wavelet Analysis", IEEE Trans. Power Delivery, Vol. 16, pp. 394-400, 2001.
[?I] I. Dauhechies, "The Wavslet Transform, Timc-Frequency Localkation and Signal Analysis", IEEE Trans. Information Theory, vai. 36, pp. 961-1005.1990.
R . Polikar: The wavelet .177.1 , http://www.public.iastate. ~~
561
tutorial IOnlinel. Available: edu/-rpolikar/WAVELETS
/Wtutarial.html. [231 S. Mallat, A waueler row of signal processing, Academic Press, 1998. [24] F. de. Lean and A. Semlyen, "Complete Transformer Model for Electromagnctic Transients", IEEE Trans. Power Delivery, Val. 9, pp. 231-239, 1994. [25] G. B. Gharehpctian, H. Mohaeni, and K. Moller, "Hybrid Madelling of Inhomogcneous Transformer Winding fur Very Fast Transient Ovewoltagc Studics", IEEE Trans. Power Dclivery, Vol. 13, pp. 157-163, 1998.