1588
IEEE TRANSACTIONS ON POWER DELIVERY, VOL. 18, NO. 4, OCTOBER 2003
Wavelet Transform-Based Impulse Fault Pattern Recognition in Distribution Transformers P. Purkait, Member, IEEE, and S. Chakravorti, Senior Member, IEEE
TABLE I TRANSFORMER DATA FOR EMTP MODEL
Abstract—This letter presents a novel approach using the wavelet transform to classify the patterns inherent in different fault currents during impulse testing of distribution transformers. Results for simulated models of a range of distribution transformers are presented to illustrate the ability of this approach to classify insulation failures under impulse stresses. Index Terms—Distribution transformer, impulse fault simulation, pattern recognition, wavelet transform.
TABLE II DIFFERENT FAULTS SIMULATED
I. INTRODUCTION
O
NE of the standard tests carried out on a transformer is the lightning impulse test after assembly, for assessment of the ability of its winding insulation to withstand the surge voltage. Conventional fault diagnosis methods include study of the winding voltage and currents in time and frequency domains [1]. The nonstationary winding current signals (i.e., signals whose frequency varies with time), can be analyzed in the time-frequency domain using wavelet transforms such that it is possible to precisely locate in time all sudden variations in the signal. This letter presents simulation results of an entirely new approach, based on the time-frequency analysis of the signals for classification of impulse faults from winding current waveforms. The study has been based on impulse faults simulated in electromagnetic transient program (EMTP) models of a range of distribution transformers. II. WAVELET ANALYSIS The Fourier transform (FT), though being widely used for obtaining the frequency spectrum of a signal, only reveals the magnitude of each frequency component in the signal. On the other hand, wavelet transform [2] can depict what spectral component[s] occurs at what time instant. Wavelet transform is capable of providing the time and frequency information simultaneously; hence, giving a time-frequency representation of the signal. The continuous wavelet transform (CWT) of the square intewith respect to the mother wavelet is grable function defined as (1) As seen in (1), the transformed signal is a function of two and translation and parameters which variables, the scale Manuscript received March 30, 2003. P. Purkait is with the School of ITEE, University of Queensland, Qld-4072, Australia (e-mail:
[email protected]). S. Chakravorti is with the Department of Electrical Engineering, Jadavpur University, Kolkata 700032, India (e-mail:
[email protected]). Digital Object Identifier 10.1109/TPWRD.2003.817845
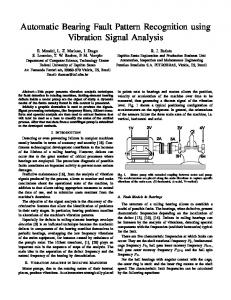
are related to the frequency content and the corresponding times in the wavelet transform domain, respectively. III. SIMULATION EMTP-based high-frequency models of a range of distribution transformers, as summarized in Table I, have been developed for the present study. In all of the EMTP models, the delta-connected disc winding of the HV sides of all the three transformers has been represented by a network with lumped parameters [3]. In the present simulation work, the transformer windings were subjected to lightning impulses of standard 1.2/50 wave shapes. A. Types of Fault Insulation failures during impulse tests may occur between the discs/turns (series fault) or between the winding and earthed components like tank, core, etc. (shunt fault). In the present study, the entire winding has been divided into three sections—namely the line-end, the mid-winding, and the earth-end sections—each involving 33.33% of the total length of the winding and the different faults are simulated as shown in Table II. Due to an inadequate number of discs in the range of distribution transformers considered, the study thus has been limited to classification of shunts faults at different sections of the winding and series faults as a whole. Fig. 1 shows a sample plot of the transformer winding current obtained by the capacitively transferred tank-current method. IV. WAVELET APPLICATION FOR FAULT CLASSIFICATION The winding current waveforms were convoluted with the Morlet mother wavelet to obtain the wavelet transform. Fig. 2 represents the three-dimensional (3-D) surface plots obtained
0885-8977/03$17.00 © 2003 IEEE
IEEE TRANSACTIONS ON POWER DELIVERY, VOL. 18, NO. 4, OCTOBER 2003
1589
Fig. 3. 3-D scatter plot of parameters used for pattern classification of all kinds of faults in all of the five transformers. Fig. 1.
Time-domain current waveform of SHM in 300-kVA transformer.
Fig. 4. 2-D scatter plot of time (per-unit) versus frequency (per-unit) corresponding to different faults for all of the five transformers. Fig. 2. 3-D surface plot of the CWT of the BIL current waveform of Fig. 1.
from wavelet transform of time-domain BIL current wave of Fig. 1. For classification of the different fault current waveform patterns, relevant parameters were extracted from the wavelet transformed 3-D contours. In this letter, three parameters have been considered viz. the most predominant frequency component, its time of occurrence, and the corresponding wavelet coefficient. The most predominant frequency component is calculated from the scale which has the highest wavelet transform coefficient among all the translations considered. V. RESULTS AND DISCUSSION The three pattern classification parameters as mentioned above are calculated for all the five transformers. Fig. 3 represents the 3-D scatter plots for these parameters in per-unit scale for the transformers. A close look at Fig. 3 reveals that the three different faults corresponding to all of the five transformers form distinct clusters. It is evident from the clusters of the 3-D scatter plot, that the different faults have definite pattern of values of the three fault classification parameters. In order to obtain a more precise time-frequency characterization of the different types of faults, a two-dimensional (2-D) scatter plot of predominant frequency versus the corresponding times in
per-unit basis, extracted from the 3-D scatter plot is presented in Fig. 4. The different clusters thus formed by the different parameters corresponding to all of the transformers are marked distinctively in Fig. 4. VI. CONCLUSION The present letter demonstrates a novel technique based on wavelet analyzes for classification of complex current waveforms arising due to shunt as well as series type of impulse faults in distribution transformers. 3-D as well as 2-D scatter plots using appropriate classification parameters show that different types of fault in the transformers form clearly delimited separate clusters. These preliminary simulation results presented highlight the applicability of the proposed method over conventional methods as a possible future tool for impulse fault pattern analysis. REFERENCES [1] P. Purkait and S. Chakravorti, “Time and frequency domain analyzes based expert system for impulse fault diagnosis in transformers,” IEEE Trans. Dielect. Elect. Insulation, vol. 9, pp. 433–445, June 2002. [2] I. Daubechies, “The wavelet transform, time-frequency localization and signal analysis,” IEEE Trans. Inform. Theory, vol. 36, no. 5, pp. 961–1005, Sept. 1990. [3] F. de Leon and A. Semlyen, “Complete transformer model for electromagnetic transients,” IEEE Trans. Power Delivery, vol. 9, pp. 231–239, Jan. 1994.