Calicut Medical Journal 2006;4(3):e1. Page 1 (Page number not for indexing
purposes). Research. Pattern Classification using imaging techniques for Infarct ...
Kesavamurthy et al Calicut Medical Journal 2006;4(3):e1
Research
Pattern Classification using imaging techniques for Infarct and Hemorrhage1 Identification in the Human Brain 2 T Kesavamurthy
S SubhaRani
1
Rsearch Scholar ECE Dept., PSG Tech –
[email protected], 2.Asst., Professor – ECE Dept., PSG Tech –
[email protected]
ABSTRACT Medical Image analysis and processing has great significance in the field of medicine, especially in Noninvasive treatment and clinical study. Medical imaging techniques and analysis tools enable the Doctors and Radiologists to arrive at a specific diagnosis. Medical Image Processing has emerged as one of the most important tools to identify as well as diagnose various disorders. Imaging helps the Doctors to visualize and analyze the image for understanding of abnormalities in internal structures. The medical images data obtained from Bio-medical Devices which use imaging techniques like Computed Tomography (CT), Magnetic Resonance Imaging (MRI) and Mammogram, which indicates the presence or absence of the lesion along with the patient history, is an important factor in the diagnosis. The algorithm proposes the use of Digital Image processing tools for the identification of Hemorrhage and Infarct in the human brain, by using a semi-automatic seeded region growing algorithm for the processing of the clinical images. The algorithm has been extended to the Real-Time Data of CT brain images and uses an intensity-based growing technique to identify the infarct and hemorrhage affected area, of the brain. The objective of this paper is to propose a seeded region growing algorithm to assist the Radiologists in identifying the Hemorrhage and Infarct in the human brain and to arrive at a decision faster and accurate. Keywords: Biomedical image processing, Hemorrhage, Infarct, CT, MRI, Mammogram and lesion
The algorithm and methodology that we propose will enable the easy and faultless identification of abnormalities present in the scanned region. This will allow for the further speeding of the diagnosis, also it will be of great help to the patients, neurophysicians and internees of radiology.
The human brain is the most complex of all the human organs and it is also the most prone to complex abnormalities. Even though the data available is plentiful the sheer variety of the problems in terms of seriousness and location poses an exacting task [3]. Hence we have decided to concentrate the implementation and testing of our algorithm to the brain, as a successful implementation here would give the necessary credentials for success in other regions. Spontaneous brain hemorrhage accounts for about 10% of all strokes and is fatal in about 50% of the cases. [7]. Hypertension accounts for about half of these hemorrhages; the rest are due to tumors, aneurysms and vascular malformations, inflammatory and degenerative vasculopathies and hematologic and iatrogenic disorders of coagulation. In some patients no cause is ever found [8]. Hypertensive brain hemorrhage occurs in the deep gray nuclei of the hemispheres, the cerebellum, and the pones and results in specific clinical syndromes depending on the location. Computerized tomography has revolutionized the diagnosis of brain hemorrhage and Infarction resulting in the development of rational criteria for medical and surgical management of these lesions. The proposed seeded Region Growing algorithm was chosen for a multitude of reasons, such as its usage of pixel intensity and its sensitivity to thresholds for diagnosis of brain hemorrhage and Infarction
INTRODUCTION
CLINICAL INFORMATION PROCESS
The importance of medical imaging cannot be emphasized enough in this era of ever increasing speed of computation algorithm and it has brought importance to develop systems that can processes and generate very accurate results very fast. The various scanning techniques have incarnated as an inevitable tool for the doctors to help them in diagnosis [2]. While these are almost always error free and quick in their operation, they require a competent Radiologist for the proper interpretation of the images generated.
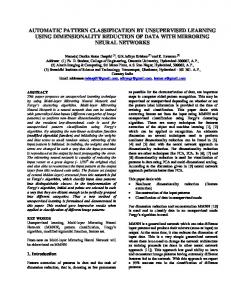
Most of the leading Hospitals and Scan Centers have highly sophisticated medical Imaging Systems for clinical diagnosis. The Radiology department and scan center takes on the references of other experts and physicians for diagnosis. The arrow diagram shown in fig.1 will give a clear indication of the process followed in radiology department and scan center.
Page 1 (Page number not for indexing purposes)
Kesavamurthy et al Calicut Medical Journal 2006;4(3):e1 •
C.T. Scan
M.R.I.
C.T. Image processor
M.R.I. Image
Allow the creation of diagnostic information data bases that can be interrogated by a wide variety of devices distributed geographically. DICOM is applicable to a networked environment. It supports operation in a networked environment using the industry standard networking protocol TCP/IP. REGION BASED IMAGE SEGMENTATION
Ultrasound
Ultrasound Image
Mammograp
Mammogram and data
Patient Data and I.D. are
In complex cases more Reference doctor and type of scanning needed, is determined.
A region-based method usually proceeds as follows: the image is partitioned into connected regions by grouping neighboring pixels of similar intensity levels [3], [4]. Adjacent regions are then merged by involving homogeneity or sharpness of region boundaries. Let R represent the entire image region. Segmentation maybe viewed as a process that partitions R into ‘n’ sub regions, R1, R2... Rn, such that
Diagnosis by Preparation of
Radiologist.
n
a)
case report.
film of images.
to the patient. Recent or unique cases are stored in the respective database.
i
=R
i =1
Preparation of The report and the images are delivered
UR
Images given on a Compact Disc.
b) Ri is a connected region, i = 1, 2, …, n c)
Ri ∩ Rj = 0 for all i and j, i not equal to j
d) P(Ri) = TRUE for i = 1, 2, …, n e)
P(Ri
U Rj) = FALSE for i not equal to j
Fig. 1 Flow of Operations followed in the Clinical Scanning Procedure
B DICOM IMAGE STANDARD With the introduction of computed tomography (CT) followed by other digital diagnostic imaging modalities in the 1970's, and the increasing use of computers in clinical applications , and the National Electrical Manufacturers Association (NEMA) recognized the emerging need for a standard method for transferring images and associated information between devices manufactured by various vendors [10]. These devices produce a variety of digital image formats and hence it was difficult to distribute and share information provided by various sources. The Digital Imaging and Communications for Medicine (DICOM) standard was created by the National Electrical Manufacturers Association (NEMA) to aid the distribution and viewing of medical images, such as CT scans, MRI, and ultrasound directly to the computer system [11].
The DICOM format facilitates the following • •
Promote communication of digital image information, regardless of device manufacturer Facilitate the development and expansion of picture archiving and communication systems (PACS) that can also interface with other systems of hospital information
Page 2 (Page number not for indexing purposes)
Where P (Ri) is a logical predicate over the points in set Ri and Φ is the null set The above axioms should satisfy the following conditions when seeded region growing method takes position in medical image a) indicates that the segmentation must be complete; that is every pixel must be in a region. b) Condition requires that points in a region must be connected. c) Indicates that the regions must be disjoint. Condition d) Deals with the properties that must be satisfied by the pixels in a segmented region, for example P (Ri) = TRUE if all pixels in Ri have the same intensity. e) Condition indicates that regions Ri and Rj are different in the sense of the predicate P. ALGORITHM Seeded Region Growing Method Region growing is a procedure that groups pixels or sub regions into larger regions. The simplest of these approaches is pixel aggregation, which starts with a set of seed points and from these grows regions by appending to each seed point those neighboring pixels that have similar properties such as gray level, texture, colour. In initial set of small areas is iteratively merged according to similarity constraints. Start by choosing an arbitrary seed pixel and compare it with neighboring pixels. Region is grown from the seed pixel by adding in neighboring pixels that are similar,
Kesavamurthy et al Calicut Medical Journal 2006;4(3):e1 increasing the size of the region [1]. When the growth of one region stops we simply choose another seed pixel which does not yet belong to any region and start again. This whole process is continued until all pixels belong to some region. The above process can be illustrated in the following images. Selecting a set of one or more starting points often can be based on the nature of the problem. When a priori information is not available one procedure is to compute at every pixel the same set of properties that ultimately will be used to assign pixels to regions during a growing process. If the result of these computations shows clusters of values, the pixels whose properties place them near the centroid of these clusters can be used as seeds. The selection of similarity criteria depends not only on the problem under consideration, but also on the type of image data available. When the images are gray scale, the region analysis must be carried out with a set of descriptors based on intensity levels and spatial properties [5], [6]. The connectivity (adjacency) information should be used in the region growing process. Grouping pixels with the same intensity level to form a region without paying attention to connectivity would yield a segmentation result that will give an erroneous idea. The stopping rule plays an important rule in the region growing algorithm. Growing a region should stop when no more pixels satisfy the criteria for inclusion in that region. Criteria such as intensity values, texture, and colour are local in nature and do not take into account the history of region growth. The use of these types of descriptors is based on the assumption that the model of expected results is at least partially available [9].
Pseudo Code 1. Let i= 0 2.
Choose a start region ri
3.
Define
ri + 1 = pi U ri , where pi
are the neighbors, ri
that fulfills the predicate P(pi) 4.
If
pi = ∅
, then end. Otherwise, let i= i+1 and GOTO
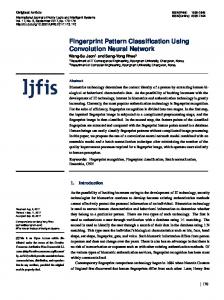
3. Flow Chart – The following fig 2 show the process of imaging system to identify the infarction and hemorrhage using seed region growing method.
Start
Obtain the CT image of the Human Brain
Fix the seeds on the possible area of the Hemorrhage
Store the Median Pixel Value of the selected Area
Implementation Functions DICOMINFO-Reads the metadata from the compliant DICOM file specified in the string FILENAME. DICOMREAD-Reads the image data from the compliant DICOM file FILENAME. The single-frame grayscale images are stored as M-by-N array. IMREAD (FILENAME, FMT)-Reads the image in FILENAME. The grayscale intensity image is stored as a two-dimensional array. FILENAME is a string that specifies the name of the graphics file, and FMT is a string that specifies the format of the file. The file must be in the current directory or in a directory on the MATLAB path. IMPIXEL - Returns the red, green, and blue color values of specified image pixels. IMPIXEL displays the input image and waits for the user to specify the pixels with the mouse. IMSHOW (I, N)-Displays the intensity image I with N discrete levels of gray. If the user omits N, IMSHOW uses 256 gray levels on 24-bit displays, or 64 gray levels.
Verify the neighbour pixels for the intensity (pi) within the Threshold (T= 10% p)
Fix a Seed Pixel (p); Make the other Pixel Values Zero.
Is p − T ≤ pi ≤ p + T
Make pi pixel value 1
Increment i by 1 Fig. 2 Flow Chart of Algorithm
Page 3 (Page number not for indexing purposes)
Stop
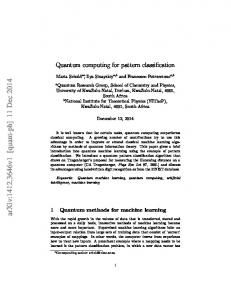
Kesavamurthy et al Calicut Medical Journal 2006;4(3):e1 RESULTS The Seeded region growing algorithm was implemented on CT Brain images of various patients with brain defects. The following images of Fig 3-a represent the Hemorrhage region in a brain and Fig 3- b represents the single seed image and (Fig c) show the seeded region after 200 iterations to show the significant area of hemorrhage. Patient 1 Age: 6 Sex: Male Impression: Hemorrhage in anterior high parietal region
Patient 3 Age: 59 Sex: Male Impression: Hemorrhagic Contusion in the Lt Posterior parietal region
Fig 5: (a, b, c, d)
Fig a: Brian Infarct Image
Fig 3: (a, b, c) Fig a: Original Image
Fig b: Threshold Data
Fig b: Single Seed Image
Fig c: Single Seed Image
Fig c: Cluster of Seeds after 200 iterations Patient 2 Age: 6 Sex: Male Impression: Cystic Lesion in the anterior high parietal region
Fig d: Cluster of Seeds after 450 iterations
Fig 4-(Fig a) represent the Infarct region in a brain and (Fig b) represents the single seed image and (Fig c) show the seeded region after 350 iterations to show the significant area of infarct. The above images enable doctor to take steps for further diagnosis very fast and accurate. Fig 5-(Fig a) represent the early stage of Infarct region in a brain and (Fig b) represents the single seed image and (Fig c) show the seeded region after 450 iterations to show the significant area of Infarction. From the above results and techniques the clinical diagnosis enables a doctor to identify the Infarction and Hemorrhage in the human brain at the accurate region in a brain in a very rapid manner. The advantage of our proposed method helps the patient to over come from the stroke in early stage.
Fig 4: (a, b, c) Fig a : Original Image
CONCLUSION Fig b: Single Seed Image
Fig c: Cluster of seeds after 350 iterations
Page 4 (Page number not for indexing purposes)
In this paper, we had extended the seeded region growing algorithm for the identification of hemorrhage and infarct in the human brain. Real-Time data were used for the implementation of the algorithm. The Real-Time data which were collected covers a spectrum of patients of different age group. The implementation, though semi-automatic can be of good use for the Radiologists and medical staff for easier and robust diagnosis.
Kesavamurthy et al Calicut Medical Journal 2006;4(3):e1 RECOMMENDATIONS The Algorithm for hemorrhage and infarct of the human brain proposed and implemented in this project is a stand-alone application of medical image processing. This can be extended with the help of Neural Networks and Fuzzy Logic. The Neural Network can be trained with a wide cross-section of normal human brain images spanning through different ages and gender. Fuzzy logic can be applied in introducing a level of tolerance. The network can be made to identify any discrepancies and learn from the data set that is provided to it. The learning will be supervised learning, where a teaching algorithm will assist the network in fine tuning the accuracy with which the hemorrhage or the infarct is detected.
ACKNOWLEDGEMENT We are extremely thankful to Dr Elango, Radiologist, Kovai Scan Center, for his kind help and guidance for facilitating to collect images. We are grateful to him for allowing us to utilize the facilities, resources and the infrastructure of his sophisticated scan center
REFERENCES [1] Andy Tsai, Anthony Yezzi, Jr., William Wells, Allan Wilsky, A Shape based approach to the Segmentation of Medical Imagery using Level Sets, IEEE Transactions on Medical Imaging., vol. 22, pp. 137-154, February 2003. [2] Rishi Rakesh, Probal Chaudhuri, C.A.Murthy, Thresholding in Edge Detection: A Statistical Approach, IEEE Transactions on Image Processing, vol.13, pp. 927-936, July 2004. [3] Cheng-Hung, Wen-Nung Lie, A Downstream Algorithm based on Extended Gradient Vector flow field for Object Segmentation, IEEE Transactions on Image Processing, vol. 13, pp. 1379-1392, October 2004. [4] Rafael. C. Gonzalez, Richard. E. Woods, Digital Image Processing, Addison Wesley, Massachusetts, 1999. [5] P.Reimer, Paul M. Parizel, Clinical CT Imaging: A Practical Approach, Springer, New York, 2004. [6] Paul Suetens, Fundamentals of Medical Imaging, Cambridge University Press, London, 2002. [7] Lippincott Raven, William E. Erkonen, Wilbur, Radiology: the Basics and Fundamentals of Imaging, Lippincott Williams & Wilkins, New York, 1998. [8] Division of Physiological Imaging, Department of Radiology, University of IOWA College of medicine: dpi.radiology .uiowa.edu / vida /image/ [9] Math works worldwide, Matlab Home, Image Processing Toolbox, Image Processing, analysis and algorithm development: http://www.mathworks.com/products/image [10] DICOM Standard, An Introduction to DICOM: http://www.psychology.nottingham.ac.uk/staff/cr1/dicom.htm [11] Digital Image Processing Lab, Division of Basic Radiological Sciences, Department of Radiology, University of Michigan Health System: http://www.dipl.rad.med.umich.edu
Page 5 (Page number not for indexing purposes)