RESEARCH ARTICLE
Patterns and Predictors of Language and Literacy Abilities 4-10 Years in the Longitudinal Study of Australian Children Stephen R. Zubrick*, Catherine L. Taylor, Daniel Christensen Telethon Kids Institute, University of Western Australia, Perth, Western Australia, Australia *
[email protected]
Abstract Aims OPEN ACCESS Citation: Zubrick SR, Taylor CL, Christensen D (2015) Patterns and Predictors of Language and Literacy Abilities 4-10 Years in the Longitudinal Study of Australian Children. PLoS ONE 10(9): e0135612. doi:10.1371/journal.pone.0135612 Editor: Emmanuel Manalo, Kyoto University, JAPAN Received: February 4, 2015 Accepted: July 24, 2015 Published: September 9, 2015 Copyright: © 2015 Zubrick et al. This is an open access article distributed under the terms of the Creative Commons Attribution License, which permits unrestricted use, distribution, and reproduction in any medium, provided the original author and source are credited. Data Availability Statement: All relevant data are from the Longitudinal Study of Australian Children study and are available from the Commonwealth of Australia Department of Families, Housing, Community Services and Indigenous Affairs (FaHCSIA). Please see the following URL for more information regarding data access: http://www. growingupinaustralia.gov.au/data/dataaccess.html. Funding: SZ and DC are supported by a grant from the Australian Research Council (CE140100027). Competing Interests: The authors have declared that no competing interests exist.
Oral language is the foundation of literacy. Naturally, policies and practices to promote children’s literacy begin in early childhood and have a strong focus on developing children’s oral language, especially for children with known risk factors for low language ability. The underlying assumption is that children’s progress along the oral to literate continuum is stable and predictable, such that low language ability foretells low literacy ability. This study investigated patterns and predictors of children’s oral language and literacy abilities at 4, 6, 8 and 10 years. The study sample comprised 2,316 to 2,792 children from the first nationally representative Longitudinal Study of Australian Children (LSAC). Six developmental patterns were observed, a stable middle-high pattern, a stable low pattern, an improving pattern, a declining pattern, a fluctuating low pattern, and a fluctuating middle-high pattern. Most children (69%) fit a stable middle-high pattern. By contrast, less than 1% of children fit a stable low pattern. These results challenged the view that children’s progress along the oral to literate continuum is stable and predictable.
Findings Multivariate logistic regression was used to investigate risks for low literacy ability at 10 years and sensitivity-specificity analysis was used to examine the predictive utility of the multivariate model. Predictors were modelled as risk variables with the lowest level of risk as the reference category. In the multivariate model, substantial risks for low literacy ability at 10 years, in order of descending magnitude, were: low school readiness, Aboriginal and/ or Torres Strait Islander status and low language ability at 8 years. Moderate risks were high temperamental reactivity, low language ability at 4 years, and low language ability at 6 years. The following risk factors were not statistically significant in the multivariate model: Low maternal consistency, low family income, health care card, child not read to at home, maternal smoking, maternal education, family structure, temperamental persistence, and socio-economic area disadvantage. The results of the sensitivity-specificity analysis
PLOS ONE | DOI:10.1371/journal.pone.0135612 September 9, 2015
1 / 29
Patterns and Predictors of Language and Literacy Abilities 4-10 Years
showed that a well-fitted multivariate model featuring risks of substantive magnitude did not do particularly well in predicting low literacy ability at 10 years.
Introduction Children’s language development builds the foundation for literacy, educational achievement and employment [1, 2]. Literacy is recognised as a human right and a means for achieving other human rights. The benefits that literacy confers on individuals, families, communities and nations are human, social, economic, cultural and political [3]. Speaking and listening are developmental prerequisites for reading, writing and spelling. This relationship entails dynamic complementarity and self-productivity which produce multiplier effects whereby language enables literacy and in turn, literacy enables language. This is especially true for vocabulary where in the beginning stages of reading, children rely heavily on their vocabulary knowledge to understand what they read, and once proficient, acquire new vocabulary through reading [4, 5]. Vocabulary knowledge is a strong predictor of reading comprehension [6] and poor vocabulary knowledge is associated with low literacy achievement [7]. Population based prospective longitudinal studies have documented the enduring association between low language ability in the preschool years and low literacy in childhood and adulthood [1, 8–10]. Improving language and literacy standards is an important global [11] and national goal [12]. There is unanimous agreement that the policy focus must begin early in childhood, before the start of formal school and formal reading instruction [10, 13, 14]. In the preschool years there is a strong focus on developing children’s oral language abilities, especially for children with known risk factors for low language ability. The predominant theory about reading, “The Simple View of Reading,” was first advanced by Gough and Tunmer [15] and is prominent in early childhood education policies and pedagogies [10]. This early view breaks down reading into two dimensions, decoding the alphabetic system, which requires code-related abilities, and, understanding the written word, which requires oral language abilities. Code-related abilities include knowledge of letter names and letter sounds, phonological awareness and writing. Oral language abilities include vocabulary, grammar and listening comprehension[16]. These components of oral language are interdependent but vocabulary is considered to be the “lynchpin”. The association between children’s vocabulary and literacy abilities is most closely associated at the beginning stages of learning to read, yet it is still evident years later in adulthood [1, 8–10]. Effective early language and literacy intervention promotes children’s code-related and oral language abilities [16]. Decoding and comprehension are both necessary for proficient reading. Poor readers can be deficient in both decoding and comprehension or in only one component of reading. Some poor readers have strong decoding ability and poor comprehension while others have poor decoding ability and strong comprehension [17]. Most longitudinal studies of literacy outcomes for children and adults with a history of low language ability have been designed to quantify the persistence of low abilities over time [3, 18, 19]. There has been an understandable interest in the developmental pathways that lead towards low language ability. A consequence of this focus has been the relative neglect of the question of instability or change in language ability over time—the extent of this, and, its implications for developmental research and practise. On close inspection, it is possible to find studies of evidence of change of literacy ability over time. An early study of Phillips et al [20] noted marked variability and associated poor
PLOS ONE | DOI:10.1371/journal.pone.0135612 September 9, 2015
2 / 29
Patterns and Predictors of Language and Literacy Abilities 4-10 Years
prediction in reading and academic performances of children in Year 1 to Year 6 of school. Catts et al [7] in a population based study of reading outcomes for children aged 5–6 years with specific language impairment estimated 42% of these children had a reading impairment in first grade yet 58% did not. Notably, 9% of children with typical language development went on to have reading impairment in first grade. The prevalence of reading impairment in the children with language impairment decreased from 42% to 36% in fourth grade, evidence of changing developmental status over time for some children. Additionally, 30% of the children with specific language impairment had reading impairment in one grade but not the other. Certainly the common view is that children progressively acquire and stabilise skills in the early childhood epoch. But the Catts et al. findings, point towards more instability in literacy performances than might be expected in children over time. These observations of instability in the emergence and establishment of literacy have a parallel in recent studies of early vocabulary acquisition. Taylor et al. [21] and Christensen et al [22] documented vocabulary growth trajectories and modelled multivariate predictors of vocabulary performance in a large-sample population longitudinal study of 4 to 8 year olds. They documented both marked variability in initial vocabulary levels and in onward growth with resultant poor positive prediction of those 4 year old children who would go on at age 8 to have low vocabulary. Of 1,083 children predicted to have low vocabulary at age 8, only 279 (25.8%) actually had low vocabulary. The strongest predictor of low receptive vocabulary at age 8 was low receptive vocabulary at age 4. However, receptive vocabulary was nonetheless a limited predictor of persistently low receptive vocabulary despite its moderate odds ratio with vocabulary ability at 8. Given the documented association between early vocabulary development and subsequent reading ability we investigate here the onward strength of this association and its predictive utility. Specifically we investigate the uncertainty about the early developmental variability in onward language and literacy and whether this reduces and converges as children age and acquire skills. To do this we use a large representative sample of Australian children to estimate the longitudinal predictive relationship between vocabulary status at ages 4, 6 and 8 years and onward literacy performance at age 10. We focus on three questions: 1) What are the patterns of stability and change in children’s progression from early vocabulary development to their onward literacy; 2) what are the predictors of this progression, and; 3) what is the predictive utility of this relationship?
Methods Ethics statement The Longitudinal Study of Australian Children (LSAC) is conducted in a partnership between the Department of Social Services (DSS), the Australian Institute of Family Studies (AIFS) and the Australian Bureau of Statistics (ABS). The study has ethics approval from the Australian Institute of Family Studies Ethics Committee. The Ethics Committee is registered with the Australian Health Ethics Committee, a subcommittee of the National Health and Medical Research Council (NHMRC). Caregivers gave written informed consent to the survey. As the study children were all minors at the time these data were collected, written informed consent was obtained from the caregiver on behalf of each of the study children. The signed consent forms are retained by the field agency (ABS).
Access and use of LSAC data Confidentialised LSAC data are publicly available. Researchers can apply to the Commonwealth of Australia Department of Social Services (DSS) for permission to access and use
PLOS ONE | DOI:10.1371/journal.pone.0135612 September 9, 2015
3 / 29
Patterns and Predictors of Language and Literacy Abilities 4-10 Years
Longitudinal Study of Australian Children (LSAC) data (Growing up in Australia website http://www.growingupinaustralia.gov.au/data/dataaccess.html Accessed 29 June 2015).
Study design The initial study sample comprised 2,792 children who participated in the Longitudinal Study of Australian Children (LSAC), and had data for the key variables (language and literacy) at each wave of the survey. The analytic sample was less than the wave 4 sample, as not all children responded to all study items. The sample size thus varied slightly between analyses, based on item response. The LSAC is a national longitudinal study that commenced in 2004. The study uses a crosssequential design of biennial face-to-face visits with the family and study child. In this study we used data from the child cohort collected at 4, 6, 8 and 10 years. Table 1 contains the number of children, the median ages and age ranges in months for the study children at each longitudinal wave. The LSAC sampling frame was extracted from the Medicare Australia enrolment database, which was validated to ensure coverage of Australian children within the target age-range. The initial study sample was designed to be representative of Australian children within the selected age cohort, proportional to the regional distribution of children in the Australian population. An initial sample size of 5,000 was chosen as to ensure there would still be a sufficient sample for detailed analysis after attrition over the number of years of the longitudinal study. The study entailed a two-stage clustered design, first selecting postcodes then children within postcodes. Stratification was used to ensure proportional geographic representation for states/territories and capital city statistical division/rest of state areas. Cluster sampling was utilised because it provides a cost effective way to conduct face-to-face interviews, as well as an opportunity to collect and analyse community-level effects. Postcodes were selected with probability proportional to size selection where possible, and with equal probability for small population postcodes. Children were selected from 311 postcodes [23, 24]. Analyses show that the initial sample was broadly representative of the general Australian population when compared with 2001 Census data, but slightly under-representative of families who were single-parent, non-English speaking and living in rental properties [25]. Attrition somewhat increased these biases. For example, the overall attrition rate between ages 4 and 10 was 16.3%, but children with mothers classified as Non-English speaking background decreased from 15.6% at age 4 to 13.3% at age 10, an attrition rate of 28.9%. The proportion of mothers who had a year 11 or less education decreased from 38.9% at age 4 to 35.9% at age10, an attrition rate of 22.7%. Table 1. Sample size at each wave, children’s ages, and PPVT and ARS scores with available sample. Sample at each wave Wave
N
Measures
Child’s age in months Median
Range
Measure
N1
Mean (SD)
Range
28–85
1
4983
57
51–67
PPVT
4406
65 (6.0)
2
4464
82
75–94
PPVT
4317
74 (5.0)
46–92
3
4331
105
95–119
PPVT
4273
78 (5.0)
45–106
4
4169
130
121–140
ARS
3336
3.79 (0.9)
1–5
1
Available sample size.
doi:10.1371/journal.pone.0135612.t001
PLOS ONE | DOI:10.1371/journal.pone.0135612 September 9, 2015
4 / 29
Patterns and Predictors of Language and Literacy Abilities 4-10 Years
Measures Measures of language and literacy abilities. The measure of language ability was the Adapted Peabody Picture Vocabulary Test-III (PPVT) and the measure of literacy ability was the Academic Rating Scale: Language and Literacy Subscale (ARS). The Adapted Peabody Picture Vocabulary Test-III (PPVT) is a test of receptive vocabulary designed for the LSAC study [26]. The Adapted PPVT-III is a shortened version of the PPVT– III [27]. The Adapted PPVT-III was administered directly to each child during the home interview. For each word presented, the child was shown a card containing four pictures and was asked to point to the picture corresponding to the word (e.g., “Show me wrapping”). Scaled scores for the Adapted PPVT-III were used in all analyses. The Pearson product-moment correlation between the full PPVT-III and the Adapted PPVT-III was 0.93 for all children [26]. The Academic Rating Scale: Language and Literacy Subscale (ARS) is a teacher-report measure of literacy ability that has been demonstrated to validly assess developmental skill levels consistent with theories of early literacy acquisition [28]. The ARS comprises nine items (e.g. conveys ideas when speaking, uses strategies to gain information from print, reads fluently, reads grade-level books, comprehends informational text, composes multi-paragraph texts, redrafts, writing, makes editorial corrections, uses computer for variety of purposes). Teachers rated the study child’s performance on a five-point ordinal scale (1 = ‘not yet’; 2 = ‘beginning’; 3 = ‘in progress’; 4 = ‘intermediate’; 5 = ‘proficient.’) in relation to other children at the same grade level. These ratings were used to produce a composite score via Rasch modelling. The development of this measure is described extensively elsewhere [29–31]. Table 1 contains the mean scores with SDs and associated ranges for the Rasch scaled PPVT and ARS. Age standardising. In this study we wanted to examine the relationship between language and literacy over time. However, previous work by Taylor et al [21] has established the relationship between child age and receptive vocabulary. A linear regression model established a slope of 0.35 at age 4. That is, for each month of advancing age, we expect an increase of 0.35 in their PPVT scores. Therefore, in preparing the data for analyses, we decided to adjust for child age, by comparing children’s receptive vocabulary and literacy to their peers closest to them in age. To age standardise, we created age-groups of approximately equal size within the 4-year, 6-year, 8-year, and 10-year age-groups (see Table 2). Children in these age-groups were then ranked relative to their peers. This also allowed us to compare PPVT and ARS on the same scale, as we are now assessing children’s language and literacy relative to similar-aged peers. Stability and change patterns. Fig 1 shows a sample of age-standardised PPVT and ARS z-scores for 20 children randomly selected from the LSAC. It shows that children’s language ability exhibits considerable variability over time. A child that starts well above the mean in PPVT standard deviation units at age 4 does not necessarily finish with ARS well above the Table 2. Age-groups within the 4-year, 6-year 8-year, and 10-year age-groups. 4-year age-group age-group months
6-year age-group n
age-group months
51–54
940
75–79
55–56
1292
80–81
57–58
1363
82–83
59–60
943
61–67
445
Total
4983
8-year age group n
10-year age-group
age-group months
n
age-group months
n
943
95–102
670
121–126
726
1101
103–104
921
127–129
1241
1116
105–106
1160
130–131
853
84–85
821
107–108
846
132–134
886
86–94
483
109–119
734
135–140
463
Total
4464
Total
4331
Total
4169
doi:10.1371/journal.pone.0135612.t002
PLOS ONE | DOI:10.1371/journal.pone.0135612 September 9, 2015
5 / 29
Patterns and Predictors of Language and Literacy Abilities 4-10 Years
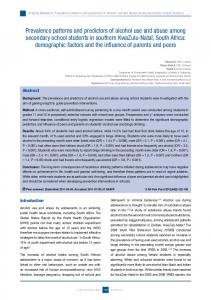
Fig 1. Variation in language and literacy at ages 4, 6, 8 and 10. doi:10.1371/journal.pone.0135612.g001
mean in standard deviation units at age 10. Age-standardised z-scores permit assessing the magnitude of the predictive association between PPVT at age 4 and ARS at age 10 and estimation of the contribution of other putative predictors of teacher-rated literacy. Finally, as we were interested in stability and change in receptive vocabulary and literacy, we identified the lowest 15% (‘low’) within each age-group. This enabled us to examine the extent to which being low-performing in receptive vocabulary, relative to their peers at ages 4, 6 and 8 years, is predictive of their onward teacher-rated language and literacy at 10 years. Taking a categorical approach to language and literacy is complementary to growth curve modelling [21]. It allows us to establish the likelihood of children being low-performing relative to their peers at age 10, and it allows us to establish how well low literacy ability at age 10 can be predicted from risk factors measured at age 4. The latter question is one of substantial practical importance for policies and resources for screening, intervention and progress monitoring. Fig 2 illustrates movement between groups at each age for those children where there is language data recorded at all 4 ages (n = 2792). These can be summarised as patterns of stability, change, improvement and decline. Fig 2 shows that of 318 children with low language at age 4, more than half (198, 62%) move to the middle-high group at age 6.
PLOS ONE | DOI:10.1371/journal.pone.0135612 September 9, 2015
6 / 29
Patterns and Predictors of Language and Literacy Abilities 4-10 Years
Fig 2. Positional movement in language and literacy at ages 4, 6, 8 and 10. doi:10.1371/journal.pone.0135612.g002
What Fig 2 does not show is specific grouping of children in patterns of stability and change. If we consider that a child can be grouped as either ‘low’ or ‘middle-high’ at ages 4, 6, 8 and 10, there are 16 (24) possible combinations of language development across time. Table 3 illustrates these combinations. These groupings of language development can be split into six broad patterns: 2 patterns of stability and 4 patterns of change. Broadly, children can either be stable in their language (i.e. the same position at each age) or they can change (i.e. they change position at least once between ages). The two stable patterns were a stable middle-high pattern (i.e., middle-high across all 4 ages) and a stable low pattern (i.e., low across all 4 ages). The most common developmental pattern was the stable middle-high pattern, 69% of the children were middle-high at Table 3. Language performance within the 4-year, 6-year 8-year, and 10-year age-groups. Age 4
Age 6
Age 8
Age 10
n
%
Low
Low
Low
Low
Low
Low
Low
Low
Low
Low
Low
26
0.9
Stable low
Low
Middle-High
27
1.0
Improving pattern
Middle-High
Low
17
0.6
Fluctuating low pattern
Middle-High
Middle-High
50
1.8
Improving pattern
Middle-High
Low
Low
21
0.8
Fluctuating low pattern
Low
Middle-High
Low
Middle-High
30
1.1
Improving pattern
Low
Middle-High
Middle-High
Low
29
1.0
Fluctuating low pattern
Low
Middle-High
Middle-High
Middle-High
118
4.2
Improving pattern
Middle-High
Low
Low
Low
20
0.7
Declining pattern
Middle-High
Low
Low
Middle-High
39
1.4
Fluctuating middle-high pattern
Middle-High
Low
Middle-High
Low
23
0.8
Declining pattern
Middle-High
Low
Middle-High
Middle-High
106
3.8
Fluctuating middle-high pattern
Middle-High
Middle-High
Low
Low
43
1.5
Declining pattern
Middle-High
Middle-High
Low
Middle-High
126
4.5
Fluctuating middle-high pattern
Middle-High
Middle-High
Middle-High
Low
202
7.2
Declining pattern
Middle-High
Middle-High
Middle-High
Middle-High
1915
68.6
Stable middle-high
2792
100
Total
Pattern
doi:10.1371/journal.pone.0135612.t003
PLOS ONE | DOI:10.1371/journal.pone.0135612 September 9, 2015
7 / 29
Patterns and Predictors of Language and Literacy Abilities 4-10 Years
all 4 ages. One of the least common developmental patterns was a stable low pattern. Only 26 children (less than 1% of all children) were persistently in the low group at ages 4, 6, 8 and 10. Change patterns are also evident in Table 3. Children can show an improving pattern (i.e., starting low and finishing middle-high), a declining pattern (starting middle-high and finishing low), a pattern of low fluctuation (i.e. starting low, moving to middle-high, then finishing low), or a pattern of middle-high fluctuation (i.e. starting middle-high, moving to low, then finishing middle-high). Eight per cent (8%) of children fit an improving pattern, 10% of children fit a declining pattern, 2% of children are in a fluctuating low pattern, and 10% of children are in a fluctuating middle-high pattern. Of the 318 children who started in the low language group at age 4, only 93 finished in the low group at age 10. Of the 381 children who were low in language at age 10, the majority (355) were classified as middle-high at least once at ages 4, 6 and 8. The table illustrates some strong trends of instability. For example, 637 children out of 2792 spend 3 waves in one group and 1 wave in another group (i.e. low, low, low, middle-high, middlehigh; low, low, low; low, middle-high, low, low. . .). Candidate predictors. The candidate predictor measures used in this paper have been extensively described elsewhere [3]. Briefly, a bioecological model of child development [32, 33] guided the selection of measures for the LSAC. Among these domains are characteristics related to the child, the mother, and the family home environment. In this study, we used the same predictor set used in our study of receptive vocabulary growth 4–8 years [21]. Variables in this predictor set met one of the following two criteria: (1) Evidence of an independent association with English language abilities in a representative population level sample of preschool and school age children; or (2) conceptual relevance to language abilities, in the absence of empirical evidence. Many of the measures are benchmarked against Australian census collections while others are referenced to large scale Australian and international child development studies. In addition to measures of PPVT at ages 4, 6 and 8, another 28 candidate predictor variables were used, giving a total of 31 predictors. These were grouped into child, maternal, and family and home environment characteristics. All candidate predictor variables were measured when the child was 4 years of age. Candidate predictors were modelled as risk variables with the lowest level of risk as the reference category (see Table 4). The analytic sample for each candidate predictor varied somewhat, depending on item completeness. Child characteristics. The child characteristics in our models were: Gender, ethnicity, birthweight, ear infections, school readiness and temperament. There were equal proportions of girls and boys in the sample. A small proportion of children (n = 100; 3.0%) were of Aboriginal and/or Torres Strait Islander descent and were coded to distinguish them from those who were not. Primary carers were asked to report their child’s birthweight which was subsequently coded into those children who were born with low birthweight (< 2500 grams; 6.3%) and those who weighed more than this (> = 2500 grams). A single item indicator of ongoing ear infections at 4 years was included. Each study child was directly assessed at 4 years using the Who Am I?(WAI) [34]. The 11 items of the WAI measure ‘pre-academic’ early copying and writing skills. The items include visuo-spatial, manual-motor copying of shapes (5 items), a single item that probes for the child’s capacity to write a number(s), a single item prompting the child to draw a person (picture of yourself), and four items that probe literacy: write some letter(s), your name, some word(s) and a sentence. The WAI is broadly independent of language background, and is considered a general measure of aspects of early literacy and motor control (see Prior et al., 2013 [35]). It has been extensively calibrated for use in the LSAC and has well demonstrated item characteristics, high internal reliability (0.89), and excellent distributional properties [36]. There is a weak correlation between the WAI and PPVT measure at age 4: About 9% of their variance is shared [36]. In this
PLOS ONE | DOI:10.1371/journal.pone.0135612 September 9, 2015
8 / 29
Patterns and Predictors of Language and Literacy Abilities 4-10 Years
Table 4. Initial candidate predictors: Child, maternal and family characteristics of children in the low literacy and middle-high literacy groups at 10 years. Predictor variables
Low ARS at 10 years (N = 502)
Middle-high ARS at 10 years (N = 2834)
Unadjusted Odds Ratioab
n
%
n
%
OR
95%CI
Low (bottom 15%)
114
31.6
247
68.4
3.43
2.62–4.49
Middle-high group
312
11.7
2351
88.3
ref.
Low (bottom 15%)
117
30.8
263
69.2
3.07
Middle-high group
343
12.5
2406
87.5
ref.
Low (bottom 15%)
145
34.3
278
65.7
3.72
Middle-high group
325
11.6
2478
88.4
ref.
male
321
19
1369
81
1.75
female
181
11
1465
89
ref.
ATSIC
45
45
55
55
4.92
SC Non-ATSI
457
14.1
2777
85.9
ref.
Low birthweight
38
18.3
170
81.7
1.34
Normal birthweight
450
14.6
2638
85.4
ref.
yes
59
23
197
77
1.69
no
443
14.4
2637
85.6
ref.
1 (lowest)
205
34
398
66
11.16
7.17–17.38
2
135
18.9
579
81.1
5.36
3.45–8.32
3
63
11.5
487
88.5
2.93
1.86–4.61
4
52
7.7
627
92.3
1.59
0.98–2.58
5 (highest)
32
4.2
722
95.8
ref.
1 (lowest)
118
24.2
369
75.8
3.59
2.51–5.13
2
128
16.6
645
83.4
2.16
1.49–3.13
3
82
11.8
610
88.2
1.51
1.04–2.17
4
55
10.7
461
89.3
1.4
0.93–2.09
5 (highest)
37
8
423
92
ref.
1 (most reactive)
131
22
464
78
2.73
1.92–3.88
2
82
16.1
427
83.9
1.81
1.27–2.57
3
78
12.6
542
87.4
1.38
0.99–1.93
4
75
12.4
531
87.6
1.29
0.89–1.88
5
50
8.6
532
91.4
ref.
1 (lowest)
77
14.7
446
85.3
0.92
0.67–1.26
2
109
14.9
622
85.1
1.05
0.77–1.44
p