are predictable in coral reef communities is confronted directly by trying to predict abundances of benthic taxa both within and between two reefs on the central ...
Coral Reefs (1987) 6:27-34
Coral Reefs 9 Springer-Verlag 1987
~
Patterns of predictability in coral reef community structure D.G. Green ~, R.H. Bradbury 2 and R. E. Reichelt 2 i Department of Biogeography and Geomorphology, Australian National University, GPO Box 4, Canberra 2601, Australia 2 Australian Institute of Marine Science, PMB No. 3, Townsville 4810, Australia Accepted 28 December 1986
Abstract. The question of whether population numbers
are predictable in coral reef communities is confronted directly by trying to predict abundances of benthic taxa both within and between two reefs on the central Great Barrier Reef. Using models derived via the Group Method of Data Handling (GMDH), taxon abundances were found to be more predictable at Davies Reef than at Myrmidon Reef and a significant number of taxa showed consistent predictability patterns in all tests. For most taxa, the predictability of benthic abundances increased steadily with increasing spatial scale. Water depth figured prominently in almost all of the models obtained, emphasizing its importance as a physical determinant of local taxon abundances.
Introduction
Two extreme views have dominated debate on the structure of coral reef communities. What might be termed the "law and order view" sees reefs as ordered systems in which biotic (Sheppard 1982) and physical (Bradbury and Young 1981) factors largely control population distributions and abundances. The alternative "anarchy view" sees them as systems that are so complex, so statistically "noisy", that attempts to model them detect only chaos (Sale 1980; Schaffer 1985; Ulanowicz 1979; Vandermeer 1982). Empirical support for these two views is drawn from different levels of ecosystem structure - zonation patterns of whole communities (Dinesen 1983; Done 1982; Williams 1982) support the "law and order" view, whilst chaotic distributions of individual populations (Sale and Dybdah11978; Talbot et al. 1978; Vandermeet 1982) support the "anarchy" view. The factors and processes linking these different levels are too poorly understood to be modelled satisfactorily (Reichelt and Bradbury 1984), so evidence at one level cannot be reconCiled with evidence at the other. Comparisons are further confounded by methodological differences between stud-
ies associated with each view. For example, communitylevel studies usually suppress variability in ecosystem data, via multivariate pattern extraction (Bradbury and Young 1981; Dinesen 1983), whilst population-level studies tend to emphasize it, by partitioning it statistically into main effects and error variance (Talbot et al. 1978; Choat 1983). The above conflicting paradigms pose a dilemma that is critical both for ecology and for reef management programmes: if "law and order" prevails in coral reef communities, then it ought to be possible to use our understanding of reef ecology to predict community structure, at least to some extent. On the other hand, if "anarchy" prevails, then prediction would not be possible at all and without such an ability conservation measures have no firm basis (Bradbury et al. 1985). To resolve this dilemma, it is necessary to show whether or not community-level order can be detected amidst the chaos seen by population biologists. The problem demands a suitable approach - one that is free both of the assumptions that helped to produce the dilemma in the first place and of the unfortunate alignment of scale and level of organization with type of analysis. In this study we confront the above dilemma directly by testing whether the sorts of abundance distributions and relationships that are so evident in reef community ecology are detectable amidst the chaos found in reef population biology. We do this by using the pattern of benthic abundances found at one location to make numerical predictions of benthic abundances at a second location. Moreover, we overcome the problem of scale-dependent results by analyzing our population data at a range of scales and, by using the same analytic approach throughout, we avoid the confusion that differing methodologies have caused in previous studies. This strategy allows us to observe how predictability changes with scale, thus giving some insight into the scale-dependence of the processes controlling population abundances. To make the analysis possible we exploit the advantages of self-organizing modelling algorithms. We have
28
argued that problems in numerical biology can be loosely classified under the headings explanation, prediction, and control (Bradbury et al. 1983, 1984; Reichelt et al. 1983). Models, especially, need to be designed or selected with a specific type of problem in mind (Pielou 1981). For the problem of predicting the distribution and abundances of organisms on reefs, self-organizing algorithms (Farlow 1984), which build models systematically by trial-and-error, offer the distinct advantage of deriving models that best fit the available data, rather than preconceptions about it. That is, they derive accurate numerical models without the need for prior assumptions about (say) linearity or orthogonality amongst the independent variables that are required by many other modelling techniques. Self-organizing algorithms thus provide a direct, consistent way to measure the predictability in a system without making assumptions about controls over the system. Moreover, this modelling approach is in-
1 ~ ,_L
~
.... i ,,~.-'
II
.o
"~
"
I k-,~,...'~'-7 "
~-Q
I
\
L,~o
"\\ "~"
O
~'
Myrmidon
Reef'~-#\
.:.~ ~)'
t
9 .~.> . ~
s
%
~.
"'-,
\
~),~.~ " [~((i~
~"~
....
'~
g
,ra.seot ,~
To
o
',
Davies Reef
~
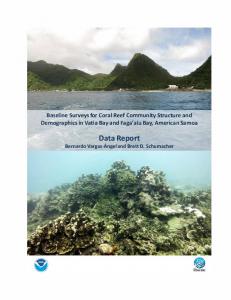
For our study we selected the benthic communities of Davies and Myrmidon reefs, which lie about 40 km apart on the central Great Barrier Reef (Fig. 1). Earlier studies had shown these communities to be clearly zoned (Dinesen 1983; Done 1982; Williams 1982) -predictable at the community level in our terminology. To measure predictability at the population level we used abundances of the following functional groups of life-forms comprising the benthic community: Branching, Table, Encrusting, and Submassive Acropora; Branching, Massive, Encrusting, and Submassive Hard Corals; Dead Coral (where not covered by living organisms), Soft Corals, Sponges, Other Invertebrates, and Turf Algae. For con-
T
'-
-re.
The data set
\
\\
"".
5~
.,_.--.U(;
~
I
~,o
dependent of spatial scale because the population distribution data that it uses can be compiled at any scale.
s.es
.
0.5 n mile
Fig. 1. L o c a t i o n o f s t u d y sites o n D a v i e s a n d Myrmidon Reefs
29
venience we shall refer to these functional groups as "taxa," even though particular groups are not always confined to a single genus or family. The abundance data consist of estimates for the areas covered by the above 13 benthic "taxa" within line transects, each repeated along the reef crest, reef flat, and on the reef slope at depths of 5, 10, 15, and 20 m (Bradbury et al. 1986). This sampling scheme provided two physical parameters as independent variables: water depth and a subjective index of exposure to wave damage (T.J. Done personal communication), both of which remained constant throughout each transect. The contiguous transect data were blocked into discrete estimates of taxon abundances at five scales: 5 m, 10 m, 15 m, 20 m, and 25 m. At the 5 metre scale, the Myrmidon Reef data yielded 120 such blocks and the Davies Reef data yielded 160; the number of blocks decreased in inverse proportion to scale.
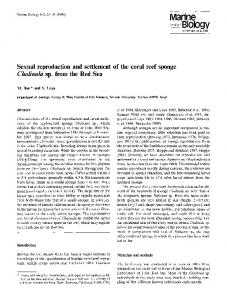
Analytic methods One of the most successful modelling techniques to emerge in recent years is the "Group Method of Data Handling" (GMDH) (Ivakhnenko 1971), which has been applied to a wide range of prediction problems in economic (Ivakhnenko 1978; Parks et al. 1975) and environmental (Duffy and Franklin 1975; Farlow 1984) contexts. GMDH is self-organizing and works as follows: given a set of observations (the "source" data) for some dependent variable y and for independent variables x~ . . . . x,, GMDH finds the polynomial model (of whatever complexity required) that best predicts values of y from known values o f x t, ..., x n (Farlow 1981). Every G M D H model is a pyramid (see for example Fig. 2), in which each block contains a simple polynomial equation in two independent variables. Throughout this study, the polynomial w(u,v) = au + by + cur + d
was used, with a, b, c, and d being constants. As values of its two independent variables u, v, each block accepts inputs from blocks in the tier below and passes the resulting values of its dependent variable w to blocks in the tier above, where they become values of new independent variables. One virtue of the pyramid representation used by GMDH is that the algorithm is "self-organizing." That is, after being fed data, it forms a model automatically, without having to be instructed what form the model should take (in contrast to regression, say). GMDH forms a model by building the required pyramid one layer at a time, starting from the base. First, the source data are split (randomly) into "learning" and "checking" subsets. The independent variables are then tested in pairs by applying multiple regression to the learning set and adding the resulting polynomial submodel to the next layer if it predicts values of the dependent variable in the checking subset accurately enough. When all possible pairs of independent variables have been tested this way, the first layer is complete. When forming subsequent
X1
X2
X3
X4
X5
X6
X7
X8
X9
Fig. 2. Structure of a typical GMDH model pyramid. Values of the independent variables (here represented as X2,.... Xg) are input at the base of the pyramid and the resulting prediction Y is output from the top of the pyramid. Each box contains a simple polynomial of the form W = a + b U+ cV + dUV, but with different values for the coefficients. Outputs from models on any one layer are passed as inputs (indicated by arrows) to models on the layer above. For further details see our technical paper on the method (Green et al. in press)
layers, the outputs of each of the polynomial submodels in the previous layer are treated as values of a new set of independent variables and the process is repeated. The process stops when some iteration of the above process fails to produce any improvement in the prediction of values in the checking data set. Two parameters control the algorithm's performance: the minimum coefficientof-determination needed for a submodel to be acceptable and the maximum number of submodels that are accepted when forming a given layer of the pyramid. To test within-reef predictability, the available data for each reef at each scale were split into two similar, but independent, "source" and "target" sets. One set provided source data from which GMDH derived models for each taxon's abundances. Using these models we then attempted to predict taxon abundances for the "target" set of observations. Note that the set of target observations was completely independent of the source data and should not be confused with the "checking" set, which is a subset of the source data. We examined the predictability of each taxon in turn, using its abundances as values of the dependent variable for the GMDH analysis. The independent variables in the analysis were water depth, wave exposure, plus the abundances of each of the remaining 12 benthic taxa. The predicted abundances for a particular taxon were then compared with its observed abundances in
30 the target data. Coefficients o f determination between observed and predicted abundances indicate the p r o p o r t i o n o f the variation in each t a x o n ' s distribution pattern that is explained by the predictions. T h r o u g h o u t the rest o f o u r discussion, the term "predictability" will m e a n the " p r o p o r t i o n o f variance in the target data explained by the model derived f r o m the source d a t a , " that is the value o f the coefficient o f determination. To test between-reef predictability, G M D H models were derived using all o f the observations for one reef as source data. Predictions m a d e by the resulting models for the other reef, using all o f the observations f r o m it as target data, were checked in the same fashion as for the within-reef tests. N o t e that if our benthic groups covered the entire substrate surface, then the sum o f all the areas occupied by individual taxa would equal the total surface area, so the relationship between the surface areas covered by different taxa w o u l d be a trivial, linear one. However, m u c h o f the substrate in these coral reefs is bare sand or rubble (Bradbury et al. 1986), and relationships between the areas covered by different taxa can be extremely complex. I f the prediction p r o b l e m were trivial, as we have stated it, then the correlation between the surface area covered by an individual t a x o n and the sum o f the areas covered by all other taxa w o u l d be highly negative in every case. O f our 13 benthic groups, only submassive Acropora (at b o t h reefs) and encrusting Acropora (at Davies Reef) yielded significantly negative correlations in this test (not shown). M a n y taxa yielded slightly positive (but n o t significant) correlations. In using the G M D H algorithm, the values given to the run control parameters and the w a y in which the training data set is sorted into "learning" and "checking" subsets are crucial (Green et al. in press). F o r example, a reordering o f the training d a t a could result in a different
within reefs. Entries are coefficients of determination (expressed as percentages) between predicted and observed abundances within single transects Table 1. Predictability of benthic abundances
Davies
Taxon Scale(m):
Myrmidon
5 10 15 20 25
Acropora Branching Tables Encrusting Submassive Other hard corals Branching Massive Encrusting Submassive Dead coral Soft corals Sponges Other invertebrates Turf algae
5 10 15 20 25
12 7 3 17 9 3 14 1 6 28 32 42 73 64 59 55 58 84 82 63
4 6 43 77
66 20 52 13 24 47 57 20 89
2 2 38 49 70 23 67 43 20 27 34 30 36 33 60
64 2 28 12 2 44 73 35 96
80 6 66 29 17 80 83 55 95
86 54 82 6 4 72 70 52 97
58 21 86 30 35 59 82 68 99
23 15 13 71
19 23 65 71
14 22 12 38 70 3 79 70
8
2
6
6
5'
50 49 3 2 28
84 55 4 10 66
7 74 16 22 46
26 86 9 24 83
56 90 11 3 72
Table 2. Predictability of benthic abundances betweenreefs. Entries are coefficients of determination (expressed as percentages) between predicted and observed benthic abundances. D~M indicates predictions made for Myrmidon Reef using models based on Davies Reef data M~D
Taxon Scale(m):
5 10 15 20 25
D~M 5 10 15 20 25
Aeropora Branching Tables Encrusting Submassive
2 16 1 23 14 11 2 4 7 3 27 41 40 41 6 8 30 59 10 63
4 4 18 53
10 7 15 4 19 6 7 7 17 35 29 44 63 71 75 65
Other hard corals Branching Massive Encrusting Submassive
9 27 70 50 45 13 13 6 12 3 22 20 12 56 21 11 9 14 12 7
2 3 9 15 19 9 15 2 21 47 11 28 16 34 34 2 2 2 1 12
Dead coral Soft corals Sponges Other invertebrates Turf algae
2 3 5 19 11 44 59 66 70 77 18 13 27 43 69 15 4 34 20 48 69 68 71 86 52
4 4 7 4 16 45 58 27 49 55 3 3 10 6 6 1 1 8 3 6 27 48 26 36 46
model which yields significantly different estimates o f taxon predictability. This effect would be m o s t m a r k e d for small data sets (that is at the largest spatial scales) and for data sets having the m o s t extreme outliers (that is where the average a b u n d a n c e s were low). Bias introduced by such effects can be avoided by " b o o t s t r a p p i n g " (Efron 1979), that is, by multiple analyses, each based on a different allocation o f the data to the learning and checking subsets. Thus, for each data subset, we perf o r m e d several analyses, each o f which used different values o f run control parameters and different r a n d o m arrangements o f the source data. N o w each o f these analyses will contain bias, o f one sort or another, that restrict the resulting model's ability to predict well, so the best estimate o f a t a x o n ' s "inherent predictability" will be the best result obtained overall. Hence each tabulated estimate o f predictability (Tables 1 a n d 2) is the maximum o f the variance explained by individual models p r o d u c e d in the above b o o t s t r a p p i n g procedure. In order to examine the patterns o f predictability a m o n g the taxa m o r e closely, we u n d e r t o o k a numerical classification o f the 26 individual results (13 taxa x 2 reefs) in Tables 1 and 2, using the predictabilities at each o f the 5 scales as attributes. We used C S I R O ' s T A X O N package (Ross 1983) to p e r f o r m the classifications, taking squared euclidean distance as the dissimilarity measure and selecting a s t a n d a r d polythetic, agglomerative sorting strategy. The within-reef and between-reef predictions were classified separately. Results
Within-reef predictions Plots o f observed versus predicted abundances withinreef for soft corals at M y r m i d o n Reef (Fig. 3) illustrate the i m p r o v e m e n t in predictability with spatial scale. Per-
31
;40
S
L# ~176 , o
o;o
Predicted
Fig. 3. Oberserved (Y-axis) versus predicted (X-axis) abundances of soft corals at different spatial scales, within-reef at Myrmidon. The axes indicate abundance (area covered) as a percentage of total area. The diagonal lines on each plot show where perfect predictions would lie
fect predictions would lie on a diagonal line at 45 ~ paaing through the origin. At the 5 m and 10 m scales (Fig. 3), noise in the learning set makes the GMDH derived models insensitive, that is, predicted abundances tend to lie within a narrow range of values despite wide variations in the observed abundances. Most noticeable in the plots is their failure to predict any values higher than 30%, even though the observed abundances rise as high as 70%. At the higher scales (Fig. 3, 15-25 m), the models are much more sensitive. The tendency to overpredict soft coral abundance at the 25 m scale probably reflects systematic differences in composition between the two ends of the reef (Bradbury et al. 1986). Overall, the correspondence between observed and predicted taxon abundances varies enormously (Table 1), not only from one taxon to another, but also at different scales for a single taxon. For most taxa, predictability tends to increase with increasing scale. At Myrmidon Reef, the average predictability at the two greatest scales (20 m and 25 m) is greater than the average for the two smallest scales (5 m and 10 m) for 10 out of 13 taxa (sign test: P