Research
Postexperiment Monoisotopic Mass Filtering and Refinement (PE-MMR) of Tandem Mass Spectrometric Data Increases Accuracy of Peptide Identification in LC/MS/MS*□ S
Byunghee Shin‡§, Hee-Jung Jung§¶, Seok-Won Hyung§¶, Hokeun Kim‡, Dongkyu Lee‡, Cheolju Lee储, Myeong-Hee Yu‡, and Sang-Won Lee¶** Methods for treating MS/MS data to achieve accurate peptide identification are currently the subject of much research activity. In this study we describe a new method for filtering MS/MS data and refining precursor masses that provides highly accurate analyses of massive sets of proteomics data. This method, coined “postexperiment monoisotopic mass filtering and refinement” (PE-MMR), consists of several data processing steps: 1) generation of lists of all monoisotopic masses observed in a whole LC/MS experiment, 2) clusterization of monoisotopic masses of a peptide into unique mass classes (UMCs) based on their masses and LC elution times, 3) matching the precursor masses of the MS/MS data to a representative mass of a UMC, and 4) filtration of the MS/MS data based on the presence of corresponding monoisotopic masses and refinement of the precursor ion masses by the UMC mass. PE-MMR increases the throughput of proteomics data analysis, by efficiently removing “garbage” MS/MS data prior to database searching, and improves the mass measurement accuracies (i.e. 0.05 ⴞ 1.49 ppm for yeast data (from 4.46 ⴞ 2.81 ppm) and 0.03 ⴞ 3.41 ppm for glycopeptide data (from 4.8 ⴞ 7.4 ppm)) for an increased number of identified peptides. In proteomics analyses of glycopeptide-enriched samples, PE-MMR processing greatly reduces the degree of false glycopeptide identification by correctly assigning the monoisotopic masses for the precursor ions prior to database searching. By applying this technique to analyses of proteome samples of varying complexities, we demonstrate herein that PE-MMR is an effective and accurate method for treating massive sets of proteomics data. Molecular & Cellular Proteomics 7:1124-1134, 2008.
From the ‡Functional Proteomics Center and 储Biomedical Research Center, Life Sciences Division, Korea Institute of Science and Technology, 136-791, Hawalgok-dong, Seongbuk-gu, Seoul 130-650, Republic of Korea and ¶Department of Chemistry and Center for Electro- and Photo-Responsive Molecules, Korea University, 1, 5-ka, Anam-dong, Seongbuk-gu, Seoul 136-701, Republic of Korea Received, September 4, 2007, and in revised form, February 13, 2008 Published, MCP Papers in Press, February 25, 2008, DOI 10.1074/ mcp.M700419-MCP200
1124
Molecular & Cellular Proteomics 7.6
MS has evolved into a robust and powerful tool for analyzing biomolecules. For example, MS is presently a preferred analytical tool for proteomics experiments in which dynamic populations of proteins are to be identified and quantified. In shotgun proteomics, hundreds or thousands of proteins are routinely identified through LC/MS/MS experiments using the proteolytic digests of proteome samples. During these LC/ MS/MS experiments, peptides are dynamically selected for fragmentation; the resultant tandem mass spectra (usually on the order of 105 spectra) are subsequently subjected to database searching (e.g. SEQUEST or Mascot) to best describe or annotate the peptide. Searching a large set of tandem mass spectra against a protein sequence database is a computationally expensive process; the resultant peptide spectral matches (PSMs)1 are prone to false-positive (FP) identifications, which have led to the development of several validation methods (1, 2). Acquisition of high quality tandem mass spectra is critical to the whole process of protein identification through the shotgun approach because the measured fragment ion masses are compared with the theoretical values predicted by the search algorithms; any factors that adversely affect the acquisition of tandem mass spectra would undoubtedly lead to incorrect peptide assignments. Venable and Yates (3) systematically studied the effects that variability in tandem mass spectral quality had on peptide identification (i.e. peptide scores) and suggested an approach involving both presearch spectral averaging and postsearch XCorr averaging. Large portions (up to 90%) of tandem mass spectral data are not assigned to peptide sequences (4, 5) for many reasons, such as the presence of unknown protein sequences, the possibility of chemical (or post-translational) modification having occurred, insufficient spectral quality for high confi1
The abbreviations used are: PSM, peptide spectral match; PEMMR, postexperiment monoisotopic mass filtering and refinement; UMC, unique mass class; MMA, mass measurement accuracy; RPLC, reverse-phase LC; FP, false-positive; DO-SPE/cRPLC, dual on-line solid phase extraction/capillary reverse-phase LC; SCX, strong cation exchange; AGC, automatic gain control; ID, identification; XCorr, cross correlation score; THRASH, thorough high-resolution analysis of spectra by Horn; Th, Thomson.
© 2008 by The American Society for Biochemistry and Molecular Biology, Inc. This paper is available on line at http://www.mcponline.org
PE-MMR of MS/MS Data
dence matching, and the presence of nonpeptide-like signals arising from chemical or electrical noise. The algorithms of the database search tools also need improving. Recently studies relating to the development of mathematical tools for rapidly analyzing large sets of tandem mass spectral data have become indispensable. For example, Yates and co-workers (6) developed so-called “2to3” computational software to determine the charge states of precursor ions by finding matching fragment pairs; they utilized it to evaluate the quality of tandem mass spectra, efficiently removing poor quality spectra (⬃20 –30%) while only minimally affecting protein identification. Recently Aebersold and co-workers (7) used a dynamic quality scoring approach to find unannotated high quality spectra for subsequent in-depth annotation processes, such as multiple modifications or sequence polymorphism. Cagney and co-workers (5) also developed a probability-based method of assessing the quality of tandem mass spectra. Assignment of accurate precursor ion masses to tandem mass spectra is often problematic even when using high resolution mass spectrometers such as FT-ICR or Orbitrap systems. A common practice in shotgun proteomics is the dynamic selection of precursor ions for fragmentation with exclusion to prevent reacquisition of MS/MS spectra for the same peptide. Thereby the precursor ion intensities selected for fragmentation are likely to be very weak even though the corresponding MS/MS spectra may be of high quality as a result of the selective accumulation of ions over a narrow mass range in the ion trap. The subsequently higher intensity mass spectral peaks are frequently of no use if the peptides elute out prior to the expiration of the exclusion time. The presence of low intensity mass spectral peaks leads to inaccurate determination of precursor ion masses that results in false peptide identification. Several different approaches have been described previously to overcome this issue. One is simply to accept the difficulty and use a wide mass tolerance (e.g. 3 Da) for the database search. This approach leads, however, to an increased computational burden, and the process becomes susceptible to false positives. Others have utilized selective ion monitoring scans to accurately obtain precursor ion masses (8); this approach, however, inevitably decreases experimental throughput. Gygi and co-workers (9) used a relatively large mass tolerance (i.e. 50 ppm) for a first database search and subsequently subjected the search results to stringent filtering (i.e. 8 ppm). This approach significantly reduced the FP rate with only a minimal loss of peptide information. More recently, Yates and co-workers (10) used a cross-correlation function between the fragment features of a tandem mass spectrum and those of its reverse spectrum to obtain the precursor ion mass. Typically they achieved mass accuracies of less than 0.25 amu for ion trap mass spectra. In this study, we report a procedure, “postexperiment monoisotopic mass filtering and refinement” (PE-MMR), for the analysis of tandem mass spectrometric data. The PE-MMR method involves several steps of analyzing both MS and
MS/MS data, including the extensive and accurate extraction of monoisotopic mass information from MS spectra (using the THRASH algorithm), unique mass class (UMC) generation through the clustering of peptide MS peaks having different elution times, precursor ion mass correction, and monoisotopic mass filtration in terms of the UMC mass, which is the intensity-weighted average mass of the monoisotopic masses of the UMC components. MS/MS data from random noise (i.e. signals that do not display isotopic distribution in MS spectra) are efficiently filtered out by matching these masses to the monoisotopic masses in the UMC list. We demonstrate herein the application of the PE-MMR method to the analysis of LC/MS/MS data obtained from tryptic yeast peptides and glycopeptide mixtures enriched from human sera and discuss the validity of the technique. EXPERIMENTAL PROCEDURES
Sample Preparation—Saccharomyces cerevisiae haploid strains Y2805 (MAT␣ pep::his3 prb1-⌬1.6R can1 his1-200 ura3-52) and AF-2 (HML␣ or HMRa ho ade2-1 trp1-1 can1-100 leu2-3,112 his3-11,15 ura3-1 ssd1) were used to prepare the yeast proteome sample as has been described in detail previously (11). Here we used only the soluble fraction of the cell lysate, which was subjected to tryptic digestion. Human sera were obtained from 15 healthy females; the samples were prepared by selective isolation of N-glycosylated peptides (12). The processes were performed using an automated liquid handling robot system (Freedom EVOTM, Tecan Group Ltd., Ma¨nnedorf, Switzerland) to reduce any possible technical variations; each sample was divided into three aliquots so that, in total, 45 samples were available for analysis. A portion (80 l) of each serum sample was added to a well in a 96-well desalting column (Harvard Apparatus G-10 spin column, Nest Group), which was centrifuged at 1000 rpm for 1 min to isolate the proteins from the serum solution. The eluted protein solutions were collected in a fresh 96-well plate (Captiva 96-well, 0.45-m PVDF filter plate; well volume, 1 ml). The glycomoieties of the proteins were then oxidized through addition of aqueous sodium periodate solution (100 mM, 8 l) to the protein solution; the mixture was subjected to gentle shaking at room temperature for 1 h in the dark. After oxidation, excess sodium periodate was removed using the same desalting column. During oxidation, the hydrazide resin was prepared by first transferring a hydrazide slurry (Affi-Prep Hz hydrazide, Bio-Rad, 200 l) to each well and then adding the coupling buffer (800 l). The solution was centrifuged at 1000 rpm for 1 min; this washing step was repeated three times. After washing the resin, the bottom of the filter plate was sealed with 96-well plate covers (Captiva 96-well pierceable collection plate covers, Varian), and coupling buffer (200 l) was added to each well to resuspend the hydrazide resin. The oxidized protein samples were then transferred to the filter plate for conjugation to the resin. The conjugation proceeded at room temperature for 20 h with gentle shaking; the non-glycosylated proteins were removed (by centrifuging the 96-well filter plate at 1000 rpm for 1 min) and then stored at ⫺20 °C. The remaining non-glycosylated protein was removed by washing the resin six times with urea solution (8 M urea, 0.4 M NH4HCO3, pH 8.3; 800 l); the resin was then resuspended in digestion buffer (2 M urea, 0.1 M NH4HCO3, pH 8.3). Before each washing step, the sealing cover was removed from the 96-well filter plate. Tris(2-carboxyethyl)phosphine hydrochloride solution (12 l) was added to the hydrazide resin, and then the mixture was incubated at room temperature for 30 min. Iodoacetamide solution (16 l) was
Molecular & Cellular Proteomics 7.6
1125
PE-MMR of MS/MS Data
added to the mixture, which was then incubated at room temperature for another 30 min. The resin was washed sequentially with the digestion buffer (2 ⫻ 0.8 ml) and 100 mM NH4HCO3 buffer (2 ⫻ 0.8 ml). After washing, the hydrazide resin was resuspended in 100 mM NH4HCO3 buffer (450 l). Trypsin (Worthington; protein-to-trypsin ratio, 1:1 (w/w); 5 g) was added to each sample (450 l), and then the mixtures were incubated overnight at 37 °C. Any supernatant containing non-glycosylated peptides was removed from the mixture by centrifuging the samples at 1000 rpm for 1 min. The remaining non-glycosylated peptides were removed by washing the resin (3 ⫻ 800 l each time) sequentially with 1.5 M NaCl, 80% acetonitrile in water, methanol, water, and 100 mM ammonium bicarbonate buffer. The supernatant was removed after centrifuging at 1000 rpm for 1 min after each washing step. The N-linked glycopeptides were released from the resin through the addition of a diluted glycerol-free peptideN-glycosidase F solution (New England Biolabs; 1:150 dilution, 150 l) followed by incubation with gentle shaking at 37 °C overnight. The supernatant containing glycopeptides was collected into a 96-well collection plate with 700-l glass inserts (Waters) through centrifugation (at 1000 rpm for 1 min); the resin was then washed with 80% acetonitrile (2 ⫻ 200 l), and the washing solutions were added to the 96-well collection plate. The solutions were evaporated for ⬃2–3 h in a SpeedVac system so that the final volumes were less than 200 l, and then they were desalted using 96-well Vydac silica C18 columns. The released glycopeptides were collected in a glass vial, dried in the SpeedVac system (⬃1 h), and resuspended in aqueous 0.4% acetic acid (40 l) prior to mass spectrometric analyses. The resultant glycopeptide-enriched samples (a total of 45 samples) were pooled into a single sample immediately prior to LC/MS/MS experiments. LC/MS/MS Experiments—The tryptic yeast peptides were separated using a modified version of our ultrahigh pressure dual on-line solid phase extraction/capillary reverse-phase liquid chromatography (DO-SPE/cRPLC) system, with a maximum operating pressure of 10,000 p.s.i., that is described in detail elsewhere (13). Briefly we incorporated SCX separation (operated using an Agilent 1100 nano-LC system) on line with the DO-SPE/cRPLC system (operated using two ISCO pumps, 100 DM) to construct an on-line two-dimensional LC system. The system used one SCX column (150-m inner diameter ⫻ 360-m outer diameter ⫻ 30-cm length, 5 m, 200-Å pore size, PolyLC) and two RPLC capillary columns (75-m inner diameter ⫻ 360-m outer diameter ⫻ 80-cm length, C18-bonded particles, 3 m, 300-Å pore size, Jupiter, Phenomenex), which were manufactured in house through slurry packing. The system also incorporated two SPE columns that were prepared by packing a 1-cmlong liner (250-m inner diameter) inside an internal reducer (1⁄16–1⁄32 inch; VICI) with the same C18-bonded particles. The samples were fractionated on line into 14 salt gradients by the first-dimensional SCX separation, and then each of the fractionated samples was alternately directed to one of the two RPLC columns for second-dimensional separation. Each SCX fraction was desalted on line in the SPE column and eluted using a gradient provided by a mixture of solvents A (0.1% formic acid in water) and B (90% acetonitrile, 0.1% formic acid in water) where the percentage of the latter mobile phase was increased exponentially from 0 to 80% by volume over a period of 180 min. In total, 14 sets of RPLC/MS/MS data were obtained from a single sample injection. Unlike the case for the yeast experiments, the glycocaptured peptides from the human sera samples were separated using the DO-SPE/cRPLC system in its single-dimensional separation mode. Other than omitting the on-line SCX fractionation steps, the separation scheme was the same as that described above. A 7-tesla FT-ICR mass spectrometer (LTQ-FT, Thermo Electron, San Jose, CA) was used to collect the mass spectra. MS precursor ion scans (m/z 400 –2000) were acquired in full-profile mode (i.e. with
1126
Molecular & Cellular Proteomics 7.6
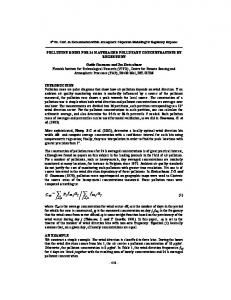
no base-line truncation) with an automatic gain control (AGC) target value of 1 ⫻ 106, a mass resolution of 1 ⫻ 105, and a maximum ion accumulation time of 1000 ms. Acquisition of an MS scan in fullprofile mode significantly increases the data size: one full LC/MS experiment would result in an MS result file (.raw file) exceeding 2 GB, which would not be handled in current Xcalibur software or other MS data analysis tools, such as ICR-2LS. We divided one full LC/MS experiments into six 30-min experiments by placing six MS acquisition sequences consecutively during an LC gradient. Each of the 30-min LC/MS files was ⬃1.5 GB in size. Despite the difficulties involved in dealing with large data sets, THRASH performed better with full-profile mode data and resulted in more monoisotopic masses especially for weak intensity peptide peaks. In such cases, base-line truncation, which removed the isotopic peaks just below the default threshold value from an isotope envelope, would result in incorrect monoisotopic masses or no monoisotopic mass at all. The mass spectrometer was operated in data-dependent tandem MS mode; the three most abundant ions detected in a precursor MS scan were dynamically selected for MS/MS experiments simultaneously incorporating a dynamic exclusion option (exclusion mass width low, 1.10 Th; exclusion mass width high, 2.10 Th; exclusion list size, 120; exclusion duration, 30 s) to prevent reacquisition of MS/MS spectra of the same peptides. Collision-induced dissociations of the precursor ions were performed in an ion trap (LTQ) with the collisional energy and isolation width set to 35% and 3 Th, respectively. The options “enable charge state screening,” “enable monoisotopic precursor selection,” and “charge state rejection enabled” were not used. The use of these parameters reduced to some extent the MS/MS data triggered by precursor ion measurements lacking isotopic distribution. Further discussion is provided in supplemental Table 1. The Xcalibur software package (Version 2.0 SR1, Thermo Electron) was used to construct the experimental methods. Database Search—All tandem mass spectrometric data (i.e. DTA files) were extracted using ExtractMSn (Version 3; creation date, July 18, 2006) of BioworksTM software (Version 3.2EF2, Thermo Electron), which determines values of the monoisotopic m/z and charge states of the precursor ions along with the values of m/z and the intensities of the fragment ions. Charge states from ⫹1 to ⫹8 were considered, and the precursor peptide mass range was set to 400 –10,000 Da. The MS/MS data were then searched against a composite database, containing either a human International Protein Index (IPI; Version 3.14) database and its reversed complements or Saccharomyces Genome Database (orf_trans.fasta) and its reversed complements, using SEQUEST (Version 27, Revision 12) on a Linux 14-node cluster system. The tolerance was set to 10 ppm or 0.1 Da for precursor ions and 1 Da for fragment ions. The maximum number of internal cleavage sites was set to 3, and variable modification options were used for the carbamidomethylation of cysteine (57.021460 Da), the oxidation of methionine (15.994920 Da), and the hydrolysis of asparagine (0.987000 Da). The search results were filtered using an estimated FP rate. The FP rate of peptide assignment was estimated through a composite target-decoy database search. The values of XCorr and the ⌬Cn threshold for the 1% FP rate were used to obtain peptide IDs. PE-MMR: Generation of Monoisotopic Mass—As displayed in Fig. 1, PE-MMR involves several steps of data analysis using MS (i.e. deisotoping and unique mass class clusterization) and MS/MS (i.e. filtration, correction, and refinement of tandem mass spectra). The PE-MMR method also includes database searching and validation of the peptide identification using the composite target-decoy method. Analysis of the large MS data sets arising from the LC/MS/MS experiments was performed in an automated manner using ICR-2LS (Proteomics Research Resource for Integrative Biology, National Center for Research Resources). The MS data were subjected directly as a batch to the ICR-2LS, and the isotopic distributions and charge
PE-MMR of MS/MS Data
LC/MS/MS (RPLC/LTQ-FT)
a MS data
MS/MS data BioworksTM
THRASH by ICR2LS
Monoisotopic Mass
DTA Files
Clusterization (in-house software)
Unique Mass Class(UMC) UMC mass
Monoisotopic Mass Filtering & Refinement (in-house software)
Filtered & Refined DTA Files Composite Target/Decoy Database Search
IDed Peptide List
FIG. 1. a, overall schematic representation of the PE-MMR process. b, an expanded schematic of the dotted box in a. A detailed description is provided in the text. IDed, identified.
b
DTA mass
UMC mass
Yes Match? No
Mass Correction
Mass Refinement
Corrected DTA masses UMC mass
Match?
Yes
Filtered & Refined DTA Files
No
Range Scanning Corrected DTA masses UMC mass
Match?
Yes
No
Filter-Out
states of the peptide ions in the mass spectra were deconvoluted using the THRASH algorithm developed by Horn et al. (14). The analysis results were recorded in a .pek file that contained the following information: spectrum number, charge states, abundances (or intensities), m/z values, and monoisotopic, average, and most abundant masses (supplemental Data 2, supplemental Fig. 1). We note that ions in high charge states (i.e. ⬎⫹6) were observed in large quantities; their masses were also obtained accurately from ICR-2LS analysis. PE-MMR uses the .pek file from an LC/MS/MS experiment to cluster MS peaks from a peptide into a unique mass class. In an LC/MS/MS experiment, a peptide MS peak emerged over a period of time during LC elution. Such mass spectral peaks that have similar monoisotopic masses (i.e. within the mass tolerance of 10 ppm) but different LC elution times can be grouped into a UMC. Ideally a peptide is represented by a UMC. The UMC concept was first introduced by Smith and co-workers at Pacific Northwest National Laboratory (15). All of the UMCs observed in an LC/MS/MS experiment were recorded in an extensibel markup language formatted (which we named a “UMC list”). We used a simple approach toward generating UMCs, basically through mass tolerance and the sequentiality of mass spectral peaks. Briefly when a monoisotopic mass value was
first measured in a mass spectrum, that mass was searched in subsequent scans at a mass tolerance of ⫾10 ppm; the sequential mass spectral peaks having similar masses were grouped into a UMC until there were no corresponding peaks for more than five consecutive mass spectra (i.e. sequential mass spectra with more than five consecutive “holes”). At least two scans were required to compose a UMC. Each UMC contained every mass spectral component having different charge states, abundances, and scan numbers but similar monoisotopic masses within the given mass tolerance (supplemental Data 2, supplemental Fig. 2). Fig. 2 indicates that the mass measurement accuracies (MMAs) of peptide ions (represented by black filled circles and open and black filled triangles) did not fluctuate significantly with respect to changes in the peptide intensities as they eluted from the LC. This situation was probably due to the AGC effectively maintaining the optimal number of ions trapped in the ICR cell, resulting in similar space charge effects that could be calibrated effectively. Experimentally, however, we still observed that the monoisotopic masses obtained when the corresponding mass spectral peaks had reached their maximum intensity tended to have better mass accuracies than those of the weaker mass spectral peaks (Fig. 2) (16). The mass spectral peaks
Molecular & Cellular Proteomics 7.6
1127
PE-MMR of MS/MS Data
FIG. 2. Utility of UMC masses. As peptides elute with different intensities (blue line), the MMA changed as represented by the black filled circles (⫹2 charge state) and open (⫹3 charge state) and filled (⫹4 charge state) triangles. The UMC mass, represented by a red line, is used to represent the peptide mass. A, two red filled triangles representing the mass measurement accuracies of the DTA masses and a mass spectrum displaying the isotopic distribution of the peptide when it was selected for CID; the open circle on the mass spectrum represents the theoretical isotopic distribution. B, two blue filled triangles representing the mass measurement accuracies of the DTA masses after 1.00235-Da correction; the original MS/MS data contained a precursor ion mass that corresponded to the isotopically substituted peak (labeled with an asterisk). The theoretical isotopic distribution of the peptide is represented by open circles. Diff., differently. of high intensity would give isotopic envelopes close to those predicted theoretically, and the mass transformation of high intensity MS peaks using THRASH would likely give high mass accuracy especially under the AGC in action. We used an intensity-weighted average mass value of all the component masses of a UMC to represent each UMC that we termed the “UMC mass” and expressed using the equation
冘 冘
Mi Ii
MUMC ⫽
i
Ii
(Eq. 1)
i
where MUMC is the UMC mass and Mi and Ii are the monoisotopic masses and intensities of the UMC components, respectively. The UMC masses (represented by the red line in Fig. 2) resulted in good mass measurement accuracy and were consistently better than those of the precursor ion masses recorded in MS/MS files (indicated by red or blue filled triangles). PE-MMR: Filtration of MS/MS Data—One of the major issues when using tandem mass spectra for accurate peptide identification is the inaccuracy in determining the monoisotopic masses of the precursor peptide ions selected for fragmentation. In conventional MS/MS experiments, a mass spectrometer performs “on-the-fly” data-dependent peak selection of a subset of precursor peptide ions from each MS acquisition. The problem, as illustrated in Fig. 3, is that the isotopic distributions (Fig. 3A) of a peptide measured consecutively in an LC/MS/MS experiment can deviate from the theoretical pattern (Fig. 3B). This non-statistical distribution, especially with a weak intensity MS peak, is due mainly to the small number of ions present during the MS acquisition. Therefore, depending on the time at which
1128
Molecular & Cellular Proteomics 7.6
the peptide was selected for fragmentation, the resultant MS/MS data can contain m/z values of either the first (i.e. monoisotopic peak or [M]) or second (i.e. [M ⫹ 1]) isotopic peak. In practice, this situation entails that MS/MS data from low resolution mass spectrometers (e.g. quadrupolar ion trap machines) be searched against a protein database at a relatively large mass tolerance (e.g. 3 Da) even through the mass accuracies might not be that poor. Use of high resolution mass spectrometers, such as FT-ICR systems, alleviates “wrong” peak picking. Nevertheless because of the nature of data-dependent LC/ MS/MS experiments with dynamic exclusion, in many cases peptides are selected at the very early stages of their elution when their intensities are too low to provide a well defined isotopic distribution. Any averagine-based deisotoping algorithm, such as THRASH, is prone to having errors in determining correct monoisotopic masses for such non-statistical isotopic distributions. This phenomenon introduces uncertainties to the monoisotopic mass values, and the resultant MS/MS data (i.e. in the DTA files for Thermo mass spectrometers) are prone to containing falsely determined monoisotopic mass information. As explained above, the UMC list comprises monoisotopic mass information that originated from a .pek file after mass transformation using the THRASH algorithm. Because of the nature of THRASH, where theoretical isotopic distributions corresponding to the masses of imaginary peptides composed of averagine are fitted iteratively to experimental distributions, monoisotopic masses can be computed only for precursor ions having well defined isotopic distributions (i.e. isotopic peak cluster distributions or isotope envelopes). Any mass spectral peaks having no isotopic distribution would not produce a monoisotopic mass through THRASH deisotoping (supplemental Data 2, supplemental Fig. 3). Therefore, if the precursor mass from a resultant MS/MS file is not found in the UMC list near its elution time,
PE-MMR of MS/MS Data
performs subtraction of multiples of 1.00235 Da (the mass difference between the adjacent isotopic peaks) from the neutral precursor mass to consider the case where the mass of an isotopically substituted peak was recorded in the MS/MS files. Peptides of high masses are likely to have their second, third, or even fourth isotope peak as their most abundant signal, and masses of isotopically substituted peaks are likely to be recorded in the resultant MS/MS files especially for those with weak intensity. Thus, PE-MMR performs mass subtraction of multiples of 1.00235 Da up to three times and uses all three precursor masses to find matches with UMC masses (mass correction). If no match is found after mass subtraction, PE-MMR uses all four precursor masses (i.e. the original plus three mass-corrected) and searches for matches in other nearby UMCs that contain scans of ⫾10 scan ranges (range scanning). This process is performed to account for the case where the low sensitivity of an ICR MS scan (compared with that of an ion trap MS/MS scan) causes the weak signals to be detected as noise (i.e. only one isotopic peak is above the noise level) even though a high quality MS/MS spectrum is still obtained. By performing range scanning, PE-MMR look for matches from ⫺10 scans prior to the MS/MS scan to ⫹10 scans after the MS/MS scan where higher intensity signals and, thereby, better isotopic distributions, if any, are obtained for the peptide MS peak. If still no match is found after the range scanning, PE-MMR filters out the MS/MS file. This process of PE-MMR can, therefore, not only correct wrong peak picking but also improve the mass measurement accuracy of the precursor ions by using the UMC mass, a representative mass for a collection of monoisotopic mass information from multiple MS spectra with more weight placed on higher intensity isotopic distributions instead of individual MS spectra (Fig. 2). RESULTS
FIG. 3. A, example of the changing isotopic distribution of a peptide MS peak in consecutive MS scans. The first spectrum was referenced to trigger MS/MS. The precursor mass of the corresponding MS/MS file (i.e. DTA file) is indicated in red, and the monoisotopic masses in the subsequent scans are in black. B, theoretical isotopic distribution of the peptide. The experimental distributions agree better with the theoretical distribution as their intensities increase. In most cases, MS/MS was performed at the early stages of the elution of a peptide where the experimental distribution deviated significantly from the theoretical distribution and often resulted in incorrect monoisotopic masses being assigned to the resultant MS/MS data. the parent ions are likely to have no isotopic distribution and, thus, are probably noise. These nonpeptide-like species (i.e. chemical or electrical noise) are expected to result in tandem mass spectra of poor quality. In contrast, peptide peaks having well defined isotope envelopes, for which THRASH will result in monoisotopic masses, will find their matches with the UMC mass. This argument leads to the intriguing possibility of using the UMC mass to filter out “garbage” tandem mass spectra. The MS/MS data obtained from the LTQ-FT instrument (.raw file) were converted to a certain format (e.g. DTA). The MS/MS formats contained the MS/MS scan numbers, their charge states (from ⫹1 to ⫹8), their monoisotopic m/z (corresponding to [M ⫹ H]⫹), and their fragment ion masses and corresponding mass spectral intensities (supplemental Data 2, supplemental Fig. 4). To filter out garbage MS/MS files, the PE-MMR compares the neutral mass (i.e. [M]) of the MS/MS file with the UMC mass. If a match is found within a tolerance of ⫾25 ppm, as shown in Fig. 1b, PE-MMR replaces the precursor mass of the MS/MS file with the UMC mass (mass refinement). If no match is found, PE-MMR
Effect and Efficiency of PE-MMR—Application of PE-MMR to the SCX RPLC/MS/MS data from the yeast sample resulted in reduction of the number of MS/MS files by an average of 30% relative to the original number of MS/MS files (supplemental Data 1). It is worth noting that the PE-MMR process considers the precursor masses after subtraction of multiples of 1.00235 Da (up to three times) to obtain a match; thereby, the effective filtration rate is far greater. To take the possibility of incorrect peak selection fully into account, each original DTA was subjected to subtraction of multiples of 1.00235 Da up to three times when the precursor mass was not directly matched to any UMC masses. This process increased the total number of the DTA files by an average of 2.8-fold (supplemental Data 1). PE-MMR takes all of these DTAs into account to find matches with UMC masses and results in the final MS/MS files (i.e. the filtered and refined DTA files). In total, 57.1% of the final MS/MS files after PE-MMR resulted from direct matching to UMC masses, and their precursor masses were replaced by UMC masses. Mass correction and range scanning processes contributed 10.4 and 32.5% of the final MS/MS files, respectively. Overall the rate of reduction of the DTA files was, in fact, greater than 75% (supplemental Data 1). We also note that the mass correction and range scanning processes can introduce multiple (or redundant) MS/MS files for a single MS/MS scan in the final MS/MS files. We observed that ⬃2.7% of the final MS/MS files were redundant. Although this situation might in theory affect the downstream target-decoy processes, we observed that only
Molecular & Cellular Proteomics 7.6
1129
PE-MMR of MS/MS Data
FIG. 4. Comparison of the results from composite target-decoy database searches of the original MS/MS spectra with 0.1-Da mass tolerance (A), PE-MMR-filtered MS/MS spectra with 0.1-Da mass tolerance (B), and mass-calibrated and PE-MMR-filtered MS/MS spectra with 10-ppm mass tolerance (C). The thresholds of XCorr and ⌬Cn are given in the tables. The PE-MMR-filtered DTAs display increased bias toward target hits of top ranked peptides, whereas the remaining lower ranked peptides were distributed equally between the target and decoy databases. CS, charge state; NTT, number of tryptic termini.
one MS/MS scan suggested two peptide sequences (of 7299 peptides) in the final peptide IDs obtained within an FP rate of 1% (see below) and that PE-MMR eventually removed the one having the lower XCorr score. To evaluate the efficiency of PE-MMR in peptide identification, we compared the target-decoy database search results from PE-MMR-filtered MS/MS files (Fig. 4B) with those from the original MS/MS files (Fig. 4A). The mass tolerance for both searches was 0.1 Da. As demonstrated earlier by Elias and Gygi (1), the top ranked matches exhibit a strong bias toward the target hits (i.e. peptide identification from a normal protein sequence) over decoy hits (i.e. peptide identification from a reverse protein sequence), whereas other low ranked matches are equally distributed between target and decoy hits. After PE-MMR, the bias toward target hits increased significantly from 57.8 to 62.4%. Assuming that the removed MS/MS files after PE-MMR would have resulted in complete random matches and resulted in equally distributed target and decoy hits, we would have predicted the portion of target hits in the top ranked matches to be 61.2%, which is close to our observed value. This observation strongly suggests that the PE-MMR process effectively removed the MS/MS data of random peptide identification. The increased bias provided by PE-MMR toward target hits of the top ranked matches should
1130
Molecular & Cellular Proteomics 7.6
improve the uncertainties involved in large scale peptide identifications when using the target-decoy method. The most important aspect of PE-MMR is the correction and refinement of precursor masses to UMC masses. Fig. 5 presents the effect of PE-MMR on large scale proteomics experiments. Fig. 5A displays the distribution of XCorr scores and MMAs of the resultant PSMs using the original MS/MS files and a mass tolerance of 0.1 Da for the composite targetdecoy database search. At an FP rate of 1%, this search resulted in 6529 unique peptides. It is apparent from Fig. 5A that the original MS/MS data exhibited a broad distribution of MMAs with the offset toward positive mass accuracy (i.e. the experimental mass values were larger than the theoretical ones). After PE-MMR, however, the distribution (Fig. 5B) narrowed significantly in MMA but still exhibited a positive MMA offset of approximately ⫹4.2 ppm. Most of the target hits were within a mass accuracy of ⫾10 ppm, unlike the results of the original MS/MS data. Despite using fewer MS/MS files, the PE-MMR-filtered MS/MS files resulted in more target hits than did the original MS/MS files under the same conditions (i.e. a 0.1-Da mass tolerance and a 1% FP rate). The observation of most target hits being within ⫾10 ppm with a positive MMA offset (Fig. 5B) led us to calibrate the precursor masses of the PE-MMR-filtered MS/MS files prior
PE-MMR of MS/MS Data
FIG. 5. Comparison of distributions of PSMs. Composite target-decoy database searches were performed using the original MS/MS files and a mass tolerance of 0.1 Da (A), PE-MMR-filtered MS/MS files and a mass tolerance of 0.1 Da (B), and mass-calibrated and PE-MMRfiltered MA/MS files and a mass tolerance of 10 ppm (C). D, using the PE-MMR method resulted in an increased number of unique peptides with increased mass measurement accuracies. The mass accuracy for the 7299 unique peptides identified by PE-MMR method was 0.05 ⫾ 1.49 ppm; the mass accuracy for the 6529 unique peptides identified using the conventional method was 4.46 ⫾ 2.81 ppm.
to database searching (i.e. by ⫺4.2 ppm) and to use a smaller mass tolerance (i.e. 10 ppm instead of 0.1 Da) for the database search. Fig. 5C displays the distribution of PSMs within an FP rate of 1% under these conditions. The observed average MMA of this distribution improved to 0.05 ⫾ 1.49 ppm. Once again, despite using fewer MS/MS files, the application of PE-MMR resulted in 12% more peptide matches. Upon the removal of garbage MS/MS files and a tighter mass tolerance after PE-MMR, lower values of XCorr and ⌬Cn were required to maintain the same FP rate compared with those needed when the original MS/MS files and a 0.1-Da mass tolerance were used. This feature is also evidenced by the increased bias toward target hits under these conditions (Fig. 4C). We also observed that a significant portion of the target hits were the result of mass correction (i.e. mass correction by multiples of 1.00235). Indeed 17% of the total PE-MMRfiltered MS/MS files that provided positive hits within an FP rate of 1% had been mass-corrected using multiples of
1.00235 Da. Without the mass correction by PE-MMR, these signals would not have resulted in correct peptide identifications within a mass tolerance of 10 ppm. Thus, it is likely that precursor ion mass correction also contributed to the increased number of identified peptides when using the PEMMR method. A close inspection on the 965 peptides identified only using the original MS/MS data suggests that most of the MS/MS data were filtered out during PE-MMR processing because of the lack of matching between the UMC masses and the precursor ion masses within the mass tolerance of 25 ppm. The formation of a UMC requires the mass to be found in two MS scans within five MS scans; some of the weak peptides appeared in just one MS scan or in a few MS scans but failed to provide correct monoisotopic information because of their weak intensities. Under these circumstances, PE-MMR will fail to find a match of the corresponding precursor mass with the UMC mass, leading to unwanted filtration. In some cases, the MS/MS data were filtered in by PE-MMR,
Molecular & Cellular Proteomics 7.6
1131
PE-MMR of MS/MS Data
FIG. 6. Comparison of peptide IDs obtained through LC/MS/MS experiments on glycopeptide-enriched plasma samples. Results of composite target-decoy database searches were used; the FP rate was 1%. A mass accuracy of 0.2 ⫾ 3.3 ppm for common peptides was obtained by using PE-MMR-filtered MS/MS files where precursor masses were corrected and refined. The mass accuracy for common peptides obtained using the original MS/MS data was 3.8 ⫾ 5.8 ppm.
but their mass accuracies (i.e. the UMC mass accuracies) were not sufficiently high to result in correct peptide matches within the mass tolerance of 10 ppm required for database searching. Application of PE-MMR to Glycopeptide Analyses—Glycocaptured peptides undergo deglycosylation during the sample preparation process, transforming their glycosylated asparagine units into aspartic acid residues. This modification is identified by a SEQUEST search with variable modification on asparagine. The mass difference between the two amino acids, 0.987 Da, is close to the mass difference (1.00235 Da) between the adjacent isotope peaks. Thus, if an original MS/MS file contains an isotopically substituted precursor ion mass value, a SEQUEST search with variable modification on asparagine is likely to identify the peptide in question as a monoisotopic species containing aspartic acid to which the asparagine unit of a glycosylated peptide was converted. PE-MMR should alleviate this problem, if not remove it completely, by correctly assigning the monoisotopic masses of MS/MS files. Fig. 6 compares the results of composite targetdecoy database searches using the LC/MS/MS data of glycopeptide-enriched samples from human sera using two different methods: 1) the PE-MMR-filtered and mass-calibrated MS/MS files having a mass tolerance of 10 ppm (PE-MMR method) and 2) the original MS/MS files having a mass tolerance of 0.1 Da (conventional method). Within the same FP rate of 1%, the PE-MMR method identified 41% more peptides than did the conventional method using the original MS/MS files. The 763 peptides that were identified only when using the PE-MMR-filtered MS/MS files had better average MMA (0.35 ⫾ 3.42 ppm) than did those identified using the original MS/MS files (9.36 ⫾ 7.94 ppm). Interestingly the PEMMR-filtered MS/MS files predominantly identified glycopeptides having the correct sequence motif NX(S/T), which is the
1132
Molecular & Cellular Proteomics 7.6
unique N-linked glycosylation site in proteins (where X could be any amino acid except proline). In contrast, 75% of the 314 peptides that were identified using the conventional method only were false glycopeptides that lacked the N-glycosylation motifs. A close inspection of the results indicated that 110 of the 314 “original-only” peptides shared their scan numbers with the peptides identified using PE-MMR only. In other words, the two methods resulted in “different” peptides for these 110 MS/MS files after target-decoy database searching. As indicated in supplemental Data 3, in which the annotated MS/MS spectra obtained by both conventional and PE-MMR methods are compared, 108 of 110 MS/MS spectra suggested the same peptide sequences but different Asn modifications. In 101 scans (92%) of the 110 MS/MS spectra, the PE-MMR method resulted in the glycopeptides having Asn modification on the correct sequence motif, NX(S/T); the original MS/MS data resulted in a glycopeptide having the correct sequence motif in only one of these MS/MS spectra. The remaining cases resulted in either both of the identified glycopeptides having incorrect sequence motif (seven scans) or glycopeptides for which the structure could not be determined by sequence or annotated spectra (one scan). One of the 110 peptide sequences was found to be incorrect after manual inspection of the annotated MS/MS spectra (supplemental Data 3), supporting an FP rate of 1% for identifying peptides. Without mass correction, however, of the precursor ion masses of the MS/MS files, where masses of isotopically substituted peaks were recorded rather than true monoisotopic masses, the SEQUEST algorithm falsely recognized the peptides as glycopeptides in which the N-glycosylated asparagine units had been converted to aspartic acid residues. It is worth noting that extra care needs to be taken when analyzing LC/MS/MS data with variable modification of a mass difference of less than 1 Da with the current “patternmatch” type peptide identification and the subsequent statistical evaluation of the resultant scores. As indicated in the many examples provided in supplemental Data 3, the annotated MS/MS spectra by both the conventional method and the PE-MMR methods exhibit highly confident peptide identifications. A SEQUEST search with a fragment mass tolerance of 1 Da cannot distinguish between the two fragments that differ by one glycosylation (supplemental Data 3). Reducing the mass tolerance to 0.5 Da might alleviate this issue but with significantly reduced peptide IDs and decreased XCorr scores. A better way of addressing this issue would be to accurately assign the precursor ion mass to the corresponding MS/MS file because these two peptides differ in mass by ⬃1 Da. The use of PE-MMR significantly improved the accuracy of the glycopeptide identifications by correctly assigning accurate monoisotopic masses to their corresponding MS/MS data prior to performing database search. Another modification resulting in a mass difference of less than 1 Da is the substitution of asparagine by an isoleucine or leucine. One example is shown in the 23rd comparison in supplemental
PE-MMR of MS/MS Data
Data 3: the conventional method using the original DTA resulted in ENVLTQSPGTLSLSPGER, whereas the PE-MMR method identified EIVLTQSPGTLSLSPGER. The mass difference between asparagine and isoleucine is 0.9588643. Once again, a SEQUEST search failed to distinguish between these two peptides in terms of their fragmentation patterns in the MS/MS spectrum until the accurate precursor mass was given.
was obtained through summation of the intensities of all of the components in the UMC. The highly confident peptide IDs can, therefore, be related to the quantitative information of the UMC that we will use for future label-free protein quantification. Also, as shown in Fig. 5, PE-MMR lost 965 peptide IDs while gaining 1735 IDs. We are currently investigating methods, such as implementation of MS/MS quality assessment (17), to recover MS/MS data that were of good quality but were removed during the PE-MMR process.
DISCUSSION
We have developed a new method, PE-MMR, for analyzing tandem mass spectrometric data. The PE-MMR method comprises several steps of analyzing both MS and MS/MS data. We have demonstrated the efficacy and benefits of the PE-MMR method through its application to the analysis of SCX-fractionated yeast tryptic peptides and glycopeptide mixtures enriched from human sera, both of which resulted in increased information content and accuracy. PE-MMR uses filtration of tandem mass spectral data using accurate precursor ion masses, represented as UMC masses, resulting in an improved peptide identification confidence in large scale proteomics. Recently Gygi and co-workers (9) extracted monoisotopic mass information from isotopic envelopes and used it for database searching. After a first round of composite target-decoy database searching with a relatively large mass tolerance of 50 ppm, they filtered the peptide identification by applying a narrow mass measurement accuracy of 8 ppm to a vastly decreased FP rate. PE-MMR provides a similar improvement in the FP rate (cf. Figs. 4 – 6) through increasing the peptide IDs by prefiltering the DTA files that are likely to cause random peptide hits, resulting in a stronger bias toward target peptide hits over decoy hits and decreasing the FP rates. The PE-MMR approach provides two other benefits: improved throughput of large scale proteomics data analyses (by removing noninformative garbage DTA files prior to database searching) and, even more importantly, enabling the use of reduced mass tolerance with increased precursor ion mass accuracy; together these features decrease the database search times, whereas the latter also increased the accuracy of peptide identification. An average of 30% of the original DTA files were filtered out for the case of yeast proteome data, whereas the experimental mean and S.D. of the MMA distributions of the peptides identified using the PE-MMRfiltered DTA files were 0.05 and 1.49 ppm, respectively. Together these findings contributed to the decreased number of false positives and, thereby, the increased number of identified peptides for a given FP rate (e.g. 1%) despite the smaller number of tandem mass spectra used for database searching. Although the label-free protein quantification approach was not the focus of this study, we note that the UMC contains quantitative information for each peptide, namely the “SumIntensity” in supplemental data 2, supplemental Fig. 2E that
* This work was supported by 21C Frontier for Functional Proteomics Grant FPR05A1-400. The costs of publication of this article were defrayed in part by the payment of page charges. This article must therefore be hereby marked “advertisement” in accordance with 18 U.S.C. Section 1734 solely to indicate this fact. □ S The on-line version of this article (available at http://www. mcponline.org) contains supplemental material. § These authors contributed equally to this work. ** To whom correspondence should be addressed. Tel.: 82-23290-3603; Fax: 82-2-3290-3121; E-mail:
[email protected]. REFERENCES 1. Elias, J. E., and Gygi, S. P. (2007) Target-decoy search strategy for increased confidence in large-scale protein identifications by mass spectrometry. Nat. Methods 4, 207–214 2. Keller, A., Nesvizhskii, A. I., Kolker, E., and Aebersold, R. (2002) Empirical statistical model to estimate the accuracy of peptide identifications made by MS/MS and database search. Anal. Chem. 74, 5383–5392 3. Venable, J. D., and Yates, J. R., III (2004) Impact of ion trap tandem mass spectra variability on the identification of peptides. Anal. Chem. 76, 2928 –2937 4. Elias, J. E., Haas, W., Faherty, B. K., and Gygi, S. P. (2005) Comparative evaluation of mass spectrometry platforms used in large-scale proteomics investigations. Nat. Methods 2, 667– 675 5. Wong, J. W. H., Sullivan, M. J., Cartwright, H. M., and Cagney, G. (2007) msmsEval: tandem mass spectral quality assignment for high-throughput proteomics. BMC Bioinformatics 8, 51 6. Sadygov, R. G., Eng, J., Durr, E., Saraf, A., McDonald, H., MacCoss, M. J., and Yates, J. R., III (2002) Code developments to improve the efficiency of automated MS/MS spectra interpretation. J. Proteome Res. 1, 211–215 7. Nesvizhskii, A. I., Roos, F. F., Grossmann, J., Vogelzang, M., Eddes, J. S., Gruissem, W., Baginsky, S., and Aebersold, R. (2006) Dynamic spectrum quality assessment and iterative computational analysis of shotgun proteomic data: toward more efficient identification of post-translational modifications, sequence polymorphisms, and novel peptides. Mol. Cell. Proteomics 5, 652– 670 8. Olsen, J. V., Ong, S.-E., and Mann, M. (2004) Trypsin cleaves exclusively C-terminal to arginine and lysine residues. Mol. Cell. Proteomics 3, 608 – 614 9. Beausoleil, S. A., Villen, J., Gerber, S. A., Rush, J., and Gygi, S. P. (2006) A probability-based approach for high-throughput protein phosphorylation analysis and site localization. Nat. Biotechnol. 24, 1285–1299 10. Venable, J. D., Xu, T., Cociorva, D., and Yates, J. R., III (2006) Crosscorrelation algorithm for calculation of peptide molecular weight from tandem mass spectra. Anal. Chem. 78, 1921–1929 11. Kim, M.-S., Choie, W.-S., Shin, Y. S., Yu, M.-H., and Lee, S.-W. (2004) Development of ultra-high pressure capillary reverse-phase liquid chromatography/tandem mass spectrometry for high-sensitive and highthroughput proteomics. Bull. Korean Chem. Soc. 25, 1833–1839 12. Zhang, H., Li, X., Martin, D. B., and Aebersold, R. (2003) Identification and quantification of N-linked glycoproteins using hydrazide chemistry, stable isotope labeling and mass spectrometry. Nat. Biotechnol. 21, 660 – 666 13. Min, H.-K., Hyung, S.-W., Shin, J.-W., Nam, H. S., Ahn, S. H., Jung, H. J., and Lee, S.-W. (2007) Ultrahigh-pressure dual on-line solid phase extraction/capillary reverse-phase liquid chromatography/tandem mass
Molecular & Cellular Proteomics 7.6
1133
PE-MMR of MS/MS Data
spectrometry (DO-SPE/cRPLC/MS/MS): A versatile separation platform for high-throughput and highly sensitive proteomic analyses. Electrophoresis 28, 1012–1021 14. Horn, D. M., Zubarev, R. A., and McLafferty, F. W. (2000) Automated reduction and interpretation of high resolution electrospray mass spectra of large molecules. J. Am. Soc. Mass Spectrom. 11, 320 –332 15. Zimmer, J. S. D., Monroe, M. E., Qian, W.-J., and Smith, R. D. (2006) Advances in proteomics data analysis and display using an accurate
1134
Molecular & Cellular Proteomics 7.6
mass and time tag approach. Mass Spectrom. Rev. 25, 450 – 482 16. Olsen, J. V., de Godoy, L. M. F., Li, G., Macek, B., Mortensen, P., Pesch, R., Makarov, A., Lange, O., Horning, S., and Mann, M. (2005) Parts per million mass accuracy on an Orbitrap mass spectrometer via lock mass injection into a C-trap. Mol. Cell. Proteomics 4, 2010 –2021 17. Na, S. J., and Paek, E. (2006) Quality assessment of tandem mass spectra based on cumulative intensity normalization. J. Proteome Res. 5, 3241–3248