Performance Analysis of Connectionist Paradigms for Modeling Chaotic Behavior of Stock Indices Ajith Abraham1, Ninan Sajith Philip2, Baikunth Nath3, P. Saratchandran4 1
Faculty of Information Technology, School of Business Systems, Monash University, Clayton, Victoria 3168, Australia, Email:
[email protected] 2
Department of Physics, Cochin University of Science and Technology, Kerala 682022, India, Email:
[email protected]
3
Department of Computer Science and Software Engineering. The University of Melbourne, Victoria 3010, Australia, Email:
[email protected] 4
School of Electrical and Electronic Engineering, Nanyang Technological University, Singapore 639798, Email:
[email protected]
Abstract The use of intelligent systems for stock market predictions has been widely established. In this paper, we investigate how the seemingly chaotic behavior of stock markets could be well represented using several connectionist paradigms and soft computing techniques. To demonstrate the different techniques, we considered Nasdaq-100 index of Nasdaq Stock MarketSM and the S&P CNX NIFTY stock index. We analyzed 7 year’s Nasdaq 100 main index values and 4 year’s NIFTY index values. This paper investigates the development of a reliable and efficient technique to model the seemingly chaotic behavior of stock markets. We considered an artificial neural network trained using Levenberg-Marquardt algorithm, Support Vector Machine (SVM), Takagi-Sugeno neuro-fuzzy model and a Difference Boosting Neural Network (DBNN). This paper briefly explains how the different connectionist paradigms could be formulated using different learning methods and then investigates whether they can provide the required level of performance, which are sufficiently good and robust so as to provide a reliable forecast model for stock market indices. Experiment results reveal that all the connectionist paradigms considered could represent the stock indices behavior very accurately. Key words: connectionist paradigm, support vector machine, neural network, difference boosting, neuro-fuzzy, stock market.
1. Introduction During the last decade, stocks and futures traders have come to rely upon various types of intelligent systems to make trading decisions [1]. Several intelligent systems have in recent years been developed for modelling expertise, decision support and complicated automation tasks etc. In this paper, we analysed the seemingly chaotic behaviour of two well-known stock indices namely Nasdaq-100 index of NasdaqSM [9] and the S&P CNX NIFTY stock index [10]. Nasdaq-100 index reflects Nasdaq's largest companies across major industry groups, including computer hardware and software, telecommunications, retail/wholesale trade and biotechnology [9]. The Nasdaq-100 index is a modified capitalization-weighted index, which is designed to limit domination of the Index by a few large stocks while generally retaining the capitalization ranking of companies. Through an investment in Nasdaq-100 index tracking stock, investors can participate in the collective performance of many of the Nasdaq stocks that are often in the news or have become household names. Similarly, S&P CNX NIFTY is a well-diversified 50 stock index accounting for 25 sectors of the economy [10]. It is used for a variety of purposes such as benchmarking fund portfolios, index based derivatives and index funds. The CNX Indices are computed using market capitalisation weighted method, wherein the level of the Index reflects the total market value of all the stocks in the index relative to a particular base period. The method also takes into account constituent changes in the index and importantly corporate actions such as stock splits, rights, etc without affecting the index value.
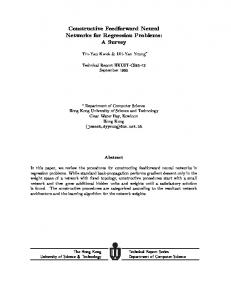
Figure 1. Training and test data sets for Nasdaq-100 Index Our research is to investigate the performance analysis of four different connectionist paradigms for modelling the Nasdaq-100 and NIFTY stock market indices. The four different techniques considered are an artificial neural network trained using the Levenberg-Marquardt algorithm [3], support vector machine [12], difference boosting neural network [11] and a Takagi-Sugeno fuzzy inference system learned using a neural network algorithm (neurofuzzy model) [6]. Neural networks are excellent forecasting tools and can learn from scratch by adjusting the interconnections between layers. Support vector machines offer excellent learning capability based on statistical learning theory. Fuzzy inference systems are excellent for decision making under uncertainty. Neuro-fuzzy computing is a popular framework wherein neural network training algorithms are used to fine-tune the parameters of fuzzy inference systems. We analysed the Nasdaq-100 index value from 11 January 1995 to 11 January 2002 [9] and the NIFTY index from 01 January 1998 to 03 December 2001 [10]. For both the indices, we divided the entire data into almost two equal parts. No special rules were used to select the training set other than ensuring a reasonable representation of the parameter space of the problem domain. The complexity of the training and test data sets for both indices are depicted in Figures 1 and 2 respectively. In Section 2 we briefly describe the different connectionist paradigms followed by experimentation setup and results in Section 3. Some conclusions are also provided towards the end.
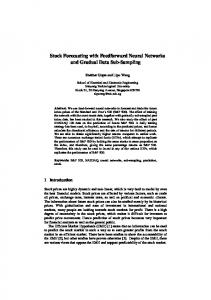
Figure 2. Training and test data sets for NIFTY index
2. Connectionist Paradigms Connectionist models “learn” by adjusting the interconnections between layers. When the network is adequately trained, it is able to generalize relevant output for a set of input data. Learning typically occurs by example through training, where the training algorithm iteratively adjusts the connection weights (synapses). In an artificial neural network learning occurs by the iterative updating of connection weights using a learning algorithm. ANN - Levenberg - Marquardt (LM) Algorithm When the performance function has the form of a sum of squares, then the Hessian matrix can be approximated to H = J T J ; and the gradient can be computed as g = J T e , where J is the Jacobian matrix, which contains first derivatives of the network errors with respect to the weights, and e is a vector of network errors. The Jacobian matrix can be computed through a standard backpropagation technique that is less complex than computing the Hessian matrix. The LM algorithm uses this approximation to the Hessian matrix in the following Newton-like update: xk + 1 = xk − [ J T J + µI ] −1 J T e
When the scalar µ is zero, this is just Newton's method, using the approximate Hessian matrix. When µ is large, this becomes gradient descent with a small step size. As Newton's method is more accurate, µ is decreased after each successful step (reduction in performance function) and is increased only when a tentative step would increase the performance function. By doing this, the performance function will always be reduced at each iteration of the algorithm [3] [8]. Support Vector Machines (SVM) The foundations of SVM have been developed by Vapnik [12] and are gaining popularity due to many attractive features, and promising empirical performance. The possibility of using different kernels allows viewing learning methods like Radial Basis Function Neural Network (RBFNN) or multi-layer Artificial Neural Networks (ANN) as particular cases of SVM despite the fact that the optimized criteria are not the same [7]. While ANNs and RBFNN optimizes the mean squared error dependent on the distribution of all the data, SVM optimizes a geometrical criterion, which is the margin and is sensitive only to the extreme values and not to the distribution of the data into the feature space. The SVM approach transforms data into a feature space F that usually has a huge dimension. It is interesting to note that SVM generalization depends on the geometrical characteristics of the training data, not on the dimensions of the input space. Training a support vector machine (SVM) leads to a quadratic optimization problem with bound constraints and one linear equality constraint. Vapnik [12] shows how training a SVM for the pattern recognition problem leads to the following quadratic optimization problem l 1 l l Minimize: W (α ) = −∑ α i + ∑ ∑ y i y jα iα j k ( xi , x j ) (1) 2 i =1 j =1 i −1 l
Subject to
∑ y iα i
(2)
i =1
∀i : 0 ≤ α i ≤ C
Where l is the number of training examples α is a vector of l variables and each component α i corresponds to a training example (xi, yi). The solution of (1) is the vector α for which (1) is minimized and (2) is fulfilled. We used the SVMTorch for simulating the SVM learning algorithm [5]. *
Neuro-fuzzy System Neuro Fuzzy (NF) computing is a popular framework for solving complex problems [2]. If we have knowledge expressed in linguistic rules, we can build a Fuzzy Inference System (FIS) [4], and if we have data, or can learn from a simulation (training) then we can use ANNs. For building a FIS, we have to specify the fuzzy sets, fuzzy operators and the knowledge base. Similarly for constructing an ANN for an application the user needs to specify the architecture and learning algorithm. An analysis reveals that the drawbacks pertaining to these approaches seem complementary and therefore it is natural to consider building an integrated system combining the concepts. While the learning capability is an advantage from the viewpoint of FIS, the formation of linguistic rule base will be advantage from the viewpoint of ANN. We used the Adaptive Neuro Fuzzy Inference System (ANFIS)
implementing a Takagi-Sugeno type FIS [6]. ANFIS makes use of a mixture of backpropagation to learn the premise parameters and least mean square estimation to determine the consequent parameters of the Takagi-Sugeno type fuzzy if-then rule. The learning procedure has two parts: In the first part the input patterns are propagated, and the optimal conclusion parameters are estimated by an iterative least mean square procedure, while the antecedent parameters (membership functions) are assumed to be fixed for the current cycle through the training set. In the second part the patterns are propagated again, and in this epoch, backpropagation is used to modify the antecedent parameters, while the conclusion parameters remain fixed. This procedure is then iterated. Difference Boosting Neural Network (DBNN) DBNN is based on the Bayes principle that assumes the clustering of attribute values while boosting the attribute differences [11]. Boosting is an iterative process by which the network places emphasis on misclassified examples in the training set until it is correctly classified. The method considers the error produced by each example in the training set in turn and updates the connection weights associated to the probability P (UmCk) of each attribute of that example (Um is the attribute value and Ck a particular class in k number of different classes in the dataset). In this process, the probability density of identical attribute values flattens out and the differences get boosted up. Instead of the serial classifiers used in the AdaBoost algorithm, DBNN approach uses the same classifier throughout the training process. An error function is defined for each of the miss classified examples based on it distance from the computed probability of its nearest rival. The enhancement to the attribute is done such that the error produced by each example decides the correction to its associated weights. Since it is likely that more than one class would be sharing at least some of the same attribute values, this would lead to competitive update of their attribute weights, until either the classifier figures out the correct class or the number of iterations are completed. The net effect of this would be that the classifier would become more and more dependent on the differences in the examples rather than their similarities.
3. Experimentation Setup and Results We considered 7 year’s stock data for Nasdaq-100 Index and 4 year’s for NIFTY index. Our target is to develop efficient forecast models that could predict the index value of the following trade day based on the opening, closing and maximum values of the same on a given day. The training and test patterns for both the indices (scaled values) are illustrated in Figures 1 and 2. For the Nasdaq-100index the data sets were represented by the ‘opening value’, ‘low value’ and ‘high value’. NIFTY index data sets were represented by ‘opening value’, ‘low value’, ‘high value’ and ‘closing value’. We used the same training and test data sets to evaluate the different connectionist models. More details are reported in the following sections. Experiments were carried out on a Pentium IV, 1.5 GHz Machine with 256 MB RAM and the codes were executed using MATLAB (ANN, ANFIS) and C++ (SVM, DBNN). Test data was presented to the trained connectionist network and the output from the network was compared with the actual index values in the time series. •
ANN – LM algorithm
We used a feedforward neural network with 4 input nodes and a single hidden layer consisting of 26 neurons. We used tanh-sigmoidal activation function for the hidden neurons. The training was terminated after 50 epochs and it took about 4 seconds to train each dataset. •
Neuro-fuzzy training
We used 3 triangular membership functions for each of the input variable and the 27 if-then fuzzy rules were learned for the Nasdaq-100 index and 81 if-then fuzzy rules for the NIFTY index. Training was terminated after 12 epochs and it took about 3 seconds to train each dataset. •
Support Vector Machines and Difference Boosting Neural Network
SVM generated 363 support vectors during the training. For training the DBNN, the data was sub-sampled to 99 levels. Sub-sampling was done to manage the memory efficiently. Both SVM and DBNN took less than 1 second to learn the two data sets. •
Performance and Results Achieved
Table 1 summarizes the training and test results achieved for the two stock indices using the four different approaches. Figures 3 and 4 depict the test results for the one-day ahead prediction of Nasdaq-100 index and NIFTY index respectively.
Figure 3. Test results showing the performance of the different methods for modeling Nasdaq-100 index
Figure 4. Test results showing the performance of the different methods for modeling NIFTY index Table 1: Empirical comparison of four learning methods for two stock indices SVM
Neuro-Fuzzy
ANN-LM
DBNN
Training results (RMSE) Nasdaq-100
0.02612
0.02210
0.02920
0.02929
NIFTY
0.01734
0.01520
0.01435
0.0174
Testing results (RMSE) Nasdaq-100
0.01804
0.01830
0.02844
0.02864
NIFTY
0.01495
0.01271
0.01227
0.02252
4. Conclusions In this paper, we have demonstrated how the chaotic behavior of stock indices could be well represented by connectionist paradigms. Empirical results on the two data sets using four different models clearly reveal the efficiency of the proposed techniques. In terms of RMSE values (generalization), for Nasdaq-100 index, SVM performed marginally better than other models and for NIFTY index ANN-LM approach gave the lowest generalization RMSE values. For both data sets, SVM and DBNN have the lowest training time. Our research was to predict the index value for the following trade day based on the opening, closing and maximum values of the same on a given day. Our experimentation results indicate that the most prominent parameters that affect share indices are their immediate opening and closing values. The fluctuations in the share market are chaotic in the sense that they heavily depend on the values of their immediate forerunning fluctuations. Long-term trends exist, but are slow variations and this information is useful for long-term investment strategies. Our study focus on short term, on floor trades, in which the risk is higher. However, the results of our study show that even in the seemingly random fluctuations, there is an underlying deterministic feature that is directly enciphered in the opening, closing and maximum values of the index of any day making predictability possible.
References [1]
Abraham A., Nath B. and Mahanti P.K., Hybrid Intelligent Systems for Stock Market Analysis, Computational Science, LNCS 2074, Springer-Verlag Germany, Alexandrov V.N. et al (Editors), USA, pp. 337-345, May 2001.
[2]
Abraham A., Neuro-Fuzzy Systems: State-of-the-Art Modeling Techniques, Connectionist Models of Neurons, Learning Processes, and Artificial Intelligence, LNCS 2084, Springer Verlag Germany, Mira J et al (Eds.), Spain, pp. 269-276, 2001.
[3]
Bishop C.M., Neural Networks for Pattern Recognition, Oxford: Clarendon Press, 1995.
[4]
Cherkassky V., Fuzzy Inference Systems: A Critical Review, Computational Intelligence: Soft Computing and Fuzzy-Neuro Integration with Applications, Kayak O. et al (Eds.), Springer Verlag, Germany, pp.177-197, 1998.
[5]
Collobert R. and Bengio S., SVMTorch: Support Vector Machines for Large-Scale Regression Problems, Journal of Machine Learning Research, vol 1, pages 143-160, 2001. ftp://ftp.idiap.ch/pub/learning/SVMTorch.tgz
[6]
Jang J.S.R., Sun C.T. and Mizutani E., Neuro-Fuzzy and Soft Computing: A Computational Approach to Learning and Machine Intelligence, Prentice Hall Inc, USA, 1997.
[7]
Joachims T., Making large-Scale SVM Learning Practical. Advances in Kernel Methods - Support Vector Learning, B. Schölkopf and C. Burges and A. Smola (Eds.), MIT-Press, 1999.
[8]
Masters T., Advanced Algorithms for Neural Networks: a C++ sourcebook, Wiley, New York, 1995.
[9]
Nasdaq Stock MarketSM: http://www.nasdaq.com
[10] National Stock Exchange of India Limited: http://www.nse-india.com [11] Philip N.S. and Joseph K.B., Boosting the Differences: A Fast Bayesian classifier neural network, Intelligent Data Analysis, 4 (2000) 463-473, IOS press, Netherlands, 2000. http://www.iucaa.ernet.in/~nspp/dbnn.html [12] Vapnik V., The Nature of Statistical Learning Theory. Springer-Verlag, New York, 1995.