PEDESTRIAN SENSING WITH FEATURE EXTRACTION T. J. Chamberlain
A. Armitage
Research Student Lecturer
[email protected] [email protected]
M. J. Rutter
Lecturer
[email protected]
T.D. Binnie
Reader
[email protected] Facility of Engineering, Computing and Creative Industries Napier University 10 Colinton Rd Edinburgh, EH10 5DT
Abstract Automated pedestrian sensing and tracking is receiving increasing attention from researchers in a number of areas. Applications are common in security, in urban planning, and in the retail industry. A common approach is to use CCTV and visible image processing, but this involves complicated scene interpretation. This paper describes our research on monitoring the movement of pedestrians using relatively low-cost, low resolution infrared sensors.
We describe our data collection system and
processing techniques and introduce new data analysis software. Preliminary results show that, as well as the simple tracking of pedestrians, biometric data, such as gait measurement, becomes possible. Our work aims to provide data to improve security and to enable behavioural monitoring of pedestrians in public.
This data is important to those working in pedestrian monitoring, market
research and in public safety and security.
Introduction Pedestrian detection and tracking is an area gaining increasing importance in transport. The ability to measure the movement of pedestrians can have a wide-ranging impact on transport infrastructure and systems. The main areas where accurate measurements of pedestrian motion help are in security and surveillance, behavioural studies and transport systems. Although the security of transport infrastructure has grown in importance over the last decade, the ability to accurately measure the motion of pedestrians is still not widely available. Computer vision systems using visible imaging (CCTV or similar) have advanced considerably in the last few years (1), (2), (3), (4). However, these systems are still limited in their ability to handle crowded scenes, or scenes in which there is a large amount of extraneous detail (such as moving shadows, swaying tree
1
branches and vehicular traffic). Recently, there has been interest in the use of high-resolution infrared images (5), (6),. Particularly when combined with visible images (7), (8) this could provide a more robust method of tracking pedestrians.
The thermal images provide extra information about the
presence of hot objects, such as pedestrians, in the field of view. The problem is still not trivial. Typical systems can only deal with limited numbers of pedestrians: three at a time in the system developed by Torresan et al. (8). It’s also a problem that such high-resolution cameras are expensive, and not yet widely used. CCTV systems are much cheaper, and are far more widely deployed. However, the difficulties of accurately deriving pedestrian information from these systems means that in most cases the footage is simply recorded and used as a post-event diagnostic tool. Additional systems that can actively collect information about pedestrians have the potential to not only improve our use of CCTV but also aid the monitoring of restricted access areas. At present the transport research community is producing and using several pedestrian behaviour models (eg (9)). There is still a gap between these models and our ability to confirm on a large scale the actual motion of pedestrians in real environments. This work follows the Permeate (10) project and should enable improvements to the data collection process.
In turn, this will improve these
models so they become more accurate. Road junction signalling systems could be improved by the addition of effective pedestrian measurement equipment.
Detecting the presence of both the number of pedestrians and the
presence of vulnerable pedestrians (such as children, the disabled or infirm) could be used to alter the signal priorities. A survey published in 1999 (11) shows that a disproportionately high number of pedestrian fatalities occur in high risk groups.
Any technology that improves this will be
advantageous. We present a method for capturing human motion information and a novel system for extracting stride information. We anticipate that it will enable the extraction of biometric features based on human gait. This will aid the monitoring of restricted access areas and produce individual pedestrian information. This information may further enable the tracking of pedestrians from one sensor to another even when the pedestrian becomes occluded. It may also be able to help identify vulnerable pedestrians.
2
Data collected IRISYS thermal detectors contain pyroelectric low resolution (16 by 16) sensor arrays that produce a data matrix of short term temperature change in the field of view (12).
As a pedestrian walks under
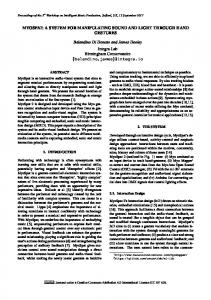
the detectors, the changes in temperature are detected by the elements of the array that cover the area where the pedestrian is walking. This manifests itself as a hot (bright) round object representing the temperature increase caused by the pedestrian’s movement – see Figure 1.
The dark trail
adjacent (lower right) to the brighter area is the negative cooling effect. As the detector measures change in temperature, the area the pedestrian has just passed through is shown as a darker area.
Figure 1: Sensor Image Each detector has an onboard digital signal processor that uses a real time algorithm to robustly identify and track multiple individuals moving within the field of view. Figure 2 shows a scene with two pedestrians detected and their paths superimposed.
Figure 2: Pedestrians Detected and Tracked The centroid of each ellipse (pedestrian) is then sent to an attached PC in at a rate of thirty frames per second. This provides sub-pixel accuracy for the location of the pedestrian.
Additional size and
status information is also provided for each elliptical target.
3
Our experiments consisted of collecting a range of personal information from each participant such as height, leg length measurements, weight, and gender. We then asked each participant to walk under our sensors in straight lines several times, measuring their walk each time with the IRISYS thermal detectors. Each trajectory was then stored for further processing as described below.
Processing the data There are several processing steps required to take the data collected and extract information that can be used. Each step builds on the last, to put the data in a format that should help produce an identifiable feature about the pedestrian. Firstly a correction equation must be applied to the data to compensate for the barrel distortion present in each detector.
This is caused by the wide-angle
germanium lens and mounting in the detector. This distortion is not easily corrected, as it varies from sensor to sensor, but through experimentation we have obtained an algorithm that corrects most of the distortion. Secondly the path of the pedestrian must be extracted; our current algorithm relies on the pedestrian walking in a straight line and by performing linear regression we find a best fit line for the walk of the pedestrian shown in Figure 3. The straight line is a best fit line for the data, established using regression as there is statistical error in both x and y measurements.
Figure 3: Pedestrian’s Path The line is expressed in its parametric form as described in (13). Any trajectories where the fit of this line is substantially below expected values are discounted at this stage as being poorly matched data. The experiments conducted so far have relied on the participants’ cooperation or selected locations where the natural trajectory was approximately linear, maximising the usefulness of data at this stage.
4
Future work would be needed to improve the modelling of the pedestrian’s paths. Options include the fitting of a polynomial or floating average instead of a straight line. The third stage is to extract the minimum distance from each point to the line that denotes the general direction taken (Figure 3). It is apparent from the diagram that there is a significant variation from left to right and our work is based on the correspondence of this to the location of each step the pedestrian takes. This data is then filtered, windowed and put through a Discrete Fourier Transform (DFT) to extract frequency information. This frequency information is based on the rate at which the pedestrian walks, which in turn is dependant on personal physiological factors such as leg length. We have still to confirm to what extent the frequency view of this data relates to the individual or their physical features but initial examination shows some correlation. The DFT was selected as the simplest method of extracting frequency information from the data set. In future, work will be done using transforms better suited to short data sets (16, p816).
Analysis of the results The results collected so far have proved promising. When viewing the plot presented in Figure 2 it is possible to see that there is a left to right swinging motion as the pedestrian walks through the field of view. This left to right motion is more clearly visible in Figure 4 where the motion has been re-scaled and each point expressed as a distance from the best fit line against time (a pixel unit corresponds to approximately 20 cm). This provides an interesting source of data relating to the frequency of the pedestrian’s stride and enabling the length of their stride to be measured. This information is then used to extract two different measures. Firstly the magnitude of the oscillation is established by calculating the mean of the absolute value of the points shown in Figure 4. Secondly the frequency of the oscillation is examined to produce walking cadence information. From this, two different measures can be derived. Firstly the magnitude of the oscillation is established by calculating the mean of the absolute value of the points shown in Figure 4. Secondly the frequency of the oscillation is examined to produce walking cadence information.
Wagg and Nixon (14) show that cadence information
contains a significant individualistic component and can contribute to a biometric measure.
5
0.5 0.4
2130
1980
1830
1680
1530
1380
1230
1080
930
780
630
480
-0.2
330
0 -0.1
180
0.2 0.1 30
Pixel Units
0.3
-0.3 -0.4 Time (ms) Figure 4: Graph of left to right swing v time
Magnitude of oscillation In excess of 200 measurements have been collected from 21 different participants using detectors placed in the ceiling of Napier University’s Merchiston library. For this set of data each participant was aware that they were taking part in pedestrian measurement experiments and provided their weight, height, gender and age. A notable difference is present in the measurements from male and females. Figure 5 shows the difference in oscillation magnitudes between male and female participants.
14 12
8
Female
6
Male
4 2 0 0. 02 5 0. 1 0. 17 5 0. 25 0. 32 5 0. 4 0. 47 5 0. 55 0. 62 5 0. 7 0. 77 5 0. 85 0. 92 5
Frequency
10
Oscillation Magnitude (pixels)
Figure 5 Gender distribution
6
It is clear from the data that there is significant difference in the means of the measurements from each gender. The information is not sufficiently different to produce an absolute measure of gender, however it is sufficient to produce a measure suitable for inclusion in a statistical model (e.g. a Markov model). An unpaired t-Test assuming unequal variance was performed on the data to check the statistical significance of the difference between the mean of each gender. The test was performed with a confidence measure of 99.9%. The result of this test, (Table 1) shows that we can be 99.9% certain that the mean of the male dataset is higher than the mean of the female dataset. The value of t-stat is larger than t-critical thus establishing the significance of the finding. t-Test: Two-Sample Assuming Unequal Variances 99.90% Male Female Mean 0.3794 0.2387 Variance 0.0478 0.0182 Observations 67 67 Hypothesized Mean Difference 0.0000 Degrees of freedom 110 t Stat 4.4824 P(T