May 27, 2004 - for design and construction. ... The construction of the tunnel, starting from the first design stage to the ..... Barton N., Lien R. and Lunde J., 1974.
World Tunnel Congress ITA-AITES 2004 – Singapore 22-27 May 2004
PENCHALA Tunnel: example of an efficient combination of empirical, analytical, and observational approaches for design 1
1
1
P. Grasso , M. Pescara , N. Ruga and G. Russo
1
2
P.Sivalingam 1 2
GEODATA SpA, corso Duca degli Abruzzi 48/E, 10129 Turin, Italy GAMUDA BERHAD, No.67, Jalan 3/93, Taman Miharja, Off Jalan Cheras, 55200 Hular Lumpur, Malaysia
ABSTRACT The 710m-long Penchala tunnel is the first underground civil structure of the Kuala Lumpur highway system. It is a twin-bore tunnel and each bore has a horse-shoe shaped section with an excavated area of 118-144m2. The ground conditions vary from residual soils to fresh, strong granites and the overburden from a few meters to a maximum of 115m. Given the importance of this tunnel and the relatively limited experience of Malaysia in constructing tunnels of this dimension, the construction contract was procured through international tendering, admitting proposals with alternative solutions for design and construction. This paper illustrates how an efficient combination of empirical, analytical, and observational approaches, allows to develop a flexible Construction Design and to speed the execution. Moreover, it gives a quick overview of the optimization introduced by the winning, Alternative Solution proposed by the Designer Geodata together with the Sub-Contractor CMC, who excavated the tunnel, over the original Tender Design. The tunnel excavation and support were completed in May 2003. The example represents certainly another successful case of technology transfer from Italy to abroad. 1. INTRODUCTION The Penchala tunnel is the first underground civil structure of the Western Kuala Lumpur Traffic Dispersal Scheme. The 710m-long, twin bore tunnel was realized between 2002-2003 by the Joint Venture CMC (Italy) and CM Indah (Malaysia), on the basis of the Construction Design and follow-up of GEODATA (Turin, Italy). The main features of the Penchala Tunnel are given in Table 1. Table 1. Characteristics of Penchala tunnel Characteristic Eastbound tube (LHS) Length along central axis of the natural tunnel Minimum radius of curvature along central axis Grade Overburden Pillar width Cross passages Geology Excavation section area Excavation method Working faces
Westbound tube (RHS)
709.26m
691.70m
455.25m
604.75m
+3.5%/-2.5% +4.0%/-2.5% average 60m, maximum 115m 8m at the portals up to a maximum of 14m No.3, 4.7m width and 4.4m height Granites with various degrees of weathering and fracturing Average 140m2 Drill & Blast and hydraulic machinery No.4 (n.1 from each portal)
World Tunnel Congress ITA-AITES 2004 – Singapore 22-27 May 2004
The bid foresaw a “lump sum” contract with a fixed time of 21 months to finish the work, with the possibility to present Alternative Design solution with respect to the Tender design. The Engineer was part of the Organization who studied the preliminary design and prepared the bid, while the General Contractor, who constructed all the stretch, was also part of the Manager who had the license for the Western Kuala Lumpur Traffic Dispersal Scheme. The twin bore tunnel was on the critical path since it was the most complicated and, in the same way, unforeseeable civil work of all the stretch for Malaysian Contractors. In order to satisfy the targets of both the Owner and the Joint Venture in terms of budget and specially time, the construction design, starting from the Tender, has been developed defining very flexible excavation section types (which could guarantee to cover all the foreseeable underground conditions) to be managed on site directly by the Design Representative according to the criteria of the observational approach. Moreover some optimizations with respect to the Tender solution were introduced in order to speed the execution, to lower the cost and increase the overall safety of the works.
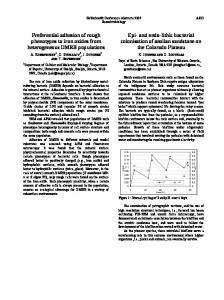
2. DEVELOPMENT OF THE CONSTRUCTION DESIGN 2.1 Summary of the key elements of the technical approach The construction of the tunnel, starting from the first design stage to the last work on site is regulated by the concept expressed in Figure 1, where the need for the Designer to be involved for the entire duration of the works is implicit. Moreover, having in mind the concept that the optimal design involves empirical, analytical and observational methods (Bieniawski, 1984), the intent was to define a very flexible design wherein the various excavation section types are integrated in order to allow a smooth variation and an easy definition of their application directly at the excavation face, optimizing both the advance rate and the installation of stabilization measures. PREDICTION Detailed characterization of the ground Design assumptions and analyses Design of countermeasures
MONITORING Detailed evaluation of measurements
Design optimization and application of predefined countermeasures
Figure 1. Basic design approach The first step, in order to define both the excavation sections and the rules for their right application is a linear correlation between the geomechanical context and the excavation works and thus the construction design has been based on the successive determination along the tunnel alignment of (Russo et al., 1998): • geomechanical groups, representing the different rock masses with well-defined intrinsic geomechanical properties;
World Tunnel Congress ITA-AITES 2004 – Singapore 22-27 May 2004
• •
behavioral categories, which express the deformation responses of the geomechanical groups at tunnel level; technical classes, which are directly associated with the different project solutions, in terms of typical sections of excavation and support.
2.2 Definition of the geomechanical groups The tunnel is entirely excavated in the so-called Kuala Lumpur Granite, that is typically a medium to coarse grained granite, with various grades of fracturing and weathering. The whole tunnel is below groundwater table, which follows the slope surface (located at the transition from the top soil to the bedrock); a stream flows on the surface, at a distance of about 20m from the tunnel alignment. For investigation purpose, 12 boreholes were drilled along the tunnel alignment for the preliminary design, for an accumulated length of 865m. In situ tests involved also geophisical surveys, 28 permeability tests and an adequate number of laboratory tests. The basic features of the geomechanical study include: • the variability and residual uncertainties on the geotechnical properties are analysed with statistical methods and incorporated in the tunnel design by means of a probabilistic approach; • in addition to the Q-System (Barton, 1974; Grimstad and Barton, 1993) used in Tender design, the GSI (Geological Strength Index, Hoek et al., 1995) is applied for evaluating the geomechanical quality of the rock masses. This addresses the requirement of referring to a "pure" classification system, which reflects intrinsic rock mass properties and can be directly correlated with principal geomechanical parameters. • the weathering grade of the granite is classified in accordance with the proposal of the Geological Society of London (GSL,1995), referring to the condition of uniform (intact) material. The analysis of the available data suggested to distinguish 5 major Geomechanical Groups (G.G.) along the tunnel alignment; the typical description of these groups is given in Table 2. Table 2: Typical characteristics of the geomechanical groups Intact rock material G.G. Weathering 1 Strength2 Fracturing 2 G1 >>W1/(W2) high low >>(W1)/W2 -high G2 low to medium -W4/W5 in -low in shear shear bands bands >>W2/W3 -moderate G3 high -W4/W5 in -low in shear shear bands bands high to very G4 >>W3/W5 low high G5 >>W4/W5 low to very low very high 1 2 3 Notes: GSL (1995); ISRM (1981); Barton, 1974.
Rock mass Quality3 Good to very good Globally poor to fair
Globally very poor Very to Extremely poor Extremely poor
The statistical analysis of the Q-System input parameters for each geomechanical group allows to transform frequency distributions into density functions, which are then used as input for deriving probabilistically representative Q and GSI values, as well as the principal parameters of rock masses. In particular, the MonteCarlo method (Metropolis and Ulam, 1949) is employed with Latin Hypercube sampling. The principal results of statistical and probabilistic analysis (500 simulations) are shown in Table 3.
World Tunnel Congress ITA-AITES 2004 – Singapore 22-27 May 2004
Table 3: Typical properties of the geomechanical groups (G.G.) from statistical and probabilistic analysis G.G. Intact rock properties Rock mass quality Index mi GSI Co(MPa) (1) Q(2) G1 80-160 [31-161] 20-30 17-132 [5.9-165.8] 70-90 G2 35-110 [25-160] 20-30 0.9-11.3 [0.51-15] 50-70 G3 20-40 10-15 0.1-0.6 [0.048-1.6] 35-50 G4 10-20 10-15 0.01-0.07 [0.006-0.14] 20-35 G5 1-10 8-12 0.004-0.02 [0.002-0.02]


![An Efficient Computation of Handle and Tunnel ... - Siggraph 2013 [PDF]](https://m.moam.info/img/260x300/an-efficient-computation-of-handle-and-tunnel-sigg_64ccceeb098a9ee62a8b45e6.jpg)