Sep 28, 2018 - Forskningen syftar främst till att ge industrin verktyg för att analysera och utvärdera ... kontrollerats och jämförts med tidsstudier och intervjuer med relevant personal för att säkerställa att så ...... kvalitativ metod., third edit.
2018
NORDIC SWAN ECOLABEL 3041 0903 Printed by Media-Tryck, Lund 2018
9 789177 537366
Performance-based costing as decision support for development of discrete part production
Lund University Faculty of Engineering Department of Mechanical Engineering ISBN 978-91-7753-736-6 ISSN 1652-8220
christina windmark
Aspects involved in presented decision supports for production system development.
Performance-based costing as decision support for development of discrete part production Linking performance, production costs, and sustainability christina windmark department of mechanical engineering | Lund University 2018
Performance-based costing as decision support for development of discrete part production
i
ii
Performance-based costing as decision support for development of discrete part production Linking performance, production costs, and sustainability Christina Windmark
DOCTORAL THESIS by due permission of the Faculty of Engineering, Lund University, Sweden. To be publicly defended on Friday the 28nd of September 2018 at 10.15 a.m. at lecture hall M:B, M-building, Faculty of Engineering, Lund University, Ole Römers väg 1 221 00 Lund. Faculty opponent Professor Gunnar Bolmsjö, Linnæus University, Växjö, Sweden
iii
Organization: Division of Production and Materials Engineering Faculty of Engineering LUND UNIVERSITY
Document name Doctoral Thesis
Author: Christina Windmark
Sponsoring organization: VINNOVA, FORMAS, the Swedish Energy Agency, and SPI
Date of issue June 2018
Title: Performance-based costing as decision support for development of discrete part production – Linking performance, production costs, and sustainability Abstract In today’s global market, the industry is struggling every day to make the “corerct decisions”. Decisions concerning production can range from smaller improvements to choice tool or equipment investments to relocation of entire production facilities. Increasing globalization leads to both opportunities and challenges, driving the need for fact-based decision-support including costs to be able to evaluate the cost outcome of different production development alternatives. For a high cost country, such as Sweden it is important to continuously increase productivity to counterbalance the high cost of labour, taxes and services. A trend, that has existed for several decades, is to relocate manufacturing to countries with lower costs, especially with lower labour costs. Production relocation often results in higher initial costs, which makes it essential to make the correct decision from the beginning. To ensure that the production is in line with manufacturing strategy, performance measurements are commonly used. Measurements/indicators can also be used to make strategy more tangible, facilitating information and knowledge transfer. In other words, they can be used to inform co-workers about how the company is doing and how the system and processes respond to different actions. Interactive use of a performance measurement system and frequent analyses of indicators can be conducted to generate learning about actions leading to higher performance. Recent movements within the industrial sector point towards increasing efforts to take responsibility for the environment. However, cost savings are one of the prominent drivers for sustainability improvements, together with governmental legislation, market advantages, and pressure from shareholders and stakeholders. Prominent obstacles for sustainability improvements have been found to be a lack of understanding and knowledge, unclear and fuzzy decision authorization, and lack of performance measurements are noticeable reported reasons. The traditional cost method, involves direct material, direct labour, and overhead costs. When the costing method was implemented, a large proportion of the production cost consisted of labour costs, but as the equipment complexity and equipment costs increase the need for more detailed cost-models arises. One of the major goals in this thesis is to use knowledge of performance and capability in production operations to support decision on future developments and configurations. Therefore, it is important that the cost-model used captures as many aspects as possible and, especially performance parameters. The cost-model used in this thesis is a time-based technical performance-based cost-model for discrete part manufacturing, incorporating performance parameters such as cycle time, quality rate, process material waste, speed losses, availability losses, set-up times, and degree of capacity occupancy. Research has been conducted within cost-conscious manufacturing addressing cost impact on production decisions such as production location, automation level, product cost consequences of alterative equipment resources, energy consumption, and sustainability. The aim of this thesis is to provide decision-makers with structures for information gathering from the production system in order to make sound short-term and long-term tactical and strategic decisions incorporating production performance. The research contribution can be divided into four parts: 1) Cost-model applications for specific analyses and decisions. 2) Cost model development, adding aspects of material handling and tied-up capital to develop the manufacturing cost-model into a production cost-model. 3) Support location decisions with a cost-based decision framework. 4) Support sustainable production using a production performance-based costing perspective. Key words Production cost; performance; decision support; manufacturing; production development; performancebased costing; sustainability; organizational learning Classification system and/or index terms (if any) Supplementary bibliographical information
Language: English
ISSN 1652-8220
ISBN 978-91-7753-736-6 (print) ISBN 978-91-7753-737-3 (pdf)
Recipient’s notes
Number of pages: 241
Price
Security classification
I, the undersigned, being the copyright owner of the abstract of the above-mentioned dissertation, hereby grant to all reference sourcespermission to publish and disseminate the abstract of the above-mentioned dissertation.
Signature
iv
Date 2018-06-11
Performance-based costing as decision support for development of discrete part production Linking performance, production costs, and sustainability Christina Windmark DOCTORAL THESIS 2018
Division of Production and Materials Engineering Department of Mechanical Engineering Lund University, Sweden
i
Cover photos Front page: Above: Stainless steel chips Christina Windmark, Below: Lund University chocolate coins Louise Larsson Back page: Production system illustration Christina Windmark Copyright © Christina Windmark Paper I © Tampere University of Technology Paper II © The Authors. Published by Elsevier B.V Paper III ©The Authors. Published by Elsevier B.V. Paper IV © Inderscience Enterprises Ltd. Paper V © The Authors. Published by Elsevier B.V. Paper VI © Creative Commons Attribution-NonCommercial-NoDerivatives 4.0 International Paper VII © by Authors submitted manuscript Paper VIII © by Authors submitted manuscript Faculty of Engineering | Mechanical Engineering ISBN 978-91-7753-736-6 (print) ISBN 978-91-7753-737-3 (pdf) ISSN 1652-8220 Printed in Sweden by Media-Tryck, Lund University Lund 2018 N SWA ECO LA
NOR DI
C
B EL 1234 5678
ii
Media-Tryck is an environmentally certified and ISO 14001 certified provider of printed material. Read more about our environmental work at www.mediatryck.lu.se
To the indispensable pursuit
iii
iv
Acknowledgements I think it is amazing how seven years can disappear so rapidly, and still 2011, when I first started my studies, is so far away. There are many people to thank for being a part of my doctoral journey. First, I want to thank my supervisor Carin Andersson for giving valuable help and comments on my publication works and for supporting me during the work of this thesis. I also want to thank my co-supervisors Jan Olhager for valuable and objective support during this thesis work and Mikael Blomé for his advice during my time as a PhD student. Along my journey as a PhD student, I have met many amazing people. Thank you my colleagues at Mechanical Engineering for a stimulating time, especially my roommates, Kathrine Spang and Babak Kianian. During my PhD courses, I have met people from different departments and universities, which have enriched my life. Special thanks to the 13 PhD-students that I shared an eventful, enlightening and inspiring two-week bus tour to foreign factories in Eastern-Central Europe. I also want to thank my fellow PhD-students that were and are a part of our national PhD-student council, PADOK, for the Swedish Production Academy. I believe, in meeting and sharing experience, we establish common grounds for future relationships, building a stronger research community for production developments. In addition, I want to acknowledge the PhD-students in the central PhD-student council at the faculty of Engineering, Lund University for inspiring discussions and progressing work to strengthening the situation for PhD-students. I want to thank the Master student at our division, for involving me in their masterthesis and thereby providing me with interesting discussions, new insights and increased knowledge. My research had not been possible without financial support from VINNOVA and my project partners and co-writers. I want to express gratitude to all my industrial partners for providing me with time, information and knowledge needed to accomplish my studies. It is always a privilege to work with dedicated people. I want to acknowledge all my academic partners and especially Volodymyr Bushlya, Jan-Eric Ståhl, Fredrik Schultheiss, Martin Kurdve, Per Gabrielson, Anna Ericson Öberg and Mats Winroth for contributing to positive and progressing experiences. I also want to thank James Butler for language proofing and valuable support during paper and thesis writing. I am extremely thankful for the Swedish education system that provided me with three years of additional and supportive language coaching during my time in primary school. Without the support, I do not think I would be writing this thesis. Thank you my wonderful parents for always supporting and encouraging me to try to reach my own gaols in life. You are my best supporters, always believing in me. v
Thank you mom for all the hours of homework support you gave me, and thank you dad for giving me the inspiration and interest for industrial production. I also want to thank my brilliant sister and her fiancé for always being there. Often the people around you inspire and drive you to be a better person and to develop to your best potential. Thank you Tove Mattsson for being my best friend the last 12 years and for all discussions on how this world could be a better place during our final nights and days before exams and during our many evening walks. Last, I want to thank the best person in the world, Johan, my husband, life partner and great father to our 2 amazing children. Without you, my life would be empty.
Christina Windmark Lund, 15 June 2018
vi
Abstract In today’s global market, the industry is struggling every day to make the “correct decisions”. Decisions concerning production can range from smaller improvements to choice tool or equipment investments to relocation of entire production facilities. Increasing globalization leads to both opportunities and challenges, driving the need for fact-based decision-support including costs to be able to evaluate the cost outcome of different production development alternatives. For a high cost country, such as Sweden it is important to continuously increase productivity to counterbalance the high cost of labour, taxes and services. A trend, that has existed for several decades, is to relocate manufacturing to countries with lower costs, especially with lower labour costs. Production relocation often results in higher initial costs, which makes it essential to make the correct decision from the beginning. To ensure that the production is in line with manufacturing strategy, performance measurements are commonly used. Measurements/indicators can also be used to make strategy more tangible, facilitating information and knowledge transfer. In other words, they can be used to inform co-workers about how the company is doing and how the system and processes respond to different actions. Interactive use of a performance measurement system and frequent analyses of indicators can be conducted to generate learning about actions leading to higher performance. Recent movements within the industrial sector point towards increasing efforts to take responsibility for the environment. However, cost savings are one of the prominent drivers for sustainability improvements, together with governmental legislation, market advantages, and pressure from shareholders and stakeholders. Prominent obstacles for sustainability improvements have been found to be a lack of understanding and knowledge, unclear and fuzzy decision authorization, and lack of performance measurements are noticeable reported reasons. The traditional cost method, involves direct material, direct labour, and overhead costs. When the costing method was implemented, a large proportion of the production cost consisted of labour costs, but as the equipment complexity and equipment costs increase the need for more detailed cost-models arises. One of the major goals in this thesis is to use knowledge of performance and capability in production operations to support decision on future developments and configurations. Therefore, it is important that the cost-model used captures as many aspects as possible and, especially performance parameters. The cost-model used in this thesis is a time-based technical performance-based cost-model for discrete part manufacturing, incorporating performance parameters such as cycle time,
vii
quality rate, process material waste, speed losses, availability losses, set-up times, and degree of capacity occupancy. Research has been conducted within cost-conscious manufacturing addressing cost impact on production decisions such as production location, automation level, product cost consequences of alterative equipment resources, energy consumption, and sustainability. The aim of this thesis is to provide decision-makers with structures for information gathering from the production system in order to make sound short-term and long-term tactical and strategic knowledgeable decisions incorporating production performance. The research contribution can be divided into four parts: 1) Cost-model applications for specific analyses and decisions. 2) Cost model development, adding aspects of material handling and tied-up capital to develop the manufacturing cost-model into a production cost-model. 3) Support location decisions with a cost-based decision framework. 4) Support sustainable production using a production performance-based costing perspective. Key words: Production cost; performance; decision support; manufacturing; production development; performance-based costing; sustainability; organizational learning
viii
Populärvetenskaplig sammanfattning Svensk tillverkningsindustri bidrar till ca 16 % (Statistics Sweden 2016) av bruttonationalprodukten och medverkar till att ca 900 000 av landets invånare har en anställning (Produktion2030 2016), vilket gör sektorn till en viktig del av Sveriges välfärdssystem. Forskningen syftar främst till att ge industrin verktyg för att analysera och utvärdera produktion för resurseffektivare och lönsammare tillverkning som även minskar miljöbelastningen. Målet är att stödja beslutsfattare i industrin att aktivt generera den information och kunskaper som hjälper dem att fatta faktabaserade beslut. I ett tillverkande företag behöver produktionen kontinuerligt förbättras och ändras för att bevara lönsamhet, anpassas för nya produkter och ändrad efterfråga samt för att uppnå det legala och frivilliga krav som finns kring resursutnyttjande och hållbarhet. Genom att använda prestandaparametrar (prestandaparametrar är till för att mäta och utvärdera hur bra ett företag är på att använda sin tid och sina resurser) i en kostnadsmodell är det möjligt att simulera utvecklingsscenarier och koppla kostnader till resursanvändning. Forskningen har bedrivits inom fyra olika utvecklingsområden för att underlätta beslut i tillverkande industri genom att använda prestandaparametrar. Det första området är utveckling av tillämpningar av en kostnadsmodell som knyter samman kostnads- och presentandaparametrar, där en metodik för att fördela kostnader på produktionsstörningar utvecklats. Denna metodik gör det möjligt att analysera befintliga produktionsutrustningar för få kunskap kring vad som orsakar problemet och vad problemet innebär för lönsamheten. Kostnadsmodellen för tillverkning har vidareutvecklats till att användas vid utvärdering av utrustningsinvesteringar. I de framtagna modellerna jämförs olika varianter av system med varandra för att hitta den lämpligaste utformningen utifrån olika förutsättningar. Modellerna är främst framtagna för att användas vid nyinvestering och för att bedöma lämpligast automationsnivå. Det andra området är vidareutveckling av kostnadsmodellen för kostnadssättning av hantering och lagring av material internt på ett företag. Kostnadsmodellen för tillverkning övergår då till att bli en modell som kan hantera stora delar av ett helt produktionssystem. Därefter har ett beslutsstöd för produktionslokalisering baserat på produktionskostnader utarbetats för att stödja företag i produktionslokaliseringsprojekt. I detta beslutsstöd används modellen för att beräkna materialhanterings kostnader tillsamman med mer schematiska estimeringsverktyg för att bedöma kostnader för
ix
extern logistik, kvalitetssäkring, underhåll, försäljning, inköp, produktionsupptrampning, kunskap- och kompetensförsörjning samt de effekter som kan uppstå i befintlig verksamhet då delar av den förflyttas. Till sist har ett konceptramverk för beslutsstöd för hållbar produktion utvecklats baserat på kostnadsmodellen. Mätbar prestanda från produktionsprocessen tillsammans mjukare data som t.ex. personaltillfredställelse, energikällors miljöpåverkan och hållbarheten på materialkällorna används för att skapa en omfattande hållbarhetsvärdering av en tillverkad produkt. Genom att använda prestandaparametrar har även oönskade aktiviteter i produktionen kopplats till koldioxidutsläpp via den energi eller det material som förbrukats. Arbetet har främst bedrivits med hjälp av empiriska studier där observationer och intervjuer i industriella miljöer har genomförts. Totalt har sju olika tillverkningsföretag bidragit med omfattande empirisk data som använts för att genomföra kostnadsanalyser. De tillverkningsprocesser som studerats är främst skärande bearbetning (svarvning och fräsning), montering, svetsning och plåtformning. Anställda som bidragit med relevant information har haft befattningar från operatör/montör till VD och styrelsemedlemmar. Datainsamling har främst skett via intranäten på företagen gällande investeringar, saldon, omkostnader, tidsrapporteringar och kvalitetsrapporteringar. Detta har kontrollerats och jämförts med tidsstudier och intervjuer med relevant personal för att säkerställa att så korrekt information som möjligt används. Då information inte funnits tillgänglig har tidsstudier, observationer i verksamheten och intervjuer varit den primära informationskällan. Utöver empiriska studier har matematiska simuleringar och litteraturstudier används för att utveckla beslutsmodeller.
x
Appended publications This thesis is based on the work presented in the following publications. In the text, these are referred to with Roman numerals I-VIII. I.
A production performance analysis regarding downtime and downtime pattern Stål (Windmark), Christina, Ståhl, Jan-Eric, Gabrielson, Per & Andersson, Carin, presented at the 22nd International Conference on Flexible Automation and Intelligent Manufacturing, Helsinki, Finland, 10-13 June 2012. Windmark planned and executed the case study and developed the distribution model. Windmark was the main author, presented the paper at the conference and was responsible for manuscript preparation and the corresponding author.
II.
CPR a general Cost Performance Ratio in Manufacturing - A KPI for judgement of different technologies and development scenarios Windmark Christina, Bushlya Volodymyr & Ståhl Jan-Eric, presented at the 51st CIRP conference on manufacturing systems, Stockholm, 16-18 May 2018 (Procedia CIRP). Windmark was active in data collection, model development and responsible for paper preparations and revision, and was a presenter at the conference.
III.
A cost-model for determining an optimal automation level in discrete batch manufacturing Windmark Christina, Gabrielson Per, Andersson Carin & Ståhl Jan-Eric (2012) Procedia CIRP Vol. 3, pp. 73-78. Windmark was co-author of the original paper, contributing in discussions, the writing process and software and figure development. Presented the paper at the conference and was responsible for reworking the paper, reducing and rewriting it to fit the guidelines of the proceedings (current paper). Corresponding author and responsible for responding to the comments from the reviewers.
IV.
Cost-models of inbound logistics activities: supporting production system design Windmark Christina & Andersson Carin (2015), International Journal of Supply Chain and Operations Resilience, Vol. 1, No. 2, pp. 181-200. Windmark planned and executed most of the case studies and was the major contributor to manuscript preparations.
xi
V.
Cost assessment of a production system – A method targeting a product´s aggregated value stream cost Windmark Christina & Andersson Carin, presented at the 8th Swedish Production Symposium, Stockholm 16-18 May 2018 (Procedia Manufacturing). Windmark planned and executed the case study and was the major contributor to manuscript preparations and was a presenter at the conference.
VI.
Cost-modelling as decision support when locating manufacturing facilities Windmark Christina & Andersson Carin (2016), International Journal of Production Management and Engineering, Vol. 4, No. 1, pp. 15-27. Windmark was the main author of the paper and main developer of the tools presented.
VII.
Assessing sustainability using a cost-model for development of a framework for sustainable production evaluation Windmark Christina, Kianian Babak & Andersson Carin, submitted to the International Journal of Manufacturing Research (under review). The paper is an extension of a presented conference paper. Windmark mainly planned, executed and developed the research contribution and was the main contributor to manuscript preparations.
VIII.
Sustainability with a cost perspective – driving the industry to embrace sustainable thinking Windmark Christina, Ericson Öberg Anna, Kurdve Martin, Almström Peter, Winroth Mats & Andersson Carin, Manuscript submitted to Journal for Cleaner Production (under review). Windmark initiated and planned the paper and was the main developer of the survey questionnaire and main author of the paper.
xii
Other Publications [1] Ståhl, J-E, Windmark, C & Kianian, B, 2018 Cost-based pricing for learning organizations – a model presentation and demonstration, presented at the 8th International Swedish Production Symposium, Stockholm 16-18 May 2018 (Procedia Manufacturing). [2] Landström, A, Almström, P, Andersson, C, Öberg, AE, M, Kurdve, Shahbazi, S, Wiktorsson, M, Windmark, C, Winroth, M & Zackrisson, M, 2018 A life cycle approach to business performance measurement systems presented at the 8th International Swedish Production Symposium, SPS18. [3] Schultheiss, F, Sjöstrand, S, Rasmusson, M, Windmark, C & Ståhl, J-E, 2018, Machinability and Manufacturing Cost in Low-Lead Brass, accepted to the International Journal of Advanced Manufacturing Technology, pp. 1-10. [4] Zackrisson, M, Kurdve, M, Shahbazi, S, Wiktorsson, M, Winroth, M, Landström, A, Almström, P, Andersson, C, Windmark, C, Öberg, AE & Myrelid, A, 2017, 'Sustainability Performance Indicators at Shop Floor Level in Large Manufacturing Companies' Procedia CIRP, Vol. 61, pp. 457-462. DOI: 10.1016/j.procir.2016.11.199 [5] Almström, P., Andersson, C., Öberg, A. E., Hammersberg, P., Kurdve, M., Landström, A., Shahbazi, S., Wiktorsson, M. and Windmark, C. (2017) Sustainable and resource efficient business performance measurement systems – The handbook. Möndal: Billes Tryckeri. Available at: http://www.diva-portal.org/smash/get/diva2:1161231/FULLTEXT01.pdf. [6] Landström, A., Almström, P., Winroth, M., Andersson, C., Windmark, C., Shabazi, S., Wiktorsson, M., A.E. Öberg, A. Myrelid. (2016). ‘Present state analysis of business performance measurement systems in large manufacturing companies’. Presented at PMA Conference 2016. Edinburgh, UK. [7] Windmark, C & Andersson, C, A Business Case Tool as Decision Support in Early Production Location Project Stages. Presented at the 6th Swedish Production Symposium, Gothenburg, Sweden, 16-18 September 2014.
xiii
[8] Windmark, C, Spang, K, Schultheiss, F & Ståhl, J-E 2014, Batch size optimization based on production part cost. FAIM 2014 - Proceedings of the 24th International Conference on Flexible Automation and Intelligent Manufacturing: Capturing Competitive Advantage via Advanced Manufacturing and Enterprise Transformation. DEStech Publications Inc., s. 1031-1038. [9] Spang, K, Windmark, C & Ståhl, J-E, 'Monte Carlo Simulations of Production Costs in Discrete Part Manufacturing' Presented at the 6th Swedish Production Symposium, Gothenburg, Sweden, 16-18 September 2014. [10] Andersson, C., Bellgran, M., Bruch, J., Rösio, C., Wiktorsson, M. and Windmark, C. (2013) Production location handbook. Lund: Media-Tryck. [11] Windmark, C & Andersson, C, 'Business case as a decision support when relocating manufacturing' Presented at the 5th Swedish Production Symposium, Linköping, Sweden, 6-8 November 2012. [12] Windmark, C, Andersson, C & Ståhl, J-E, 'Manufacturing costs and Degree of Occupancy Based on the Principle of Characteristic Parts' Presented at the 5th Swedish Production Symposium, Linköping, Sweden, 6-8 November 2012.
xiv
xv
Contents Acknowledgements
v
Abstract
vii
Populärvetenskaplig sammanfattning
ix
Appended publications
xi
Other Publications
xiii
Contents
xvi
Parameters used in the thesis
xviii
1.
Introduction 1.1. Background 1.2. Research objective 1.3. Research scope 1.4. Research questions 1.5. Research intentions and limitations 1.6. Terminology 1.7. Outline of the thesis
2.
Frame of reference 11 2.1. Manufacturing strategy, tactics and performance measurements 11 2.2. Production location decisions 13 2.3. Production performance costing 14 2.4. Decision support for production development and changes 19 2.4.1. Decision support tools for sequenced actions and decisions 20 2.4.2. Parametric decision-support models 20 2.4.3. Risk assessment through simulations in decision support 21 2.5. Sustainability and sustainable production 22 2.5.1. Sustainable production 23 2.5.2. Synergy effects in sustainability and profitability 23 2.5.3. Indicators for sustainability 25 2.5.4. Drivers and obstacles for sustainable production 26 2.6. Conclusion of findings from literature 29
3.
Methodology 3.1. Research philosophy and approach 3.2. Research methods
xvi
1 2 4 5 5 6 8 9
31 31 32
3.2.1. Literature review 3.2.2. Empirical studies and data collection 3.2.3. Quantitative mathematical modelling 3.2.4. Survey 3.3. Research design in appended publications 3.3.1. Research design in Paper I 3.3.2. Research design in Paper II 3.3.3. Research design in Paper III 3.3.4. Research design in Paper IV 3.3.5. Research design in Paper V 3.3.6. Research design in Paper VI 3.3.7. Research design in Paper VII 3.3.8. Research design in Paper VIII
33 33 34 34 35 35 36 36 37 38 38 39 39
4.
Research Results 4.1. Overview 4.2. Summary of appended publications 4.2.1. Summary of Paper I 4.2.2. Summary of Paper II 4.2.3. Summary of Paper III 4.2.4. Summary of Paper IV 4.2.5. Summary of Paper V 4.2.6. Summary of Paper VI 4.2.7. Summary of Paper VII 4.2.8. Summary of Paper VIII 4.3. Results contributing to RQ1 4.3.1. Application and modification of the cost-model 4.3.2. Expanding the scope of the cost-model 4.3.3. Adding costs of support processes for production location 4.4. Results contributing to RQ2
41 41 43 43 45 48 49 51 52 54 55 57 57 60 62 65
5.
Discussion 5.1. Industrial and academic contributions 5.2. Increasing knowledge for informed decisions 5.3. Reflection on research quality and limitations 5.4. Future research
69 69 70 76 78
6.
Summary of findings and contributions
81
References
83
xvii
Parameters used in the thesis Parameter κCPR κjCPR A App i j k K0 kA KAG kB kCCP kCCS kCP kCS KCUM kD
Description CPR index CPR index of category II for changes in factor j area used by the process in the production facility area in storage index for enumeration index for enumeration part cost investment tool costs total area cost for forklift aisle. material costs capital cost in process capital cost in storage hourly equipment costs running hourly equipment costs downtime annual maintenance cost of equipment hourly personnel costs
Unit m2 m2 currency /part currency currency currency currency/part currency /part currency /part currency/h currency/h currency/year currency/h
KE ke KG kGC kGCS kGDL kGIL KGLtot/year kHT kMH Kp
total cost of maintenance per batch hourly cost of electricity total cost of peripheral and handling activities hourly cost of material handling equipment hourly cost for storage equipment hourly cost of inbound logistics personnel cost per part for inbound logistics total cost per year of inbound logistics average manual forklift cost at process step handling and storage cost per part power costs
currency/batch currency/h currency currency/h currency/h currency/h currency/unit currency/year currency /h currency /part currency /year
Kpp kRef kren kt MD n N0
total cost for area connected to inventory part cost in reference system renovation costs handling cost per movement annual market demand technical life of equipment batch size
currency/h currency currency currency/movement unit year unit
xviii
Ni Nm nM nop
total number of i components of a product total number of movements number of movements of the product number of operators connected to the process
unit movement unit
Ntot Nren p
total amount of products produced in facility number of renovation internal rate of return
unit unit -
pe pp qB qP qQ qS t0 t0e t0h Tb tcs
pallet equivalent number of pallets places in storage material process scrap rate speed loss rate quality loss rate downtime rate cycle time ideal time per product during tool engagement ideal time per product handled in the equipment batch production time time in storage and material handling
pallets/unit unit min min min h min
thpp tkit tOP tp Tplan Tpp Tsu
time for handling pallets at pallet places time for kitting time for order processing time in process planned and paid production time in storage between processes set-up time
min min min min h min min
tt URP
time for transportation production capacity utilization (occupancy degree)
min -
URPP xaf z
the utilization rate of pallet places automation factor parameter of choice
-
xix
xx
1. Introduction
Sweden has a history of being a strong producer of manufactured goods and manufacturing industries have been the foundation of the country’s prosperity and welfare. In 2011 manufacturing industry contributed to 16.1 % of the gross domestic product (GDP) (Statistics Sweden 2016). Further, in 2016 about 300,000 people were employed in manufacturing industries and 600,000 in enterprises supporting these industries (Produktion2030 2016), corresponding to nearly 20 % of all acquisition workers. The open global market of today leads to many opportunities but also to global competition, driving continuously product and production development and urging companies to expand into new markets to maintain profitability. New products may require altered and/or enhanced production systems, the systems need to continually be monitored to find potential for improvement and new markets or changed market requirements to encourage companies to set new higher improvement targets. In a high cost country such as Sweden it is important for the manufacturing industries to continuously increase productivity to counterbalance the high costs of labour, taxes and services. This can occur through the production development of, for example, equipment, working methods and organizational structures, material and design changes supporting producibility and better interaction in the supply chain. A strong trend, which has existed for some decades, is to relocate manufacturing to countries with lower costs, especially lower labour costs. In Sweden for example 13 % of the companies within manufacturing, services or construction with more than 100 employees, offshored some of their operations during 2009-2011 (Statistics Sweden 2013). The two main reported drivers for offshoring were strategic decisions made by executive management and labour costs. As manufacturing strategy is an essential part of competitiveness (Wheelwright 1978), (Avella et al. 2001) it is one of the keys to business success. It is not uncommon for companies to have a diversified product range with multiply located production facilities. The diversity of larger companies tends to make top management more distanced from the factory floor and decision-makers could have difficulties in understanding the innovation process in the production system (Quinn 1985). This could lead to suboptimal business strategies and unnecessarily expensive production developments or actions in changing the system. To make
1
adequate decisions the management need an in-depth understanding of the organization, products and processes. A common main business objective is to earn money and the main goals of a manufacturing company are thus to deliver products to customers within a certain timeframe and at a sufficiently low cost to be able to create sufficient profit. Recent movements within the industrial sector point towards increasing efforts to take responsibility for the environment, reported from the Paris summit in 2015 and Marrakech Climate Change Conference 2016. However, it is well known that organizational changes are hard to master, and that people historically have difficulties relating to actions leading to sustainability. The connections between sustainable production improvements, concerning material, and energy efficiency connections to cost are well known (Rashid et al. 2008). Nonetheless, companies seem to struggle to find incentives for sustainability, and implement sustainable strategies. Therefore, companies can gain from models and methods for analysing cost efficiency and sustainability impact to be able to prioritize improvements affecting the environment and social climate in a positive direction.
1.1. Background In today’s global market, companies must make decisions concerning investments, location, price levels, production methods and other essential areas in a fast and effective way to be able to stand against international competition. Rushed decisions can be the key to survival but without the correct information and wellfounded facts they can also lead to huge setbacks (Loch & Terwiesch 2005). In Bengtsson et al. (2005) the authors argued for a more holistic perspective on outsourcing, showing that Swedish manufacturing companies carrying out production development, predominantly had better profitability than companies outsourcing, indicating that more aspects should be taken into consideration when evaluating production systems for outsourcing. The uncertainty of whether benefits surpass the disadvantages has also been reported as one of the main obstacles for production relocation (Statistics Sweden 2013). Company reshoring and back-sourcing have both been highlighted by the research community, by political decision makers and by the media. Some reported reasons are the miscalculations between benefits and disadvantages and changes in prerequisites, such as new technology (Johansson & Olhager 2016). In Andersson & Ståhl (2014) the importance of considering production performance when making decisions for production location issues is highlighted. By including production performance in the decision, it was possible to show
2
detailed cost effects on the different location alternatives and process configurations. The alternative that was selected in the end was not considered to be the best option on a high aggregated level of analysis, but by including performance that perception was changed. Comprehensive information about the production system is needed to conduct an analysis as above. Also, it is essential to have knowledge and insight on how configurations in existing and future production systems will affect the systems’ performance. Meaning that data and knowledge should be accumulated during operation; and that system assessments should be conducted frequently to support decision makers. The thesis work was conducted in two VINNOVA-funded research projects, ProLoc and SuRE BPMS, the later within the strategic research and innovation programme Produktion2030. These were both collaborative projects between academic and industry, including partners from Swedish industry, institutes and universities. The Sustainable Production Initiative (SPI), which is a collaboration between Chalmers University of Technology and Lund University for enhanced knowledge about sustainable production, has also provided funding. ProLoc – Manufacturing Footprint during the Product´s Life Cycle. (2010-2013) A driving force for initiating the research project was the hypothesis that many relocation decisions are based on a limited set of parameters and that a fraction of these consist of well-founded measurements. During the project a decision-support model for production location was designed. The model was developed for industrial use, including detailed data for production economics and strategic qualitative information. The aim was to provide the industry with a decisionsupport tool to make informed decisions concerning the company manufacturing footprint. One of the outcomes from the project was a handbook for production location (Andersson et al. 2013). The project was financially funded by VINNOVA. Project partners were Mälardalen University, Jönköping University, Volvo Construction Equipment, Haldex, Alfdex, Alfa Laval and Seco Tools. SuRE BPMS - Sustainable Resource Efficient Business Performance Measurement Systems (2015-2017) When monitoring and surveying production a variety of different measures are used. However, shortcomings exist in the measurement systems, such as unclear dependencies between measured indicators, unclear links between different indicator levels, and the company's strategy and lack of operational indicators measuring sustainability in production. The project aimed to increase resource efficiency in company business performance measurements system and to include measurability of sustainability on the shop floor level. As in the previous project, one of the outcomes was a handbook for sustainable and resource efficient business measurement systems (Almström et al. 2017). The project was financially funded
3
by VINNOVA, FORMAS and the Swedish Energy Agency. Project partners were Chalmers University of Technology, Mälardalen University, Swerea IVF, Volvo Technology, Volvo Cars Corporation, Volvo Trucks, Haldex, Alfa Laval AB, Sandvik Mining & Construction, GKN Aerospace, Volvo Construction Equipment and ÅF. The author’s contribution in both project have been cost-model development with the use of empirical data for analyses of the cost allocations in production activities. In the ProLoc-project, cost and performance are linked to make decisions on location and configuration, whereas in the SuRE BPMS project cost parameters and performance are linked to sustainability, to support decisions contributing to both cost reductions and increases in sustainability. When companies execute substantial changes in their production system, it is important to base the decisions on comprehensive and accurate facts. If the motivation is cost reduction, knowledge about the cost driving factors is essential. To understand and to be able to visualise the link between selected material, equipment, automation level, and production performance, production costs may be essential to take into consideration when developing well-functioning strategies in a company. For example, during production location decisions, factors like poor quality, a larger number of employees, strong salary development, longer transportation routes and distance to home-office could result in the final cost being higher than expected.
1.2.
Research objective
The objective of this thesis is to propose decision support concepts for production development that can be used to make sustainable decisions. Companies tend to have time, capacity and costs as the main drivers when implementing and executing developments and improvement work. Using time driven process-based costing with process-performance connected to root-cause analyses, decision makers could get an overview of the potential of improvements and an in-depth understanding of the system. The necessity to contribute to increased sustainability put pressure on companies to find manufacturing methods and technology to drive this development forward, Therefore there is a need for a clearer integration of sustainability in company’s production development decisions. The aim of this doctoral thesis is to propose industrial economic decision support for informed decisions, mainly for the factory floor level, targeting production operations and activities. This is achieved by integrating production performance
4
and other production related parameters that influence the final production cost and have impact on sustainability.
1.3.
Research scope
The research conducted is based on an established time driven performance-based process oriented cost-model for discrete part manufacturing, with a cost breakdown approach (J.E. Ståhl et al. 2007). This is a technical cost-model for cost estimations for manufacturing systems and should not be confused with accounting costmodels. The aim is to provide the information needed to make informed decisions for viable production. This is achieved by, further developing the cost-model to integrate more aspects connected to production activities, adapt the model for specific decisions, and to provide frameworks for decisions on production. In addition, investigation on the possibility of measure sustainability using the costmodel is conducted. The model selection will further be discussed and motivated in Chapter 2. In this thesis, sustainable production is considered to involve both financial stability, with product costs lower than the market value and thus providing profit, and working methods and materials that do not harm the environment or involve unsafe or unhealthy environments for those who work or live close to company activities. The above definition is approximately very alike the Lowell Center for Sustainable Production definition on sustainable production (Lowell Center for Sustainable Production n.d.), which also include the user-phase of products.
1.4.
Research questions
To achieve the objective two research questions were formulated. RQ1: How can a performance-based part cost-model be applied and further developed to capture the information necessary for decisions on manufacturing system design and configuration? RQ2: How can cost-based decisions be complemented with a sustainability perspective to support strategic decisions for sustainable production?
5
1.5.
Research intentions and limitations
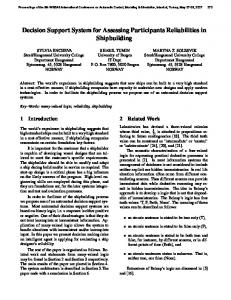
The research that has been conducted and is presented in this thesis is concerned with manufacturing operation processes and activities closely connected to them. The proposed decision-support concepts are based on production performance costing. The research presented is limited to decisions concerning the production activities or closely related to production costs. Four areas were targeted in connection with the research question: 1) Cost-model modification and application for specific analyses and decisions. 2) Cost-model development, adding aspects of material handling and tied-up capital to transfer the manufacturing cost-model into a production costmodel. 3) Support location decisions with a cost-based decision framework. 4) Support sustainable production using a production performance-based costing perspective. The intention of the research is in accordance with Figure 1, where manufacturing strategy and tactics are enabled by costs, location/investments and sustainability investigations, on which the research provides production cost-model developments, analyses and frameworks supporting informed decisions for to costeffective production with enhanced sustainability.
6
Figure 1: Research intentions based on appended publications.
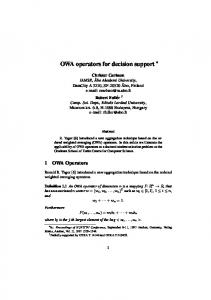
The publications appended contributed either to models and methods for specific applications, model development, or the development of decision frameworks. Each publication’s contribution is illustrated in Figure 2. It is possible to divide the papers into two types of aims, either to increase knowledge for decisions or to provide decision frameworks. Papers I, II, and III provide methods and model modifications for analyses and specific application. Papers IV and V provide model developments for the cost model. Paper VI provides a decision framework partly based on the model developments in Paper IV. Lastly, Papers VII and VIII integrate decisions for sustainable production and manufacturing costs, whereby Paper VII presents a developed decision framework concepts for sustainable production, and Paper VIII presents model modifications for sustainability evaluations in connection with cost analyses. The appended publications in this thesis deal with decisions concerning investments, automation level, sustainable production, and production location. Not all aspects of importance for decisions made in a manufacturing company are taken into consideration. Aspects not dealt with here are, for example, currency fluctuations, patent and intellectual property rights, employee education and skills, supply chain management, product design, and material purchasing.
7
Figure 2: Contribution from each of the appended publications.
1.6.
Terminology
Key terms used in this thesis are defined as follows: Batch size: Number of products produced between two set-ups. One batch can involve several orders. Equipment: The machines and tools used to produce products/parts. Can be everything from a screwdriver to a CNC machine or a heat-treating furnace. Inbound logistic/material handling: In this thesis, inbound logistic and material handling means the actions of moving and storing goods within the company perimeter. Manufacturing costs: Cost of value adding activities in a production system. Manufacturing system: Includes value adding operations and processes that refine the material such as machining, sheet forming, welding, heat treatments etc. Part and product: During production, an unfinished product can be considered as a part. A product can consist of several parts. Production performance: How well the production/manufacturing system can utilize resources and time. Performance parameters can be cycle times, quality rejection rate, material process scrap rate, downtime rate, speed rate losses, set-up times, and level of capacity occupancy. Production costs: Cost of both value adding and non-value adding activities in a production system. 8
Production system: The system, in which products/parts are produced, includes both value adding and non-value adding operations. In the manufacturing industry, production entails manufacturing systems and processes, assembly operations, material handling and storage, quality assurance/control, and maintenance etc. Tools: Interchangeable parts of the equipment mostly used for surface changes, such as metal cutting inserts, metal sheet forming plates and nozzles.
1.7.
Outline of the thesis
The thesis continues with Chapter 2 Frame of reference, to put the presented research into context. The chapter ends with a conclusion from the literature review and the research gap, which this thesis aims to fill. Chapter 3 provides an overview of the methodology used, the most frequently used research methods, and the research design in each of the appended publications. Chapter 4 summarizes each of the appended publications and answers the research questions, together with additional research results. The discussion starts with a brief argumentation on industrial and academic contributions. The discussion also combines and discusses the research results, ending with reflections on research quality, limitation and future research. This doctoral thesis ends by summarizing the outcome from this thesis, followed by the appended publications.
9
10
2. Frame of reference
This chapter presents the frame of reference, which is central to the research presented. The chapter consists of five sub-chapters ending with conclusions and reflections from the literature presented in the introduction and the literature review in this chapter. The research areas covered are manufacturing strategies and performance measurements; production location, costing methods, decisionsupport for production development and changes; sustainability and sustainable production.
2.1.
Manufacturing strategy, tactics and performance measurements
Manufacturing strategy, based on the business plan made by the company board, which is stipulated to follow the interests and wishes of the owners, is used to manage the production system. The manufacturing strategy includes, for example, positions concerning production development and configuration, equipment investments, location decisions, and product selections to ensure a profitable business, in line with the business plan. According to Hayes et al. (1988) manufacturing capability plays an important role in a company’s ability to be competitive and it is important to continuously develop and enhance these capabilities. Schroeder et al (2002) demonstrate how long-term investments in equipment have potential for competitive advantages. The authors present a method using a resource-based view of strategy, including internal learning, external learning, and proprietary process and equipment concepts in a manufacturing context. To ensure that the production is in line with manufacturing strategy, performance measurements/indicators are used (Neely et al. 1995). The indicators can also be used to make strategy more tangible, facilitating information and knowledge transfers. In other words, be used to inform co-workers how the company is doing and how the system and processes are responding to different actions. An adequate performance measurement should be easy to use, have a clear purpose and definition, provide fast feedback, and relate to company objectives and
11
manufacturing strategies (Neely et al. 1995). Performance indicators are an important part of the transformation from data to understanding (Ackoff 1989). With understanding, it becomes clearer what data is needed to achieve enhanced understanding. In Figure 3, the principle is displayed as the circle of wisdom.
Figure 3: The circle of wisdom, based on (Ackoff 1989).
A common influence on manufacturing strategies in manufacturing companies is lean production, which is also a philosophy which strongly promotes learning organizations (Jin & Stough 1998). According to the authors, mass production systems can achieve flexibility and balance between centralisation and decentralisation via a focus on learning capability. The concept of Key Performance Indicators (KPIs) (performance measurements) is used for monitoring, reporting and improving the organization (Liker 2004). KPIs often figure together with balanced scorecards and dashboards to achieve fast and effective information transfers. With meetings, discussions and further investigation information from KPIs can be converted into knowledge and an understanding of the manufacturing system. In lean manufacturing performance indicators are used to supervise operations and to achieve the main goal of waste elimination and increases in efficiency in the organization. The choice of measures is important due to the tangible risk of truing the organization focus exclusive of what’s being measured (Hauser & Katz 1998). According to Alder and Cole (1993) lean production is exceptional because it successfully integrates standardisation and learning, specialisation and integration. However, Goree (2002) stresses the importance of remembering that lean, six sigma, and other tools for standardisation are only tactic-support tools and not used to directly achieve strategies. To enable the use of tactical tools for implementing sound strategy, the data and information needed has to be adequate and correct (Cooper & Kaplan 1988). Therefore, it is important that performance measurements capture adequate organizational issues and the relevant performances of functions.
12
2.2.
Production location decisions
Two aspects are often involved when discussing the movement of production activities: ownership and location. More specifically, the movement of production activities can be summarized with the terms of relocating, offshoring/reshoring, and outsourcing/insourcing/back-sourcing. The three groups of terms relate to whether a production activity is moved within the company nationally or internationally or is sourced from someone else nationally or internationally. When moving manufacturing activities within the company, between national or international sites it is referred as relocating the activity (Kinkel et al., 2007). Outsourcing is characterised by the transfer of manufacturing activities from internal control to external control, letting a subcontractor produce products and components, often with the aim of reducing product costs (Nordigården, 2007). Back-sourcing/insourcing relates to the opposite, that the company performs the activity instead of paying someone else for carrying out the task (Bailey & De Propris 2014). Offshoring can refer to both manufacturing relocation and outsourcing, since the term relates to moving manufacturing activities abroad (Kinkel et al., 2007). Reshoring relates to company activities moving into the same region or country as the main facility (Johansson & Olhager 2016). Production location has been an interesting topic for researchers for the last five decades (Kinkel 2016). In Boloori, Arabani & Farahani (2012) the authors classify 66 models of dynamic facility location problems on what performance measures they use. In total, 48 of the analysed models use minimization of cost, time, distance and risk as main objectives, seven the maximization of profit and availability of services, and eleven use multi-objectives. The importance of cost awareness is for example raised by MacCarthy & Atthirawong (2003) and Platts & Song (2010). Ellram et al. (2013) present a list of driving factors for location decisions, that includes product (weight, material), costs, labour availability, available and knowledgeable partners for logistics, supply chain interruption risks, strategic access to market, consumers and suppliers, country-risks related to government and sustainability, and government trade policies. Costs are considered a key factor when analysing locating production. Nevertheless, the literature tends to overlook the integration of manufacturing costs with operational innovations and development. In Bengtsson et al. (2005) the authors present research results, that show that companies performing production development, have a significantly better profitability than companies outsourcing for cost reductions. In Oke & Kach (2012) the research results show that there is a positive link between companies’ operational innovations and financial performance, which can be achieved via business partners. Strøjer et al. (2017) suggest that decision makers tend to oversimplify the problem of location decisions
13
only using simple heuristics, such as customer location or low labour costs. The authors also imply that there is a need for more decision support empowering decision-makers with understanding and support to reduce the perception of complexity.
2.3.
Production performance costing
Traditional costing methods, including direct material, direct labour, and overhead costs, were implemented when a large proportion of the production cost consisted of labour costs, but along with the increase of equipment complexity and equipment costs the need for more detailed cost-models arises. Today it is not unusual that the cost of production personnel can amount to lower than 10 % of the total production cost (Mehra et al. 2005). There is a large number of cost-models for product cost and production operation reported in the literature, reviews summarizing the field can be found in Niazi et al. (2006), Xu et al. (2012), Jönsson (2012), Salmi et al. (2016), and Ståhl (2017). Depending on the model application and concept, cost-models can be classified into different categories. In Niazi et al. (2006) a comprehensive model classification is presented for product costing, which classifies models into four estimation techniques, divided into two groups depending on if the technique is quantitative or qualitative. The qualitative techniques include intuitive and analogical techniques, used to make cost estimates based on existing products. Qualitative techniques are usually employed in the early stages of product development. Quantitative techniques include parametric and analytical techniques, the first using statistical analyses of cost parameters and the second activity-based time estimations for cost parameter estimations. Each of the four main techniques can be divided into several subgroups. When estimating production operation costs, activity-based costing (ABC) is frequently addressed e.g. in Cooper & Kaplan (1988), Ong (1995), Koltai et al.(2000), and Özbayrak et al. (2004). Searching for (manufacturing OR production) AND activity-based costing on Google scholar returned 46,900 hits in February 2017. ABC is a method originally developed to perform a more accurate cost estimation than the traditional accounting system that was developed during the early 1900s (Cooper & Kaplan 1988). One of the main reasons for the development was to prevent poor information about product costs leading to bad competitive strategies for a company. Instead of the three cost categories: direct material, direct labour and overhead costs, ABC identifies the cost of each activity performed as support for the product that is to be ordered, produced and shipped to consumers. The product cost is estimated by estimating percentage of total work time needed for handling the actual order in each division in the company. In ABC, cost drivers are used to divide and analyse the cost-impact of different activities 14
and actions (Kaplan & Anderson 2007). Kaplan and Andersson further developed the method after receiving criticism. ABC is regarded as difficult and costly to perform and maintain and not sufficiently accurate, due to the estimation of percentage of total working time spent on the product (Kaplan & Anderson 2007). It has also been reported that the number of companies using ABC has declined since the middle of the 1990s (Innes et al. 2000). Also, the method does not take into consideration the fact that all working time is not utilized (Kaplan & Anderson 2007). In the new method, time-driven activity-based costing (TDABC), the total cost of each of the resources used in a department is divided with the available capacity of each of the resources to give a capacity cost rate. The cost rate is given in cost per minutes and is used to estimate the product costs of a product handled in a company resource. Kaplan and Andersson argue that the available capacity often could be estimated to 80-85 %, but that the aim should be to not have more than a 5-10 % margin of error, making the exact percent not overly important. Another category of estimation technique, also comprising the activities involved in the manufacturing operations and the time it takes to accomplish them, is operation/process-based costing. The models that can be classified by this technique are often associated with estimations of manufacturing cost using total process time, non-productive time and usage of performance parameters, such as set-up and other downtimes, quality rejections, and speed losses. Examples of models using the approach are presented in, for example Alberti et al. 1985, Dhavale 1990, Son 1991, Cauchick-Miguel & Coppinit 1996, Yamashina & Kubo 2002, Navee Chiadamrong 2003, Aderoba 1997, Needy et al. 1998, Ravignani & Semeraro 1980, Jung 2002, J.-E. Ståhl et al. 2007, Johnson & Kirchain 2010, and Rickenbacher et al. 2013. It is important to note that there are no consistent models, but that all process/operation-based models aim to describe the activity in an operation/process. Other costing techniques are for example, Lean accounting (Aghdaei 2012), to support, protect and utilize lean principles, culture and tools, and throughput accounting (Hilmola & Gupta 2015) focusing on bottleneck functions and stations for increased utilization. A costing approach also often incorporating process-related cost estimation is life cycle costing (LCC). LCC was developed with the intention of capturing the total cost of designing, implementing, producing, using, and disposing of a product. Publications presenting LCC including comprehensive production costing include, for example Branker et al. (2011) and Orji & Wei (2016). LCC uses different costing techniques and can incorporate both ABC and operation/process-based costing. A comprehensive summary and description of the various cost methods mentioned above can be found in Jönsson (2012). The level of detail in the different cost15
models can vary between cost methods and within each method. With a starting point from Jönsson (2012) and J.-E. Ståhl (2017), below is a table summarizing the cost-models named above stating the cost parameters and cost drivers included in the models, see Table 1. A variation of the table was previously published in Schultheiss et al. (2018). The analysis compares each of the models with regards to their ability to capture actions, performance and utilization on the workshop floor, based on the parameters considered in each model. In addition to the costmodel comparison presented in Jönsson (2012) and J.-E. Ståhl (2017) seven costmodels incorporating performance parameters have been added to the analysis and only models clearly describing the calculation method are considered in the comparison below.
16
x
x
x
x x
x x
x
x x x
x
x x x x x
Jung (2002) J.-E. Ståhl et al. (2007) Johnson & Kirchain (2010) Ravignani & Semeraro (1980) Colding (1978) Aderoba (1997) Dhavale (1990) Yamashina & Kubo (2002) Son (1991) Navee Chiadamrong (2003) Cauchick-Miguel & Coppinit (1996) Noto La Diega et al. (1993) Alberti et al. (1985) Branker et al. (2011) Diaz & Dornfeld (2012) Orji & Wei, (2016)
Kaplan & Anderson (2004) Koltai et al. (2000) Özbayrak et al. (2004) Needy et al. (1998) Rickenbacher et al. (2013)
Parameters Material costs Scrap price Indirect material Mass/Volume of product Inventory Production volume/order quantity Production period Equipment depreciation Equipment Payback Equipment life Equipment costs Fixture costs Computer Floor space Building costs Building life Utilities (not specific) Energy costs
Ong (1995)
Table 1: Assessment of cost-models and the parameters used, based on results in Jönsson (2012) and Ståhl (2017).
x x x x x x x
x x x x x
x
x x
x x x
x x x x x x x x x
x x x x x
x
x
x
x x
x x x x x x x x x x x
x x
x x x x x
x x x x x
x x x
x x
x x x x x x x x x x x x x x x x x x
x
x x x
x x x x x x x x x x1
x x
x
x
x x x x x x x x
x x
x x
x x
x x x x
x x
x x x x
Jung (2002) J.-E. Ståhl et al. (2007) Johnson & Kirchain (2010) Ravignani & Semeraro (1980) Colding (1978) Aderoba (1997) Dhavale (1990) Yamashina & Kubo (2002) Son (1991) Navee Chiadamrong (2003) Cauchick-Miguel & Coppinit (1996) Noto La Diega et al. (1993) Alberti et al. (1985) Branker et al. (2011) Diaz & Dornfeld (2012) Orji & Wei, (2016)
Kaplan & Anderson (2004) Koltai et al. (2000) Özbayrak et al. (2004) Needy et al. (1998) Rickenbacher et al. (2013)
Ong (1995) Parameters Tool costs Labour costs: direct Labour costs: indirect Labour efficiency Maintenance Repairs Logistics Material handling Preparation and kitting Rework Overhead costs Downtime Speed losses Setup Waiting (product) Idling Material scrap Quality: prevention Quality: rejects/failure Quality: appraisal Equipment utilization Equipment efficiency Investment efficiency Environmental aspects Cycle time Tool engaging time Idling in cycle Cutting data Tool life Tool maintenance Total number of parameters
x x x x x x x x x x x x x x x x x x x x x x x x
x x x x x x x x x x x x x x x x x x x x x
x x
x x x x x x x
x
x x x
x
x
x x x x x
x x x x x x x x
x x x x
x x x x
x
x x
x x
x
x
x
x x x x x x x x x x x x
x
x
x
x
x
x
x x
x
x
x x x x x x x x x x x x x x x x
x x x x x x
x x
x x x x x x x x x x x x x x x x x x x x x x x x x x x x
x x x x x x x x x x x
16 13 8 22 3 13 13 26 18 10 16 12 17 16 23 21 19 9 10 16 10 13
One of the major goals in this thesis is to use the knowledge of performance and capability in a production to support decisions on future developments and configurations. Therefore, it is important that the cost-model used captures as many 17
aspects as possible and especially performance parameters. The model used and future development is the model presented in Ståhl et al. (2007). It is a production performance part cost-model with a cost breakdown approach for manufacturing cost estimations. It can be seen in Table 1, that the selected model by Ståhl et al. (2007) involves more parameters and cost drivers than the other models displayed. However, the model lacks parameters connected to inventory and material handling. The cost estimation for the hourly equipment cost for running processes is displayed in equation 1 and equation 2 gives the process cost during downtime. The cost equation of the cost-model is presented in equation 1. For a parameter description, see the list of parameters at the beginning of this thesis. In equation 1, indexes from A-G are used. These indexes are connected to eight production factors used to assess and evaluate production performance, the performance losses. In addition to the six factors displayed in equation 3 there are also the F and H factors for specific process behaviours and unknown disturbances. It is possible to use these eight factors in a production performance analysis matrix (PPAM) (J.-E. Ståhl 2005), in accordance with Figure 4. In the figure, reported quality, availability and speed losses are connected to each of the eight factors to find the performance impact from different causes. (1 +
∙
)∙
=
(1 +
∙
)∙
=
= + + + +
18
60 60
1−
(1 − ) + (1 − ) − 1
∙
(1 − ) + (1 − ) − 1
∙
+
1−
∙ (1 −
1−
∙ (1 −
1−
1
1− +
(1 −
+
(1)
(1 −
)
+
+
(2)
+
+
) ∙
) (1 −
)
∙ 60
+
)(1 −
)
+
+
1−
1−
+ +
(3)
Quality parameters Q
Factors
Result parameters Downtime parameters S
Speed parameters P
∑ Factors
Tools Work material The value adding process Personnel and organization Wear and maintenance Specific process behaviour Peripheral equipment Unknown factors ∑ Result parameters
Figure 4: The basic consept of the PPAM, where disturbances connected to either factors or performance parameters can be summarized and displayed separately. (J.-E. Ståhl 2005).
2.4.
Decision support for production development and changes
“Decisions made on the basis of multivariate analyses are generally more reliable than decisions based on single factor analyses” (Badiru, 1991, s439). The statement made by Badiru suggests that decision support consisting of a quantitative model incorporating several parameters serves as better support than a model only using one or a few. The aim for development of decision support models and tools is to a high degree to support decision makers to include long-term perspectives, incorporating holistic approaches, and make knowledge-based decisions (Christodoulou et al. 2007) (Goodall et al. 2013). In Chiadamrong and O’Brien (1999) the authors argue that traditional justification methods are inadequate to distinguish between the available decision alternatives, to rank investment options, and to evaluate the sensitivity of cash generating investments. One of the main obstacles is the overemphasizing of short-term savings in direct manufacturing costs rather than promoting longer-term company strategic benefits offered by new systems (N Chiadamrong & O’Brien 1999). To facilitate production and make the resource utilization effective, there are decision support methods and models within different areas. There are methods and models applicable for strategic and tactical decisions within e.g. material handling Chen & Talavage 1982, Gorman 2010, scheduling and production planning Perrone et al. 2002, testing and validation Fallstrom et al. 1997, operation improvements Kaplan & Norton 1993, Jönsson et
19
al. 2012, system design and configuration Buede 2009, and plant location selection Bruch et al. 2014 among others. Decision-support can either be models to facilitate a plan of action including several steps to attain the knowledge needed to make the decision, or a model for one specific action. Depending on the type of decision and dependent on where in the organization the decision is made, the models and methods vary in configuration. The primary focus of this thesis is on decision support models for production, incorporating quantitative factors, such as time, quality, and cost.
2.4.1. Decision support tools for sequenced actions and decisions Decision support providing guidance for a sequence of different decisions and actions can be used both in connection to projects and everyday tasks. Structured work methods including dashboards, balanced scorecards and other tools presenting and surveying KPIs for production monitoring and continuous improvements are examples of decision support for everyday use. For larger projects, such as production system design and production system locationselection, there are models that are more comprehensive. For example, there are methods such as stage-gate/water-flow models where multiple evaluation tools and information sourcing approaches are gathered under a time-line structure providing a plan for action and decision points such as the one presented in Bellgran et al. (2013). Information models for gathering and processing information about corporation production systems are another example (Liu & Young 2007). The models and methods can suggest types of action and types of tool (Strøjer et al. 2017). Others, such as the model presented in Pehrsson et al. (2013) and Bellgran et al. (2013) provide a recipe for action and tools used in a specific way and sequence.
2.4.2. Parametric decision-support models There is a considerable number of different decision support tools for parametric analysis for defined problems. Two types of support will be described, support for cost-based decisions and multiple-criteria decisions. Cost-based decision support Cost has a bearing on almost every decision we make, what food we buy, what type of housing we live in, what subcontractor to use, what equipment to invest in, and whether a product should be produced inside the company or outsourced to a subcontractor. One of the first priorities of a company is to make a profit, making cost-based decisions very common in the industry. For example, cost-based pricing
20
is one of the most common pricing methods (Liozu & Hinterhuber 2012). According to findings in a survey presented by Brierley et al. (2006) costs are very important for decision making, for example 78 % respectively 83 % of the responding companies considered cost important or very important when deciding on new manufacturing processes and selling price. Commonly, the cost-methods presented in Table 1 were developed to support sound economic decisions. As can be seen in Table 1, the level of detail, and what parameters are included varies, indicating that the area of use differs. To return to the statement made by Badiru (1991), there are reasons to believe that cost-based decisions on multivariable constructions are more reliable than decisions made on cost-models using only one or few parameters. Multiple-criteria decision analysis Multiple-criteria decision analyses use several parameters to find optimal solutions through the optimization of specified criteria. In this field there are several different models and techniques. PROMETHEES is a multi-criteria decision-support using weighted parameters to find the best alternative of two or more options. J.P. Barns presented the method in 1982. A comprehensive literature review of publication using the method or developing the method can be found in Behzadian et al. (2010). Another multi-criteria decision technique is the Technique for Order Preference by Similarity to Ideal Solution (TOPSIS). The technique was developed by Hwang and Yoon in 1981 and is a ranking method trying to find the shortest distance to the ideal solution, minimizing the cost criteria and maximizing the benefit criteria (Behzadian et al. 2012).
2.4.3. Risk assessment through simulations in decision support Risk is always a factor when making decisions for the future. A summary of risk analysis and assessment methods is presented in Marhavilas et al. (2011). The authors suggest that it is possible to divide risk assessment methods into three categories: 1) qualitative, 2) quantitative, 3) hybrid methods. Qualitative methods are often based on knowledge and judgment whereas quantitative methods use monetary or discrete values (Jallow et al. 2007). Examples of qualitative methods are checklists, what-if analysis, safety audits, task analysis, sequentially timed event plotting techniques, and hazard and operability studies (Marhavilas et al. 2011). Examples of quantitative methods are proportional risk-assessment and decision matrix risk-assessment including probability, severity of harm and in the first case also frequency (Marhavilas et al. 2011). Other methods are quantitative measures for societal risks and the qualitative risk-assessment tool used to calculate individual and societal risk of accidents. An example of a hybrid technique is the
21
event three analysis, using decision trees and visually logical development models for possible outcomes of an event (Marhavilas et al. 2011). Another way of handling risk is to preform simulations and scenario analyses on possible outcomes to identify the magnitude of the effect of using wrong input data. The technique can be used in many different areas to find probable outcomes depending on different settings. Some examples of economic evaluations are Luo & Xia (2015) for production evaluation using net present value; Samandari et al. (2011) for cost and consequence analyse for tuberculous prevention; Morera et al. (2015) for the economic and environmental assessment of wastewater systems; and Fischedick et al. (2014) for the techno-economic evaluation of steel plants. One commonly used technique in scenario analyses is Monto-Carlo simulations (Vithayasrichareon & MacGill 2012), (Jallow et al. 2007), (Belaid 2011), (Hong et al. 2010), (Spang et al. 2014). The usage of statistical distributions of parameters instead of deterministic enteritis is preferred according to Wallace (2000).
2.5.
Sustainability and sustainable production
One of the first comprehensive definitions of sustainability was presented in the United Nations report (Brundtland) on environment and development (United Nations 1987). The report stated that the actions and developments of today should not endanger future generations and their possibilities for prospering. Over the years, different definitions of sustainability have been presented, taking different aspects into consideration. Elkington (1994) presented the first concept later called triple bottom line, stating that companies need to adopt a win-win-win strategy, which means, acting in a green business and including many different stakeholders for enhanced competitiveness. Triple bottom line refers to a prosperous economy, not harming the environment, supporting human well-being and providing a world were future generations can live unaffected by today’s consumption (Global Reporting Initiative 2000). The triple bottom line is often represented by three overlapping circles. Other ways of illustrating sustainability are the three pillars of, economic growth, environmental protection and social progress, and concentric circles, which illustrate that economic strength requires societal stability, which in turn is dependent on environmental balance. (Adams 2006). The three aspects, economy, environment and societal are in some publications accompanied by technology, but technology and education can also be seen as enablers (Garetti & Taisch 2012).
22
2.5.1. Sustainable production The United Nations stipulates 17 goals for sustainable development, one of which is responsible consumption and production. This goal includes, for example, targets for the efficient use of natural resources, a substantially reduced generation of waste through prevention, reduction, recycling and re-use, and encouraging companies to adopt sustainable practices and to integrate sustainability information into their reporting cycle (United Nations 2018). There are some differences in how researchers define sustainable production and consumption. In Glavič & Lukman (2007) a sustainable system is defined as incorporating responsible care, sustainable consumption and sustainable production. Sustainable development according to Koho et al. (2015) consists of sustainable consumption and sustainable production. Sustainable consumption here relates to the usage phase of a product and sustainable production to the production phase. Since responsible care in sustainable systems encompasses employees, transportation, process safety, distribution incidents, eco efficiency etc., (Glavič & Lukman 2007) the two definitions of sustainable production differ somewhat. To reach sustainable production a company must be profitable and be able to compete on the market while simultaneously keeping its environmental impact low and keeping the people who work for and who are affected by the organization safe and well, and that the organization maintains high ethics in all it dealings. The three dimensions in the triple bottom line, economic, environmental, and societal sustainability have a high degree of interaction and there is a huge amount of scientific publications discussing this interaction, for example, Barbier 1990; Isaksson 2005; Bunse et al. 2011; Rosen & Kishawy 2012; Ocampo et al. 2014; and Zhang & Haapala 2015. Corporate Social Responsibility (CSR) is a voluntary concept, whereas companies integrate social and environmental responsibility into the organization and in interaction with stakeholders. CSR works beyond common legal structures and endeavours to raise standard of invested human capital, the environment, and its relation to stakeholders (Commission of the European Communities 2001).
2.5.2. Synergy effects in sustainability and profitability Many of the indicators used to ensure production performance and manufacturing strategy interact with at least two of the sustainability dimensions, see Figure 5 for an example of possible positioning between indicators. In Zackrisson et al. (2017) it is reported that 90 % of reported indicators in seven studied companies can in some way be connected to sustainability. There is a very active research community analysing and finding alignment between lean and sustainability “lean 23
and green” where Diaz-Elsayed et al. (2013), Bhamu & Singh Sangwan (2014), and Garza-Reyes (2015) further investigate the synergy effects between different measurements, and indicators and the different sustainability dimensions.
Low Environmental Impact Emission Restriction Water resourcing
Energy Efficiency Material Efficiency Production Efficiency
Security to not be affected by environmental accidents Employee Awareness
Brandning
Responsible Purchasing
Market Competitiveness Profitability Health Programs Productivity Satisfied Employees
Profitability and Competitiveness
Employment Security
Well-being, Security, and High Ehtics
Figure 5: Interaction between the three dimensions of sustainability, based on Almström et al. 2017.
Productivity is highly related to satisfied employees, making well-being at work a competitiveness factor (Wilkinson et al. 2001), (Lind 2017). In Lind (2017), one of the findings indicates that the salary level has little impact on well-being at work. The same publication presents a programme for increased well-being at work. The result can be summarized as: 1) Do not demand too much energy and engagement resulting in negative stress and negative effects on life outside work. 2) Enable creativity, learning and education, use the employees’ competence, and provide a high level on influence over tasks to be performed. 3) Have a social working environment with open discussions and a climate wherein the organization can be challenged. At least two of the measures mentioned have a direct influence on corporate competitiveness, use the skills and competence present in the company, and enable learning and education in the company. In an interview study (Alayón et al. 2017) on nine industrial Swedish companies, respondents argued for that an open organizational culture increase the employee creativity. The same study find implication on that more learning and training increase the sustainability level in the company.
24
A profitable operation also involves efficiency in production, energy and material, which greatly affect environmental impact. According to Ashby (2012) about 21% of the total energy consumption can be connected to material production. In total the industry consume about 35 % of the wordly energy consumption. If less material is consumed then total energy and resource usage is decreased. Remanufacturing has a central role here to reduce resource consumption, especially of virgin material (Srivastava 2007). It can also be argued that material selection can affect all three sustainability dimensions. The material could be hazardous or generate an unhealthy working environment or hazardous waste or have a different impact on the environment when produced and have different levels of producibility, making the selection very important. Higher producibility has been proved to lead to lower costs (Asiedu & Gu 1998), and a part that is easier to manufacture can result in reduced energy consumption, fewer disturbances, and higher productivity in the manufacturing system. The choice of material also affects the ability to recycle the product after use (Ståhl 2005). The above is a central factor of the concept of Life Cycle Assessment (LCA) (Alting & Jorgensen 1993). Although, if a corporation wants to be sustainable it is not enough just to consider its own operation and activities but also the activities and processes in the supply chain at the raw material level (Srivastava 2007).
2.5.3. Indicators for sustainability Several reports and publications facilitate the measurability of sustainability and sustainable production e.g. Global Reporting Initiative (2017), Azapagic (2004), Veleva et al. (2001), Paju et al. (2010), (Krajnc & Glavič 2005), von Geibler et al. (2006), Tseng et al. (2009), Lundholm et al. (2012), Moneim Farouk Abdul et al. (2013), Nordheim & Barrasso (2007), Fan et al. (2010), and Winroth et al. (2016). The reports and publications above were selected based on their significant impact on sustainable production literature, complemented through a narrative search on complementary aspects. From the reports and publications mentioned above, the following categories have been identified in which reported indicators for sustainable and responsible production can be classified according to Table 2. These groups of indicators can be considered as important when benchmarking and developing decision support for sustainable production.
25
x
x
x
x
x
x x
x x x
x
x
x
x x
x
x x x x
x x x x x
x
x
x x x
x
x
x x
x
x
x
x x x x x x
x
x
x
x
x
x
x
x
x
x
x
x
x x x x
x
x
x
x
x x
x x
x x
x x
x x x x
x x x x x
Winroth et al. (2016)
x
Fan et al. (2010)
x
x
Nordheim & Barrasso (2007)
x
Moneim Farouk Abdul et al. (2013)
x
Lundholm et al. (2012)
x
Tseng et al. (2009)
x
von Geibler et al. (2006)
x
Krajnc & Glavič (2005)
x
Paju et al. (2010)
x
Veleva & Ellenbecker (2001)
Azapagic (2004)
∑ Land and facility occupancy 5 Water and natural resources 12 management and waste management Emission restrictions and air protection 10 Environmental rehabilitation, protection 4 and safeguarding Sustainable and efficiency energy 9 Transportation 3 Profitability and value adding 11 Production operations 6 Sustainable sourcing and purchase 6 Health and safety 9 Employee and stakeholder awareness 8 Employee and stakeholder satisfaction 10 End product use and recycling 6
Global Reporting Initiative (2017) [goal 12]
Table 2: Representation on the found classifications on sustainability measurements from selected publications
x x x x x x
x x x
2.5.4. Drivers and obstacles for sustainable production Drivers for sustainable production could be either external, such as legislation, competition and shareholder actions or internal, such as management vision, customer demand and the suppliers’ sustainable initiatives. Ageron & Spalanzani 2012 argue that findings in literature suggest that external pressures predominate. The occurrence of predomination of external pressure in terms of legislation is supported in Alayón et al. (2017), but pressure from costumer is also found to be one of the main drivers for small and middle size companies. Table 3 and Table 4 present an analysis of current literature showing drivers and barriers/obstacles for sustainable production implementations. The results are primarily from empirical
26
studies using surveys or interviews for gathering different views on sustainability from industries. The findings from the literature review on drivers and obstacles for sustainability improvements in manufacturing industries suggest that cost savings are one of the prominent drivers for sustainability improvements, together with governmental legislation, market advantages, and pressure from shareholders and stakeholders. In regards to obstacles for sustainability improvements, lack of understanding and knowledge, unclear and fuzzy authorization and lack of performance measurements are prominent reported reasons. According to the findings presented in Ries et al. 1999 sustainability in product design is hard to realise. For example, cross-functional integration is stressed as an important issue for the successful integration of environmental aspects. Another barrier for environmental integration is the overall industrial opinion of increased cost for design without adding value.
x x x x x
x
(Alayón et al. 2017)
x x x x x x x x
Lee (2015)
x x x x x x x x
Ageron & Spalanzani (2012)
Thollander & Ottosson (2008)
Drivers Cost savings Government legislation or threat of legislation Pressure from shareholders Market advantage or dependency Pressure from stakeholders A ‘Champion’ within the organization Protection or enhancement of reputation and brands Pressure from non-government organization Avoiding risk, or responding to accident or environmental threats Societal expectation Financial benefits Networking and inspiration Certification Employee retention
Dummett (2002)
Table 3: Drivers for sustainable production found in literature.
x x x x
x x x x x x
27
28
Lee (2015)
Oxborrow & Brindley (2012)
Le Roux & Pretorius (2016)
x x
x x
x x
x x
x
x
x
x
x x x x
x x x x x x
Mittal & Sangwan (2011)
Obstacles Authority levels hamper implementation Lack of understanding and knowledge Lack of performance measures/or access to measurements/lack of traceability Lack of information Lack of resources and capability Lack of clear strategy Conflicts of interest within the company High cost Uncertainty regarding the company's future Lack of human resources No/weak legal structure Pricing and tax barriers Lack of government support Lack of alternative technology Technical risk for production disruptions/quality problems Cost of production disruptions/inconvenience Lack of public demand Slow rate of return Fear of success Possible poor performance of equipment Other priorities for capital investments Cost of identifying opportunities, analysing cost effectiveness and tendering Dep./workers not accountable for energy costs Investors cannot capture the benefits of improved efficiency Lack of supply infrastructure Lack of sustainable focus on all three pillars Lack of communication and no clear directives Lack of long-term view and “short-cut” behaviour
Thollander & Ottosson (008)
Table 4: Barriers and obstacles for sustainable production found in literature
x x x x x x x
x x x x x
x x x x x x
x x
x x x x x x x x x x x x
2.6.
Conclusion of findings from literature
The industry is struggling to make the “correct decision” every day. Production planners have to decide on batch sizes and order of production, production engineers on what “fire” to be extinguished and production managers on what improvement projects to run and what long-term improvements to make. Still there are other aspects, such as market fluctuations, access to skilled personnel, product patents, and laws and regulations to consider. In a high cost country, such as Sweden there are always companies thinking to relocate or outsource production and making the huge decision on where to locate operations. Researchers and companies have realized that the grounds for location decisions are not always thorough enough. This calls for more in-depth analysis, to prevent unnecessary and costly decisions. This thesis provides analysis and decision support, using information about performance and capabilities in a production system, compelling production personnel to see the relations between action and outcome, enhancing the understanding of the system and supporting organizational learning. Although, there are many drivers for sustainability and the need for a more sustainable society is imminent, the driving force to managing a manufacturing company that has a sustainable incitement is limited. One of the top reasons from decision makers for adopting sustainability is to be cost-efficient, but cost is also one of the main obstacles for sustainable implementation. This calls for better decision support incorporating clearer synergy effects between corporate performance and sustainable production. There is research in this area (DiazElsayed et al. 2013), but the level of detail is low with regards to cost-modelling, therefore making the intersection between cost and performance connected to sustainability hard to pinpoint. This thesis will provide research containing knowledge and a way of identifying synergy effects between production cost efficiency and sustainability. The research presented in this thesis is based on the cost-model presented in Ståhl et al. (2007), hereafter called the cost-model. The cost-model is a technical costmodel for production system cost estimations including performance and capability parameters. However, the model does not capture the cost of material handling and storage, which part of the presented research in this thesis will cover. Furthermore, the model was developed to also support cost estimations of process-oriented production including the cost of tied-up capital.
29
30
3. Methodology
This chapter presents the research design and the research methods used. After an introduction, the main research methods are presented, followed by a presentation of the research design in each of the appended publications.
3.1.
Research philosophy and approach
According to the OECD, research and development are considered to cover three activities: basic research, applied research, and experimental development, where experimental development includes, for example, systematic work on existing knowledge gained from research to improve sustainability to products/systems already produced or installed (OECD 2016a). Applied research is defined as “original investigation undertaken to acquire new knowledge. It is, however, directed primarily towards a specific practical aim or objective.” (OECD 2016a). Unesco defines research and development as, “Any creative systematic activity undertaken in order to increase the stock of knowledge, including knowledge of man, culture and society, and the use of this knowledge to devise new applications” (OECD 2016b). The research presented in this thesis falls into the category of applied and industrially oriented research. The research can be classified in the interdisciplinary field of operational management research and production development. The philosophic basis of the research design in this thesis is predominantly of interpretative and hermeneutic character, and in line with the essence of the philosophies to increase general understanding (Stenbacka 2001). In interpretative research, the observer is part of that which is being observed, which when conducting case studies and interviews is often the case. A production system relies both on humans and technology, which means that information must be collected and analysed both with qualitative and quantitative methods. The research method design involves both these methods, mostly connected to inductive research. In deductive research the researcher conducts the research based on a hypothesis and logical contradiction of freedom, while in inductive research the researcher uses research questions to narrow the scope of the actual study to draw more general
31
and theoretical conclusions (Wallén 1996). Inductive research has been criticised because of the impossibility to make unprejudiced observations (Stenbacka 2001). It has been argued that inductive research can be used to study a specific situation or system where new knowledge and experiences add systematically to existing knowledge and experiences (Wallén 1996). The main objectives for this thesis are to develop models and concepts for economic industrial decision support and assess them in industrial environments. Although the research in this thesis aims to develop decision support using and evaluating quantitative measurements for decision making, a large portion of the research involves qualitative methods to analyse the need for cost related parameters, through observations and interviews. Qualitative research has also been used to further strengthen the right to exist of the research conducted, and to gather information not quantified into measures, not existing in information systems, and to evaluate results. Quantitative research, which often aims to emphasize the measurement and analysis of causal relationships between variables (Golafshani 2003), has been used in modelling and further development of the costmodels. To enable the objectives of the thesis, empirical studies have been performed. Empirical data has been used in most of the studies presented in this thesis. The working methods used when performing empirical studies correspond to the approach described by Flynn et al. (1990). It is a four-step approach on how to conduct empirical studies (1) Articulating the theoretical foundation for the study and determining whether the aim is to build theory or verify ditto. (2) Select research design. (3) Select one or several data collecting methods. (4) Collect and analyse data. The approach also corresponds to a multi-methodical framework developed for applied research in system development by Nunamaker et al. (1990). The framework consists of four research strategies: theory building, experimentation, observation, and systems development. In the concept of production development, experiments can also be considered as industrial testing since both can be used to ensure the feasibility of a model (Jönsson, 2012).
3.2.
Research methods
The research was mostly conducted on or with industry partners and has mostly been part of lager research projects, including both academia and industry, aiming to provide the industry with knowledge on how to take different decisions concerning their production development. During the research work several different methods were used to access data and information, develop models, and for analysing results. The following sections will describe the main research methods that were used and how they were implemented in each of the studies presented in the appended publications. 32
3.2.1. Literature review The literature reviews conducted in connection with the research presented, mostly used narrative methods (Cronin et al. 2008) (Randolph 2009). Depending on how important the element for investigation was for the study, the literature review differed in structure. When literature review was considered as one of the main contributions to a study, a structured approach with well-defined goals of the review with clear and defined search words and time frames for the investigation was recorded. Primary search engines/sources in these cases were Scopus, complemented with Google Scholar and individual journals. The reference lists from relevant publications were reviewed to find additional publications. The approach is similar to systematic literature reviews, although no in-depth-metaanalysis or statistical analyses have been conducted to support the method. The application has been to find quantitative records of sustainable indicators reported in literature and for finding production cost-models and the parameters used for cost assessment.
3.2.2. Empirical studies and data collection Several of the studies presented in the appended publications include empirical studies and data collection to develop, test and implement proposed decisionsupport. The aim has been to investigate and understand real-life cases from which to learn and find important circumstantial conditions (Yin 2014), relevant to decision support development. According to Wallén, the result from a case study can be hard to generalize, which is important, since generalizability is the foundation of applicability (Wallén 1996). Therefore, the result from each study must be discussed in its context, analysed to find the specific elements of each application. In addition, the data collection involves several different sources for evidence to increase the validity of the research results (Greene et al. 1989) (Yin 2014). The sources used for the evidence included in the studies in the appended publications can be related to all the six major sources of evidence presented in Yin (2014): documentation, archival records, interviews, direct observations, participant observations and physical artefacts. The procedure for an industrial case study was to start with a discussion and clarification of the aim of the study with industrial partners. A discussion on how the result would be presented internally and externally was also performed in an early stage. Since the majority of the case studies required data acquisition from multiple sources/functions within the company a team of contact person was established, with whom the information required was retrieved and discussed.
33
Interviews have been used frequently for data collection. The most common approach was semi-structured interviews with predefined sets of questions with the option to broaden the discussion during the interview. The aim of the interviews was to gain knowledge about working methods, issues and problems and relevant information from the companies that were studied. During the research, interviews were conducted both as the main research activity to understand common practices at the companies involved in the projects and to gain relevant background information for the research project as well as for acquiring supplementary knowledge. Interviews were also conducted as a pre-study to Paper III. In connection to all interviews the respondents were informed of the research aim, why they were selected and how the replies would be treated, which is in line with statements for how to approach respondents according to Hannabuss (1996). It is important to remember when conducting an interview that the answers are the interpretation of reality and perspective from the respondents, and not the absolute truth, and should be treated accordingly. Therefore, when gathering quantitative data, several sources were used (Golafshani 2003) when possible. The interviews in Paper I, III IV, and V were complemented with data from internal systems, time studies and observations. Workshops were frequently used for common discussions among partners in both research projects on selected issues and for intermediate results.
3.2.3. Quantitative mathematical modelling The main part of the quantitative research performed in connection with this thesis has been mathematically modelled to develop cost-models and decision support tools for the industry, where the models were implemented in Excel and Mathcad. Mathcad has mainly been used for assessing and emphasizing mathematical relationships between variables and to handle large data-sets in extensive models. In addition, to provide simulations and what-if analyses. Excel has been used to create easier interfaces and for industrial implementation.
3.2.4. Survey Survey research originates from social science and is frequently used within health and medical services to gather information from a pre-determined population. The advantage of survey research is the possibility of being able to gather a large amount of empirical data, in a short while, from a large population which could with the right conditions be generalized. The disadvantages are connected to the risk of gaining data of insufficient detail, and assuring a high response rate and that significant data can be neglected due to a focus on range coverage instead of 34
detailed supplementary questions (Kelley et al. 2003). A web-survey has been used to gather information from the Swedish manufacturing industry.
3.3.
Research design in appended publications
The following section will briefly present the research design of each of the appended publications. First a summary of the methods of each of the appended publications is presented, see Table 5. In the table, (x) stands for findings from previous studies, that were used. Table 5: Research methods in appended publications. Empirical data collection
Quantitative mathematical modelling
x
x
II
x
x
III
x
x
x
x
Paper
Structured literature review
I
IV
x
V
x
x
VI
(x)
x
x
x
VII
x
VIII
x
Survey
x x
3.3.1. Research design in Paper I A production performance analysis regarding downtime and downtime pattern. The paper presents the results from an empirical study of a highly automated production line consisting of two to three manufacturing stages with peripheral equipment before, after and in-between. The data was primarily gathered via a semi-automatic data collecting system, where either the information is logged through use of sensors or manually by the operators. The information is complemented with manual time observations at the line, interviews with operators, production engineers and controllers, and data gathered from other information systems. The analyses are performed to investigate downtimes (DT) and times between failures (TBF) and the production cost related to availability failures in the line. Five products were selected in cooperation with the case company based on the mean cost of downtime. The products represent both 35
products of smaller sizes with fewer problems during operation and products of larger sizes where problems occur more frequently during production. Batches produced during 2010-2011 were randomly selected to serve as a base for the analysis. In total, 97 batches where investigated. Statistical distributions were used to find the probability level of certain manufacturing part costs for each of the five products. For root-cause analysis, a production-performance-analysis-matrix (PPAM) was used, dividing each of the reported downtime causes into the eight factor groups. The cost of downtime was divided depending on product, batch and downtime cause. A method for cost distribution was developed.
3.3.2. Research design in Paper II CPR a general Cost Performance Ratio in Manufacturing - A KPI for judgement of different technologies and development scenarios. The paper presents the Cost Performance Ratio (CPR) based on mathematical modelling of empirical data from a company in a Swedish manufacturing industry mainly using machining operations, which was modified for confidentiality reasons, using the programme Mathcad. The examples are based on data from real life decisions for equipment investment. Empirical data was gathered though interviews with industry representatives from the case company and equipment producers, using a pre-designed form for data gathering. The systems investigated are designed to produce small electrical needles using machining operations. The results from the mathematical modelling (with real numbers) were presented and evaluated by the board of the case company. Three alternative systems to the current reference system were evaluated based on their investment cost, performance, and capabilities to find the best economic solution related to the perceived volume of annual production.
3.3.3. Research design in Paper III A cost-model for determining an optimal automation level in discrete batch manufacturing. Empirical data of a production system was used for model demonstration to emphasize mathematical relationships between manufacturing related variables. Based on the empirical data the relationship between the automation factor xaf and performance parameters was established for the six different system configurations (A-F) of the current system. System A corresponds to the configuration with the lowest level of automation and System F with the highest. Based on the mathematically adapted relationship, the performance parameters used in the cost36
model are provided as a function to xaf, for example, such as the cycle time t0 used in the cost-model such as t0(xaf). Through mathematical simulations the part cost of different production system configurations using different levels of automation was studied. The configurations were also investigated based on their capability (0 – 600 000 parts/year) and different possible batch sizes from 100 – 10 000 parts/batch.
3.3.4. Research design in Paper IV Cost-models of inbound logistics activities: supporting production system design. The paper presents the empirical results from cost-model development and case studies, finding monetary values of material handling activities. The study was conducted at a company supplying the heavy vehicle industry, Company A. Later, the models were tested at Company B, also a supplier to the same industry. Two cost-models were developed and tested, one detailed and one for more rough estimations. The study was divided into two parts, first a development phase, identifying the system functionality and understanding which parameters were important for describing the cost allocation correctly. Second, determining values of specific parameters and information on how to obtain them, together with case studies giving the monetary value of inbound logistics costs. The model development was conducted using the following research methods: literature review, interviews, and observations at the production including time studies. The literature review was to find inspiration during model development and to identify the most important factors connected to company internal material handling. The interviews were with approximately 20 employees at each of the companies, including everyone from operators/assemblers to CEOs. The interviews were mostly semi-structured using a prepared set of questions, both open and closed, but there were also more spontaneous questions and informal discussions, especially on the production floor level. For information regarding working methods, observations at the site were followed by short interviews. During the last phase of the study, observations in terms of time studies were conducted in connection with the case study. The chain of research methods in connection with the case companies is described in Figure 6.
37
Figure 6: The chain of research methods conducted in the study presented in Paper IV.
In Company A, the only production method is assembly and in Company B both machining and assembly. At Company A, three products at three different assembly lines were investigated in the case study. The products were high volume products, similar in size and in constituent components. At company B, one product was investigated in the study. The use of two case companies was to ensure that the information used in the models was generic and not company-specific and to obtain extra data when comparing the two models.
3.3.5. Research design in Paper V Cost assessment of a production system – A method targeting a product’s aggregated value stream cost. The paper presents an empirical study of 10 randomly selected orders at a production site, using 38 production steps from raw material to finished product. The findings in Paper I were used for the modelling of material handling costs. Due to different settings, modifications were made from previous findings in Paper IV. The paper also presents a development of the production cost-model, so that it also includes the cost of tied-up capital. The methods used in this case study were interviews with personnel and extracting information from documentation on production related times, investments, and cost of equipment, buildings, material handling services, and personnel. The interviews were both semi-structured and unstructured, and were mostly conducted with operating personnel but also with process managers and controllers to understand the processes better, verify documented data, and to get relevant information about costs and times concerning the processes.
3.3.6. Research design in Paper VI Cost-modelling as decision support when locating manufacturing facilities. This paper summarizes the results from previous research results. An interview study with industrial partners (Windmark & Andersson 2012), providing evidence
38
that companies would benefit from structured and comprehensive decision support regarding cost calculation and estimation for location decisions. The literature confirms the relation between cost minimization and production relocation, and that the industry would benefit from in-depth cost-based decision support. The paper presents a decision framework for location decisions, including findings in Paper I and the Production location handbook (Andersson et al. 2013), an overall result from the project ProLoc. Based on findings in literature regarding which important functions to take into consideration and how to categorize parameters, a framework for location decision support was developed in excel. To demonstrate the importance of using in-depth estimations, an example scenario analysis was also presented using quantitative mathematical modelling.
3.3.7. Research design in Paper VII Assessing sustainability using a cost-model for development of a framework for sustainable production evaluation. A literature review was conducted to find sustainable indicators used for assessing sustainable production. The search words used were “sustainable manufacturing indicators”, “parameters sustainable production”, “sustainable key performance indicators”, “sustainable production indicators” and “key performance indicators”. In the review, both Scopus and Google Scholar were used to find relevant literature. The paper reviewed in the study reported indicators connected to manufacturing/production. Twelve papers were selected for analysis of the connection between reported indicators and the parameters in the cost-model. Based on the findings, a framework for assessment of sustainability in production was proposed. To enhance the ability to evaluate sustainability, an assessment of indicators not at all represented by the parameters in the cost-model and indicators occurring in four or more publications, was emphasized and used in the framework design. A narrative literature review on composite index was also conducted to find inspiration for framework design. The framework converted qualitative data to quantitative data, facilitating analyses, evaluations, and comparisons between products.
3.3.8. Research design in Paper VIII Sustainable production with a cost perspective – driving the industry to embrace sustainability thinking. In Paper VIII, a web-based survey was used to find the perceived view of cost drivers and sustainability from decision makers in Swedish manufacturing
39
industries. A literature review was conducted to support the development of the questionnaire regarding cost drivers in production and drivers/obstacles for sustainability in industry. The aim of the study was to investigate the perceived important cost drivers in industry and the drivers of sustainability improvements performed and the extent of sustainability improvements in Swedish manufacturing industries. The survey was used to confirm that cost and management attention are important for sustainability developments in Swedish manufacturing industries and therefore justify the development of connecting costs to sustainability for facilitating decisions for increased sustainability. The survey was a mix of questions including multiple choice, free-text and rating answers. A Likert scale was use to assess the perceived level of sustainability improvements implemented at the company of the respondent. In total, 23 companies were asked to answer the survey and 18 responses were received. The companies had the opportunity to provide more than one anonymous answer. This was to ensure that views were received both from production managers and sustainability managers. The number of replies and that several responses can be from the same company only makes it possible to use the results as an indication of how representatives in Swedish manufacturing industries perceive costs and sustainability and no solid conclusions can be drawn from them. The survey was sent out electronically, using Google forms. A modified version of the cost-model was used in the industrial case using empirical data from a heavy vehicle company to show the relationship between cost savings and the reduction of carbon dioxide emissions based on simulated improvements in performance parameters.
40
4. Research Results
The results from the research conducted are presented here. An overview of the objectives of the research questions and appended publications is followed by sections answering each of the two research questions with use of the appended publications, additional research contributions and some unpublished work.
4.1.
Overview
Each of the appended publications contributes either a model application, model development of the cost-model, or framework for decisions. Each of the contributions from the publications is shown in Figure 2. In the publications contributing to model development, parameters and cost items are added to the cost-model, providing a larger range of aspects to take into consideration when conducting an economic assessment in production systems. In publications providing model applications, the cost-model is used or altered to provide information for specific decisions. Decision frameworks are considered here to be structured tools and data collecting methods or support for conducting an overall decision involving multiple aspects. As can be seen in Figure 2, Papers V and VI are based on the findings in Paper IV; and Paper VIII which uses the results from Paper VII. Table 6 presents the objectives of each of the two research questions and Table 7 shows the contributions to the research questions from each of the eight appended publications.
41
Table 6: The objectives of each of the research questions. Research question
Objectives
RQ1:
How can a performance-based part cost-model be applied and further developed to capture the information necessary for decisions on manufacturing system design and configuration?
To develop the cost-model, providing additional cost items for more comprehensive decisions and to adapt the model for specific application supporting sound decisions.
RQ2:
How can cost-based decisions be complemented with a sustainability perspective to support strategic decisions for sustainable production?
Assess and facilitate sustainable production, using a production performance–based costing perspective.
Table 7: Appended publications contribution to research questions. Paper
RQ1
PI
x
PII
x
PIII
x
PIV
x
PV
x
PVI
x
PVII PVIII
RQ2
x x
x
Figure 7 illustrates how the appended publications together with additional publications contribute to production system research and development.
42
Figure 7: Research coverage in appended and supplementary publications.
4.2.
Summary of appended publications
The objectives in and findings from each of the eight appended publications are summarized below.
4.2.1. Summary of Paper I A production performance analysis regarding downtime and downtime pattern. The production system investigated in Paper I has a high level of automation, which needed extensive adjustments before starting the production of a new batch, resulting in high part cost for small batches. The objective of the study was multiple 1) To find the distribution of downtime causes to support future production development 2) To find opportunities of potential for improvements 3) Analyse 43
how well the manufacturing economic efficiency corresponded to overall equipment efficiency (OEE). In the paper, the cost of downtime is allocated both per product and per cause of disturbance for the five products and the eight factor groups of disturbance, presented to Figure 4. In Figure 8 the cost allocation for downtime costs for 25 batches of one of the selected products is shown. Each of the different colours represents disturbance costs related to a factor group A-H. Great variation existed in the level of disturbances both between batches and between products.
Figure 8: The cost allocation of the downtime cost for each of the 25 batches of a selected product (Stål et al. 2012).
Some of the findings showed that a considerable amount of downtime cost could be attributed to recurrent problems, especially for the larger products, with the peripheral equipment. Disturbances connected to equipment failure occurring during meetings and brakes and unplanned maintenance were other reasons for high cost of downtime. The findings also indicated that there is a need for improving reporting system, since a considerable amount of the reported disturbances only could be allocated to un-known factors (H). In this case, downtimes related to factor H mostly are consisting of short stops under five minutes, amounting to 10-12 % downtime rate losses, and thus being the factor that contribute to most downtime costs. The analysis further showed that it was not possible to use the approximate approach for calculating the derivative of the part cost based on specific parameters presented in Ståhl et al. (2007). The approach can only be used for downtime rate lower than 0.4, or the error it entails becomes considerable (Ståhl et al. 2007). In the batches analysed the downtime rate exceeds 0.4, which prevents the use of the method previously proposed. To handle cost allocations associated with large values for downtime rate (qS), a new equation was developed, see equation 7 and 8
44
in Paper I. An illustration on how the model allocates the cost distribution based on the eight factor groups is presented in Figure 9.
Figure 9: The cost of downtime is proportional to the share of the downtime rate for each factor of disturbances (Stål et al. 2012).
The mean downtime rate varies between the values of 33 % and 53 %. The results from the study imply that OEE and manufacturing economic efficiency correspond well with each other.
4.2.2. Summary of Paper II CPR a general Cost Performance Ratio in Manufacturing - A KPI for judgement of different technologies and development scenarios. The objective of the work in the paper were to provide a method on how to compare and evaluate equipment when designing and configuring a manufacturing system resulting in the development of the Cost Performance Ratio (CPR). To be able to compare the cost efficiency and the capacity of different equipment, the CPR is based on the cost-model for manufacturing, including performance and capability parameters/variables such as cycle time, batch size, market demand, quality rate, downtime rate, material losses, annual production time, personnel costs, and investments, among other things. Included in the paper is a model presentation with three examples of how the model can be used/implemented. The main approach is
45
to have a current or known reference system, on which other systems are benchmarked. A CPR can be absolute or relative in comparison to a current or given reference system, dependent on the level of accessible information. The two categories can be defined accordingly, where the CPR in the equations is presented as κCPR. I)
The CPR is given by the ratio of the estimated part cost of the reference system and the new system for evaluation. The estimated ratio can be a function of one or several production parameters or variables. Here in equation 4 it relates to market demand (MD). (
II)
)=
( (
) )
(4)
The aim is to find the corresponding cost of changes within a factor group to gain an equal or lower part cost when compared to the reference system j. The relative CPR is the ratio between studied parameters for the reference system and the investigated system i, where the calculation is based on a cost neutral relation with respect to the estimated part cost based on parameter z, see equation 5. ( )=
( ) ( )
(5)
The three examples in the paper relate to categories I and II. The first, related to category I CPR is a comparison of three new equipment concepts and a reference system that currently is in use at the company. The last two examples are related to category II CPR. The first example investigates at what level of investment equipment with different performances, productivity and capability result in cost neutrality when compared with the current system. The third, what maximum cycle time each of the investigated systems can have in relation to the investment level K0. A value above 1.0 gives a system performing better per monetary unit than the current system used as reference. The CPR can be used for investment analyses, in both a current system and for analyses of future systems at new production locations. The methodology could also be useful when investigating the best alternative in a manufacture or purchase decision. The CPR can be used to evaluate the intended equipment based on the batch size, see Figure 10. A CPR above 1.0 corresponds to a better alternative than the reference system. In Figure 10, System 3 provides a better cost impact than the reference system when producing batches larger than 30 units, System 1 50 units, and System 2 about 75 units. Based on the capacity of the indented system and the estimated market demand, varying amounts of equipment may be needed. Figure 46
11 presents the scenario simulations of four different systems giving the required number of machines (number of indentations) needed to produce a certain number of products per year and the related part cost. System 2 (black line), for example, is very interesting for an annual production of 7-10 million parts (one set of equipment) or 17- 20 million parts (two sets of equipment), but for volumes lower than 7 million parts and 10-17 million parts, system 1 and system 3 provide better economic solutions. Investment in system 2 also entails a higher risk since the system when compared to system 1 and 3 is more sensitive to changes in volume. 1.2
κCPR [-]
1.15
Sys (3)
1.1
Sys (1)
1.05
Sys (2)
1
Reference Sys.
0.95 0.9 0.85 0.8
0
20
40
60
80
100
120
140
160
180
200
N0
Figure 10: The CPR in relation to batch size (N0) for the four different systems. (Windmark el al. 2018). ki
0.8
[SEK] 0.7
(2)
0.6
Reference
0.5
(1)
0.4
(3)
0.3 0.2
0
2
4
6
8
10
12
14
16
18
20
MD [106 unit/year]
Figure 11: Number of machines needed (number of indentations) to attain required annual capacity and the related part cost for the four different systems (Windmark el al. 2018).
47
4.2.3. Summary of Paper III A cost-model for determining an optimal automation level in discrete batch manufacturing. The objective of the paper is to present a way to assess the optimal automation level based on cost and capacity. The paper presents and demonstrates the relationship of the automation factor and part cost for six development scenarios (A-F) of a current production system D, see Figure 12. The development scenarios range from nine operators in configuration A to one and a half operators in configuration F. The factor for level of automation, xaf, can be described by the quote of the cost of equipment and the cost of equipment and personnel, see equation 6 in Chapter 4.3.1. A high xaf is equal to a high relative cost of equipment. The paper presents seven steps on how to insert the automation factor xaf into the cost-model. The method relates different performance parameters to the automation factor and calculates the part cost as a function of the automation level.
Figure 12: The six different configurations of the manufacturing system giving different levels of automation, where configuration D is the refrence system in operation at the case company (Windmark et al. 2012).
Empirical data from a case company was used for the model demonstration and to find the actual optimal automation level provided by six configurations of the production system in question (reference configuration D), see Figure 12. Manufacturing part cost and production capacity are simulated as a function of the automation factor. The findings show that the batch size has a large influence on what system to choose, for smaller batch sizes, system A and B provide lower costs, but the system does not allow for large capacities due to longer cycle times. Configuration E provides the estimated highest capacity. In this case, the maximal production capacity PC and the lowest part costs are not found at the same value for the automation factor xaf. For larger batches configuration E provides both the lowest cost and highest capacity. The scenario simulations are presented in Figure
48
13, where the lines represent the fitted functions, and the points are based on discrete values. k
250
[SEK/part]
A
B
C
D
E
N0 =
F 100
200 200 150
100
103 104
50 0.3
0.4
0.5
0.6
0.7
0.8
0.9
xaf [-] PC
600
D
E
F
[Parts/y] 400
N 0 = 104
A
B
C
3
10 200
200 100
0 0.3
0.4
0.5
0.6
0.7
0.8
xaf
[-]
0.9
Figure 13: (Above) The part cost k shown as a function of the automation factor xaf for each of the production systems A-F and (below) the annual production capacity PC in terms of the number of 103 parts produced per batch (Windmark et al. 2012).
4.2.4. Summary of Paper IV Cost-models of inbound logistics activities: supporting production system design. From the reviewed literature, it was found that relocation and offshoring are driven, among other things, by costs/production costs, which makes reliable and accurate production cost-estimations important. The aim of the paper is to develop a costmodel for calculating the inbound logistics/material handling costs per part at the current location, making it possible to break down and distribute the costs between various parameters and cost drivers. Another motive is to find a model for estimating material handling costs at new facilities. The paper presents two costmodels with different levels of detail for inbound logistics, one model for current production, incorporating more detail and one for a future production system. Both models were developed to be able to be integrated in the manufacturing cost-model. The cost-models of material handling were developed at one company supplying the heavy vehicle industry, and later implemented and tested at another vehicle subcontractor, to analyse data accessibility and to compare the results from each of the models. The first company used assembly as the only production method,
49
whereas the second used both machining and assembly when producing the investigated product. As the manufacturing cost-model provides the cost per part, the models for material handling were developed to give the cost per part. The developed models transfer cost of overhead to products and processes, clarifying cost allocations and targets for production development. A product/part is often a combination of several components, and to be able to allocate cost based on size and number of components a pallet equivalent pe was designed. The pallet equivalent gives the corresponding share of a pallet, distributing the number of handling points and handling time on the components, resulting in, after summation of each of the costs related to a component, the total cost of material handling of a part/product. The pallet equivalent is illustrated in Figure 14. In the figure, the cube illustrates a part and each of its components by the smaller cubes building up the total amount of one part.
Figure 14: The pallet equivalent, pe, distribute the time and cost dependent on component size and filling ratio of the pallets.
The detailed model consists of four groups of cost drivers: personnel costs, kG.DIL, equipment handling costs, kG.CIL, storage costs, kG.SIL, and maintenance costs, kG.EIL. The simplified model summarises the total cost divided by the number of products produced, giving an average cost. When comparing the cost outcomes from the two models at Company A, the detailed model provided inbound logistic costs corresponding to 11-16 % of the production cost and the simplified 13-14 %. In the study at Company B the detailed model provided a cost corresponding to 19 % of the production cost and the other 21 %. The results indicate that the two models generate similar results, where the detailed model gives a larger interval and the less detailed mean values. The pallet equivalent is used in the simplified model for a more accurate cost allocation, if not used, the inbound logistics cost at Company B would amount to 9.5 % of the production cost due to different sizes, numbers of handled components for the company’s products, and large differences in annual production volume between products. The detailed model can be used when investigating how changes in the material handling system affect the production
50
performance and thereby the total cost; and the simpler model for estimating cost at new plants.
4.2.5. Summary of Paper V Cost assessment of a production system – A method targeting a product´s aggregated value stream cost. The aim of the paper was to develop the production cost-model into a processoriented production system to include the cost of capital for both material and equipment and to analyse the cost distribution. The relationship between costs for manufacturing, material handling and capital is investigated, as well as related to the lead-time and chosen internal rate of return. The areas of analysis are illustrated in Figure 15.
Figure 15: Areas of investigation for each of the 38 production steps (Windmark and Andersson, 2018).
The paper presents a cost analysis of 38 production steps in a of a process-oriented production layout, using cost aggregation throughout the whole production system, capturing the value adding of a product with high material costs. The analysis was on 10 orders of one product produced during the last half of 2016. The orders were randomly selected but distributed over the entire period. The production steps involved metal cutting, welding, heat treatment, cleaning, quality assurance and assembly, with long cycle times and lead times over months. In the analysis, the cost of engineers, controllers, maintenance personnel and management are not taken into consideration. The material handling at the factory was outsourced making the cost dependent on the number of movements and the rental cost of space connected to forklift aisles and storage space. Because of the large size of the product, only one product was moved at a time. To establish the impact of the chosen level of internal rate of return, the analyses involved three different interest rates: 5, 13 and 25 %. When using the 25 % interest rate, the cost of capital for equipment was only considered to be 13 %. Figure 16 presents the cost distribution when using the 13 % interest rate. The material handling cost never amounted to more than 0.6 %. The cost of tiedup capital was as least 1.4 % and at most 11.3 % of the total production cost. In the case study the material cost contributed to a large part of the cost from 67 % to 81 %, and the process cost from 13 % to 24 %. When using a 25 % internal rate of
51
return the total cost increase is 13 %. The result of the case study shows that long lead-times in combination with expensive raw materials does not necessarily result in high costs for tied-up capital in relation to manufacturing costs.
Figure 16: The cost distribution for each of the 10 orders, when using 13 % interest rate for internal rate of return (Windmark and Andersson, 2018).
4.2.6. Summary of Paper VI Cost-modelling as decision support when locating manufacturing facilities. The aim of the paper is to provide a quantitative decision support based on production system costs, to use when conducting a production location project. Previous studies (Windmark & Andersson 2012), (Andersson & Ståhl 2014) have shown that the industry would benefit from comprehensive cost analyses in their decision support for production location. Both academia and industry agree that relocation decisions are based on strategies to reach markets and suppliers and to reduce costs. The paper presents a cost estimation framework for location decisions, incorporating manufacturing costs and the cost for production support activities, such as, material handling, external logistics, quality assurance, ITsupport, marketing, and purchasing. The ingoing parameters for manufacturing costs are presented along with the interface of the excel tool used for estimation. For the other supporting activates a table with ingoing parameters is presented in Table 8. Cost related to in-house material handling (inbound logistics) is not dealt with further as it is presented in Paper IV. The paper ends with a cost simulation of three possible scenarios for production location: a current location in Sweden, an improved system in Sweden, and a production system in China. The scenario simulations only include the manufacturing part cost and not the costs connected to support functions, because the authors had little experience and scant data to use
52
in such a scenario simulation. If these costs were included, it might considerably change the outcome. When comparing only process costs between China and Sweden, the relocation to China appears to be preferable. Although, if the analysis includes the risks of overestimated performance and underestimated wage growth, it is not obviously the best location. Other important costs to take into consideration during production relocation, not included, are the costs of knowledge provision, process testing and ramp-up at a new site. These costs are often generated before production starts and can be treated as investment costs and thereby be included in the process costs. Finally, if the location project results in a relocation the cost impact at a current site needs to be investigated.
Annual production time Annual production in products Personnel costs Rental costs Computers Equipment costs Maintenance Licensing costs Travel costs Education costs Advertising Insurance costs Number of parts in delivery Delay costs Transportation costs (transport) Transportation costs (personnel) Duty/delivery Tied-up capital (shipping)/part Tied-up capital (storage)/part Planning personnel cost Rent cost planning personnel Additional costs Inbound logistics costs
Table 8: Parameters used to estimate the cost of supporting activities in the production system (Windmark & Andersson 2016).
IT support
x x x x x x x x
Marketing
x x x x x
x
x
x x x x
x
Purchasing
x x x x x
x x x
x
Management Quality control External logistics Inbound logistics
x x x x x
x x x
x
x x x x x x x x x x
x
x
x
x x x x x x x x x x x x x
x
53
4.2.7. Summary of Paper VII Assessing sustainability using a cost-model for development of a framework for sustainable production evaluation. The paper presents a proposed framework for sustainable production assessment. The paper comprises of two stages. Firstly, the parameters of the cost-model are compared with reported sustainability indicators for production found in the literature. Out of 108 indicators 70 could be connected to the parameters in the cost-model either implicitly or explicitly. It was possible to find connections between the sustainability indicators and the cost-model parameters in 75 % of the indicators in the economic dimension, 67 % and 52 % in the environmental and social dimension respectively. The analyses of the indicators from the selected papers show that there are 14 indicators that are represented in four or more publications, indicating that they are established to a higher degree than other indicators for sustainability and could be more important to cover in a sustainability framework. In total 38 of the indicators, which it was possible to categorize into 15 different categories, were not represented in the cost-model, see Table 6 in Paper VII. Secondly, based on the findings, a decision framework for evaluation of sustainable production was developed, see Figure 17. A literature study of composite index was performed for design inspirations for the framework. The framework is divided into two parts, an economic assessment and a sustainability assessment, aimed mainly at environmental and social sustainability connected to production. The framework targets a product or a product group, providing information regarding cost, price and surplus in the economic part. The sustainability assessment consists of nine categories: material and supply chain, people, process environmental impact, additives and tools, finance, logistics and transportation, waste management, process efficiency and agility, and end product. Suggested factors in each of the categories relate to the earlier findings incorporating all of the 14 important indicators, and 13 of the 15 categories not represented in the cost-model. Data reliability and tractability is also added for assessing the risk of having inadequate data.
54
Figure 17: Decision framework for sustainable production (Paper VII).
4.2.8. Summary of Paper VIII Sustainable production with a cost perspective – driving the industry to embrace sustainability thinking. The motivation for the study was twofold 1) To find correlation between perceived important cost drivers in Swedish manufacturing industry and sustainability and what impact they have on production cost. 2) To find what drivers for sustainability and obstacles for sustainability are perceived as eminent in Swedish manufacturing industry. Literature reviews about production cost drivers, and drivers and obstacles for sustainability implementations in industry were performed. A survey was conducted to form a base for the development of an economic method of assessing sustainability in a production system. The findings from the review, about cost drivers and drivers and obstacles for sustainability, were used in the survey design, providing respondents with multiple choice questions. From the survey it was possible to find that the most important cost drivers were believed to be: production efficiency, material cost, quality, adjustments, equipment costs, labour costs, shipping, and material handling. The main drivers for sustainability at the companies were believed to be laws and regulations, board decisions, cost savings, marketing, customer requirements and champions within the organization, whereas the main obstacles were believed to: economic aspects, no clear directives for goals, unnecessary and non-value adding work, not a central issue, and lack of time. The findings indicate that sustainability improvement could be facilitated in the Swedish industry if management raised the issue more. To make management
55
and boards review sustainability in their strategies and tactics, connection to cost would be beneficial since decisions are often profit driven. From the survey and literature review, three areas of inter-correlation between cost drivers and sustainability measures were found: facility occupancy, resource consumption and energy and resource efficiency. A case study of a machine cell using metal cutting in the heavy vehicle industry was used to demonstrate the possibility to connect the cost effects and environmental effects of altered performance. The study at the case company was designed based on the data available. Therefore, it was chosen to evaluate cycle time reduction, equipment efficiency (equipment idling), and process material efficiency, for which the manufacturing cost-model is intended. The cost-model was complemented with an additional equipment cost to capture three different running settings: idling, internal handling, and tool engaging. Based on the energy consumption, the carbon dioxide emissions could be connected to the time frame of the three different running settings. Material efficiency was also calculated using operational rejection rate (not including reworking) and part weight. In the scenario simulation, the carbon emissions are shown for the Swedish and average European energy mix per kWh. In Figure 18, the total manufacturing cost (left Y-axis) and carbon dioxide emission (right Y-axis) (average emission/kWh in Sweden and average in EU) are dependent on total time in availability losses (idling machine). The results indicate that: 1) It is possible to connect performance, cost and sustainability. 2) The choice of energy source is more important than energy efficiency when reducing carbon emissions. 3) In the current investigated manufacturing system, the carbon dioxide emissions saved from not having machines idling during the night or between production of products is eliminated if more than 1.5 products are permanently rejected.
56
Figure 18: Correlation between availability losses in idling equipment and cost (red) respectively CO2 emissions (black), for average emission per kWh in Sweden (lower) and EU (upper) (Paper VIII).
The cost-model was evaluated in Paper VII based on sustainability connection and was found to be able in some respects to cover 70 % of the investigated quantitative measures for sustainable production. In this paper, downtime, cycle time and quality rejection were used.
4.3.
Results contributing to RQ1
The research question is approached from three directions. Firstly, how the model can be altered and applied for specific decisions important for manufacturing tactics and strategies. Secondly, how the model can be developed in terms of additional information, taking more aspects of the production system into consideration. Thirdly, how cost for production support processes can be added to manufacturing cost in a decision framework for production location decision.
4.3.1. Application and modification of the cost-model The appended publications provide methods and model modifications for analyses facilitating decisions for manufacturing developments, such as a method for production analyses (PI), and support for decisions for equipment investment (PII),
57
level of automation (PIII), and support for decisions for energy and material choices and efficiency improvements (PVII). System analyses for gaining knowledge on improvement opportunities. Paper I presents a method for production analyses, which provides a way to distribute cost on reported disturbances. With reliable and rich input data, production analyses provide decision makers with information for increased knowledge about system behaviour and how system performance is affected by changes and actions. The knowledge and understanding gained from such analyses can be crucial for a successful decision on system configuration or new system design. Through cost distribution on factors for disturbances, it is also possible to find the cost level appropriate for specific production developments. For instance, the cost of improvements for cost reductions, should not exceed the savings of performing the improvement. The method also makes it possible to connect problems with specific root causes and thus make it possible to track how, for example, education and training improve specific areas of disturbances. Evaluate equipment and development scenarios. When designing or altering a current production system there is much to consider, such as, production cost, batch size, capacity, quality rate, process material scrap, working conditions for operators. Papers II and III provide adaptations of the costmodel giving the economic level of automation and assessing the cost performance ratio of an investment. The cost performance ratio can support decisions on equipment investments when the technology is known and when enough data is available on important manufacturing parameters such as quality, material process scrap, cycle times, setup times, and energy consumption. Increased automation levels are often advocated to increase competitiveness. Paper III proposes the integration of the automation factor xaf in the cost model for assessing the cost impact of changing the automation level. More automation often results in fewer people working in the production system, but could also make the production system more sensitive to disturbances. Therefore, analysing cost impact from different automation levels is an important part of decision support for production development. The automation factor xaf is the relationship between the equipment cost per hour and the salary cost plus the equipment cost per hour according to equation 6. =
58
+
∙
(6)
Each of the important performance parameters must be assessed in relation to the level of the automation factor xaf, as shown in Figure 19 and then inserted in the cost-model. In Figure 19, the parameters are adapted to a cubic equation. Parameters
Data and adjusted functions t0
30
t0max
[min] 25
t0
20
Nominal cycle time, t0
15 10
t0min
5 0
Tsu [min]
Setup time, Tsu
0.2
0.4
0.6
0.8
1
600
Tsumax
Tsu
400 200
Tsumin
0
0.2
0.4
qS 0.8 [-]
Downtime ratio, qS
xaf [-]
0.6
0.8
xaf
qSmax
[-]
qS
0.6 0.4
qSmin
0.2 0
0.2
0.4
0.6
0.8
xaf
[-]
1
Figure 19: Examples of how functions are adjusted based on data points for different parameters and xaf (Windmark et al. 2012).
Connect carbon dioxide emissions and performance measurements. Paper VIII provides a possible way to relate costs and carbon dioxide emissions to performance, using empirical data from a case study. The machine used during the metal cutting operation has three power states, idling, handling equipment, involving tool and work-piece transportation, and tool engaging. The paper presents a modification in the cost model to capture these three power levels. The ideal cycle time is divided between engaging time or handling time in the equipment (tool changes, movements of tools and materials). The modification can be seen in equation 7, showing two different equipment costs per hour, each of them having different time bases in the cost equation, according to the equations in the appendix in Paper VIII. =
+
(7)
59
Carbon dioxide emission is related to three performance parameters used in the cost-model, i.e. cycle time, availability and quality. As the same performance parameters can be used both when assessing the environmental impact as well as the cost impact, decision makers can use the information to make more sustainable decisions.
4.3.2. Expanding the scope of the cost-model The objectives of Paper IV and V are to further develop the manufacturing performance part cost-model to incorporate more aspects of the production system. In Paper IV, two versions of cost-models for material handling/inbound logistics were presented, giving the cost equation according to equation 8 (simplified) and equation 9 (detailed). Note that an error exists in the paper, concerning storage utilisation last in the equation, were “1+” is missing in the published paper. In Paper V, the approach for estimation of material handling cost developed in Paper IV was used, but the interpretation differed, because of the sourced services of the activity, resulting in equation 10. The contribution for each of the two papers to the model in terms of parameters is presented in Table 9.
k GIL =
/
k GIL =
pe,i
∙
pe i
(8)
∑ni=1 Ni ∙pe i
pp,i ∙t hpp,i +t OP,i +t t,i + k GCS +K pp
=
60
+
+
∙
k GDL + pp,i ∙t hpp,i + 60
1-URPP 1+ URPP
,
60∙24
∙ 1− 1+ 60 ∙ 24 ∙ 365
,
k GC +k e 60
k GDL K EIL + t kit,i ∙ + 60 Ntot
(9)
(10)
x
x
Cost of tied-up capital
x
x
Electricity cost connected to handling equipment
x x
Cost per movement
Cost of handling personnel
x
Order processing time
x x
Handling time
x
x
Storage time
x
x
Number of movements
x
x
Pallet equivalent
x
PV
Number of pallet places
Cost of storage equipment
PIV
Parameter /Paper
Area connected to storage
Utilization of storage
Area connected to handling
Table 9: Parameter contributions for Paper IV and V.
x x
x
In Paper V, the capital cost of material is added to the model, divided into capital cost of material in process and in storage. Equation 11 and 12 present the cost of tied-up capital of material in storage respectively in process. The paper further uses the possibility to aggregate cost through the whole production system involving 38 production steps. The cost of material handling and storage together with the cost of tied-up capital is added to the material cost before entering each manufacturing step. During the manufacturing process the cost of equipment/facility, personnel and the cost of tied-up capital are added to the material cost and after ending the process. Then the part/product is handled again before entering the next process in the value chain. During production, components of a part can be stored while others are manufactured and thus separately accumulate the cost of tied-up capital and the cost of storage space. =
∙ 365 ∙ 24 ∙ 60
=
∙ 365 ∙ 24 ∙ 60
+
(11)
+
+
+
+ 2
+
(12)
To handle the cost aggregation over time in production these two cost equations were inserted in the cost model according to equation 13.
61
=
1
+
+
+
+
∙
1− + ∙ 60
+ +
+ ∙ 1−
+
1−
(13)
+ ∙ 60 1 − ∙
1−
1− ∙
∙ 60
1−
1−
+
1−
∙
1−
+
+
+
4.3.3. Adding costs of support processes for production location Decisions for production system location need a holistic view incorporating many different aspects. The research conducted and partly presented in Paper VI focus on the production cost in connection with system design. In an interview study presented in Windmark & Andersson (2012) it was found that the five case companies used fewer cost factors in their location decision projects and that there is variation between companies on the factors that are used. The main reason for production relocation was reported in the study to be to increase cost benefits. The result indicates that the companies could benefit from a structured work method to assess costs in connection with a location project. The result from the ProLoc project was decision support designed as a stage-gate/water-flow model. The proposed decision framework consists of five project stages, as seen in Figure 20, and is presented in the production location handbook (Andersson et al. 2013). In four of the five stages cost assessment and analysis tools were developed, see Figure 20. Each of the developed tools provide cost per part/product, transforming direct costs and overhead costs into distinct cost drivers to facilitate accurate cost estimations. In Windmark & Andersson (2014) the business case in the second phase (Scoping) for project cost estimation and rougher production cost calculations was presented. The tool provides results based on two different production volumes, one based on market estimation and one based on equipment capacity. The developed tools are designed for support in different phases in the decision framework and are presented in Table 10.
62
Table 10: A short summary of the tool developed in connection with the decision support model. Number A
Tool Business case
Phase 2, 3,4
B
Checklist of location factors
3
C
Current manufacturing cost analysis Cost for supporting processes
3, 4
D
3 and 4
E
Cost impact of relocation
3
F
Scenario cost analyses of manufacturing
4
G
Installation and ramp-up cost analysis Costs for knowledge & skills provision Summary of business case
4
H
I
4
5
Description An estimation based on estimated annual market volume, total investment costs, production capacity and estimated year of production. A list summarizing and stating quantitative measures where the measures are evaluated based on their level and data reliability are good, acceptable, or not acceptable. Each measure also is provided an estimated value and a person responsible for providing the information. Six areas of measures are provided: human resources, facility and IT, legal and finance, sales and marketing, sourcing and purchasing, operations, and installation and ramp-up. A tool for estimations using the cost model, with the possibility to analyse 10 equipment units in sequence. The annual cost of IT-support, marketing, purchase, management, quality assurance, external logistics and additional cost are divided on annual production volume providing the part cost, which together with the cost of material handling according to Paper I gives the part cost for supporting processes. A two-part tool. The first estimating the cost of severance pay, machine disposal, local divestment, shipping cost, and services needed. The second used to estimating the cost of free capacity where also information on knowledge loss, lost customers and new customers can be evaluated. Same as tool C but provides a scenario simulation on three systems simultaneously and provides diagrams evaluating the system based on quality, tool costs, operation costs and personnel costs. The tool includes cost estimations for process testing at supplier, pilot production, ramp-up, and delay and buffer costs. A tool for cost estimation to providing knowledge at the new site. The tool includes an estimation of cost of providing knowledge from current site and to provide new knowledge at the new site. The tool is similar to tool 1, but provide estimation on three different systems and is based on the part cost estimated in tool C(F), D, E, G, H.
63
Figure 20: Decision support for production location projects based on Bellgran et al. (2013) and Andersson et al. (2013).
Papers IV and V present how to estimate current production regarding manufacturing processes and material handling costs in the third phase, Location analysis. The results can also be used to assess production costs in new production location alternatives (phase four, Generation of Alternatives). The material handling cost is part of the tools for support activities, also including cost analysis for quality assurance, IT support, management, purchasing, marketing, external logistics and other additional costs, which can be seen with the input parameters in Table 8. When moving a production system when the current production location facility is still in operation, the impact of the relocation must be assessed, or the total cost impact could be missed. A scenario analysis tool for cost risk assessment when estimating cost at a new location is also provided. Finally, a summarising 64
business case provides an estimation of the economic development of selected location alternatives, see Table 10.
4.4.
Results contributing to RQ2
In section 4.3.1, dealing with RQ1 the possibility to relate performance parameters both on cost and on sustainability aspects is raised. The results in Paper VIII indicate that interconnection between economic benefits and clear directives from higher levels in the companies drivers sustainability in manufacturing companies. As can be seen in Figure 21 the main factors facilitating future sustainable improvements reported from 18 respondents from Swedish manufacturing industries are: clearer directives from management, clearer expected profits, increased resources and clearer expected cost savings. The results indicate that there is a need for clearer directives and knowledge on what actions will lead to improved sustainability. These actions can be facilitated by finding the economic value of sustainable improvements, making it easier for management to make sustainable improvements a priority. In Paper VIII environmental aspects, such as carbon dioxide emissions are analysed, but the same principle of cost allocation can be used for other sustainability aspects. Although, for more implicit aspects such as training hours and personnel satisfaction, statistical distributions of a larger data-set might be needed to find correlations. The results from Paper VIII suggest that if enough information about the performance of the production system is provided, social and environmental sustainability could be monetarily connected, facilitating decisions for increased sustainability.
65
Figure 21: Survey result from Paper VIII, * are not from the survey templet but added by respondents.
To further facilitate decisions regarding sustainable production, Paper VII proposes a conceptual decision framework. The development of the framework is based on the gaps found when assessing and comparing sustainability indicators with the parameters in the cost-model. To get a holistic view, assessing both economic, social and environmental sustainability the cost-model is complemented with overhead costs, price and a spider-chart presenting the visualised level of sustainability. The framework takes an operational approach, involving multiple corporate functions such as production, purchase, product development, logistics and finance to support a joint holistic view of the products produced. The aim is to make decision-makers realise the importance of considered sustainability, not only the impact occurring in the operations of the company, but also have perspective of the supply chain, including the production of material, parts and consumables at subcontractors and logistic concepts, showing how their decisions can contribute towards increased sustainability. As the focus of the research is the production system, the production assessment is divided into four parts: process environmental impact, additives and tools, process efficiency and agility, and waste management. The conceptual framework for sustainability evaluation is shown in Figure 17. The factors proposed as part of the analysis are mainly based on the findings in Paper VII, giving the sustainability indicators that could be assumed as important and
66
indicators not represented at all in the cost-model. Some factors are added based on industrial experience and assessing risks with insufficient information Profit is an important aspect in sustainable production, which means both cost and price are of interest. In Ståhl et al. (2018) a pricing model based on the manufacturing cost model is presented, which can also be used in the decision framework presented in Paper VII. For subcontractors, one strategy when making an offer for new products can be to set a price that is a bit too low. The loss is recovered by constantly improving the performance in the operations. This strategy increases the probability of getting the order but is also dependent on production developments and involves risks. The pricing model is based on the cost model where three factors are used for adding costs for additional costs and total surplus. First a factor β1 is added to cover the cost of purchasing and material acquisition in the tool and material cost. The factor β2 is added to cover the cost for the indirect costs of production operations, such as administration and management. The factor β2 is added to both equipment, material, maintenance, material handling and peripherals. Both β1 and β2 can be differentiated and adopted with individual numbers to different product families and different equipment. The last factor, factor β3 gives the total level of profit for the part/product. With a statistical simulation using information from previous production, it is possible to simulate expected time to reach profit and thereby assess the risk of a specific price offered.
67
68
5. Discussion
This chapter discusses the research results, ending with reflections on research quality, limitations and future research.
5.1.
Industrial and academic contributions
The research presented, aims to support decision makers on production development in manufacturing industries, mainly within discrete part manufacturing. The thesis work includes methods using production performance to assess and analyse cost to prioritize activities that will increase cost effectiveness and hence decision support models for production development. The research includes decision support tools for the cost assessment for location decisions and evaluation methods for deciding on equipment investments. In addition, development of one industrial concept framework for sustainability evaluation has been presented. Research results provide a cost distribution between different production activities for different production configurations and an example of the impact the cost of tied-up capital has on the final production cost depending on the interest rate used. The results indicate that long lead-times and expensive materials do not have to result in the cost of tied-up capital being a large share of the total production cost. Depending on type of production and type of product, material handling costs have shown, for three selected manufacturing companies, to vary between 0.6 % and 21 % of the total production cost. The academic contribution was primarily the findings on how to develop models to take important economic aspects into consideration for different decisions, and the importance of considering performance when estimating production costs for system evaluation. The cost-model has been developed to assess the production system instead of only the manufacturing system, incorporating the cost of handling and storage of products, tied-up capital, and a method for handling a system involving a vast amount of different operations, in a process-based facility layout. In addition, the cost-model has been used to develop new parameters, the automation factor xaf and the cost performance ratio CPR, for specific applications
69
such as equipment and operation evaluations. The framework with economic tools for production location decisions complements existing production location literature, giving a quantitative and concrete cost aspect (Strøjer et al. 2017).
5.2.
Increasing knowledge for informed decisions
The aim of this thesis is to provide decision makers with structures for information gathering from the production system in order to make short-term and long-term sound tactical and strategic decisions. The focus is on how a cost-breakdown part cost-model incorporating performance can be used to assess vital aspects in the production system. The main contribution relates to decisions in production system design, development/configuration and site location, but also to how to use the selected cost-model for sustainable production evaluation, integrating cost awareness with sustainability consciousness. One of the major research activities has been to transfer cost drivers from the overhead cost to separate parameters in the cost model. As discussed in Jönsson (2012) the availability of necessary data is crucial in order to use the cost-model, and of special importance is the continual collation of loss parameters. There are several reasons to modify a production system: more effective throughput, introduction of new products, outdated equipment, major changes in production volume, product sourcing, relocation etc. Production development ought to be in line with company strategies and contribute to a sustainable production system. In connection with location decisions, investments in equipment are often a central aspect. Investment decisions also occur in existing facilities making it a central issue for decision makers in industry. This thesis presents research on investment evaluations of manufacturing equipment incorporating performance, capability, and costs. Usage of performance parameters makes it possible to compare different equipment investments based on their performance and capability, here introducing cost performance ratio and factor of automation level. From the results in Paper I, it is possible to conclude that the level of performance can be related to the batch size used. The batch size will have an effect on the system capacity as well as on the total number of set-up times. Therefore, the batch size is an important aspect when designing and planning a production facility at a new location. When assessing production, it is possible to divide costs between material, manufacturing operations (equipment, facility/site, labour, tools), support activities (labour, equipment, facility), overhead, and financial aspects. Depending on the type of product and production, the relationship between costs can vary, but it is not uncommon to have material costs contribute to 60-80 % of the total production
70
cost. In the first part of the 20th century, in many cases it was only necessary to include direct material, direct labour and overhead costs, because a lot of work was manual or the operators used simpler equipment. Production equipment has evolved a lot in recent decades, contributing in many cases to a substantial part of operational costs (equipment costs, expendable resources and labour costs). The hourly cost based on the annuity of investments in equipment in the performed empirical studies ranges from €20 - €200 per hour. Relocation decisions have been found to be driven by strategic decisions, such as entering new markets and the need to produce at lower costs. As production relocation often results in high initial costs, the importance of making the right decision is essential. Labour cost has been stated as one of the main cost drivers for Swedish companies that relocate production. Nonetheless, labour costs can be a smaller part of the total manufacturing cost when compared to material and equipment, which also are the two cost categories highly relevant to review before a relocation. Therefore, it is important to consider cost of equipment, cost of material and labour costs in an integrated cost-based support model for wellinformed decisions. The issue of different locations with varying salary levels and access to educated and skilled employees, which is reflected in Paper VI, can result in different system designs to obtain the optimal economic and strategic configuration. In conclusion, when comparing location alternatives, it is essential to consider different system designs, planning strategies, and automation levels. The results presented in this thesis can help companies to estimate a more accurate production cost, and thereby more easily find how a selected location or system design reduces or increases each of the different cost drivers. In the end, companies have to be able to make strategic decisions, not only optimising the economic output of production, as other aspects such as an important presence in the marketplace, increased sustainability, shorter lead times and outstanding quality can be of more interest. However, to minimize the effects of “forgetting” to include parameters that have an impact but not very well underpinned estimations, efforts for retrieving information and knowledge before making a decision are crucial. In the end, industrial decision makers should always try to be in possession of an understanding and knowledge of the impact caused by their decisions. Making decisions concerning the modification of production systems involves a considerable risk of things ending up other than expected, as both material, information systems, equipment, people etc. are involved, contributing to a complex base of dependent and independent issues. In the literature review in Chapter 2, several methods for reducing and evaluating risk are discussed. In the decision support for production development presented in this thesis, risk has either been approached through the use of statistical simulations of the manufacturing cost and cost-model parameters based on empirical data (Paper I) or economic scenario analyses or quantitative what-if analyses in Papers I, II, III, V, VI, and 71
VIII. In Spang et al. (2014) and Ståhl et al. (2018) statistical simulations are primarily used when defining the rate of performance losses based on a limited data-set or also, as in Paper I, providing a distribution of the likely production cost/surplus. Scenario simulations and what-if analyses are used in Papers II, V and VI to investigate worse/best case and to compare different systems based on configurations and constraints. Wallace (2000) argues that the statistical distribution of parameters instead of deterministic enteritis is to be preferred. Still, scenario simulations can be considered to be less precise, but they do not require the user to employ statistical distributions, which would require detailed information on the occurrence of the estimated parameters, and still provide an overview of the likely cost outcomes. Cost-based pricing is advocated to reduce the risk of setting the wrong price (Noble & Gruca 1999) but other scientific findings also suggest that the method often uses less well-founded information (Liozu & Hinterhuber 2012). This implies that cost-based pricing using performance could help to achieve the objective of reducing risks. Furthermore, the survival of nearly all companies is dependent on profit and economic benefits for shareholders and to be able to economically support employees. The level of profit in a company depends on the costs and prices of products/services. Using system performance in cost-based pricing not only visualises the changes in cost, but also how revenue changes with system improvements. Using the cost-model together with the developed model for material handling costs to estimate customer price would also make it possible to take into consideration the number of components, their handling and storage, order quantities, frequency and the possibility to co-produce orders and products. For example, in the case study presented in Paper IV it was found that parts seemingly very alike in configuration had different handling costs for components based on smaller annual volumes and batch sizes and needed longer storage times. The possibility to use more parameters and to connect performance in manufacturing operations with material handling activities and total production cost. This connection can make it possible to analyse how different actions and settings in each of the activities drive cost. For example, by investing more money in more flexible and effective material handling the efficiency in the manufacturing processes could increase and thus lower the total production cost. However, in this case, it could be important to consider the level of utilization of the manufacturing equipment. There is no point in increasing equipment efficiency if no other work can be performed in the freed-up production time. In Paper V compared to Paper IV, a considerably larger amount of process steps was included with expensive equipment and long lead times. In the study, the costs of material handling and storage are low in comparison to material, process, and the cost of tied-up capital and could not be considered as a primary target for cost savings. Compared with the case study presented in Paper IV, the share of material
72
handling costs is 0.6 % compared to 11-21 % of the total production cost. One reason could be the differences in number of components, as the other case studies involved products with a large number of components, handled in the production system. In Paper IV, the capital cost of material is not included. The differences in the share of total production cost indicate the importance of assessing material handling separately when evaluating costs, also take into consideration the product design, equipment and system configuration, process capability and performance. The ABC method has been reported as hard and costly to maintain and use (Kaplan & Anderson 2004), and is not widely implemented in manufacturing industries (Innes et al. 2000). Process-based costing is in many regards similar to ABC. Nonetheless, the advantage of using a time-based model is the possibility to have automatic data reporting. The usage of performance parameters also contributes to the possibility to relate actions and conditions to improvements and disturbances, where the used model could be more appropriate for production analyses than Time-driven ABC. The trend in manufacturing industries and research is in digitization and big data, which among other things aims to gather and use digital information from the production system for decisions based on large data sets and in some cases automatic decisions. Therefore, it could be argued, that processbased costing using information from performance measurements, although it could be hard to implement and access necessary data, can play an important role in the development of future digitized industries. When discussing sustainable production, cost is not enough to enable a grasp of the economic dimension. Therefore, pricing is also essential, as discussed in Paper VI where production cost together with overhead cost and pricing provide the profit in the conceptual sustainable production decision framework. The knowledge regarding production performance can also contribute to better assess the monetary impact of environmental and social aspects on the production system, making it possible to integrate sustainability thinking and production costs. Relating performance and sustainability aspects to cost can also make it possible to evaluate new production systems on sustainable production and to find out to what condition they can still provide beneficial economic output. Production development does not only consider machines and equipment, but also the humans working in the organization. We experience everything as individuals, and thus in many cases we make decisions based on our individual views. Facts can facilitate objectives and informed decisions supporting standardized solutions for frequently occurring problems. Another important aspect when making informed decisions is to possess adequate knowledge and understanding. One way to provide decision makers in production development with relevant insight is to have a learning organization. A learning organization has the benefits of knowledge transfer, providing the prerequisites to succeed in market competition. Interactive
73
use of a performance measurement system with frequent analyses of indicators is conducted to generate learning about actions leading to performance (Dossi & Patelli 2010). A learning organization is an integrated organization where information is not only shared vertically between the board and the manufacturing floor but on a horizontal level between groups within the same type of activities and cross-functional between the division of different activities (Fröberg et al. 2016). Company integration enables standardised work, enhanced problem solving in cross-functional teams, and avoidance of sub-optimization within the organization, see Figure 22.
Figure 22: Company integration in the organization, based on figure presented in (Fröberg et al. 2016).
The information and knowledge accumulated from the analyses can also support a learning organization to understand the con