Performance benchmark of a parallel and distributed network simulator Samson Lee, John Leaney, Tim O’Neill, Mark Hunter Institute for Information and Communication Technologies, University of Technology, Sydney PO Box 123, Broadway NSW 2007, Australia {samlee,jrleaney,toneill}@eng.uts.edu.au,
[email protected]
Abstract Simulation of large-scale networks requires enormous amounts of memory and processing time. One way of speeding up these simulations is to distribute the model over a number of connected workstations. However, this introduces inefficiencies caused by the need for synchronization and message passing between machines. In distributed network simulation, one of the factors affecting message passing overhead is the amount of cross-traffic between machines. We perform an independent benchmark of the Parallel/Distributed Network Simulator (PDNS) based on experimental results processed at the Australian Centre for Advanced Computing and Communications (AC3) supercomputing cluster. We measure the effect of cross-traffic on wall-clock time needed to complete a simulation for a set of basic network topologies by comparing the result with the wall-clock time needed on a single processor. Our results show that although efficiency is reduced with large amounts of crosstraffic, speedup can still be achieved with PDNS. With these results, we developed a performance model that can be used as a guideline for designing future simulations.
1. Introduction Simulation of telecommunications networks allows researchers to investigate and reason about the qualities of a new or proposed system without the high cost and risk of disruption associated with experimenting on the real system. By carefully analyzing the hypothetical system, problems can be avoided when the real system is built. In the UTS-Alcatel Management of Enriched Experience Networks (MEEN) project, simulation is seen as a critical component in the verification, validation and demonstration of the proposed network management system. However, the scale of the new-generation Enriched Experience Network
(EEN) [1] makes detailed packet-level simulation difficult because of the enormous amounts of memory and processing time needed. Given the need to speed up network simulations so that larger and more complex networks can be represented, Liu, et al. [2] described three categories of methodologies for speeding up network simulation: simulation technology; simulation model abstraction; and computational power. In the simulation technology category, more efficient algorithms for implementing the event-list manipulation such as the calendar queue [3] (used in ns-2) instead of the basic linked-list can speed up simulation. In the simulation model abstraction category, simplifying the model attempts to improves efficiency such as by representing traffic as fluid-flows [2, 4] instead of individual packets. The third approach to speeding up simulations is to use more resources such as faster machines or by distributing the model over a number of connected machines [5]. The focus of this paper is in the third category. In parallel distributed network simulation, multiple processors are used simultaneously for executing a single simulation. However, the absence of a global clock introduces the need for synchronization algorithms to ensure that cause-and-effect relationships are correctly produced by the simulator. Two methods to ensure correct temporal order of the asynchronous event execution are: conservative and optimistic methods. The conservative approach [6] strictly imposes the correct temporal order of events. The optimistic approach [7] uses a detection and recovery mechanism: whenever the incorrect temporal order of events is detected, a rollback mechanism or Time Warp is invoked to recover. In the conservative approach one instance of the simulator can only process an event when it has a guarantee no other event containing a smaller time-stamp may arrive at some later time. An inefficiency of this approach called message passing overhead is due to the delay incurred by serializing event data (sometimes
called marshalling), transferring the serialized event to the remote processor, and rebuilding the event from the serialized data (sometimes called un-marshalling) [8]. In general, simulations where much of the traffic crosses the boundary of a simulator instance is more susceptible to message passing overhead. In view of that, our objective is to measure the effect of crosstraffic on wall-clock execution time to complete a simulation. Our main contribution is an independent benchmark of the conservative Parallel/Distributed Network Simulator (PDNS) developed at Georgia Institute of Technology based on experimental results processed at the Australian Centre for Advanced Computing and Communications (AC3) cluster. We measure the effect of cross-traffic and interaction on wall-clock time needed to complete a two processor simulation for a set of basic network topologies by comparing the result with the wall-clock time needed on a single processor. This work is part of a UTS-Alcatel research group that seeks to understand and manage large-scale complex networks, where large scale means millions of entities and users. Firstly, we are investigating the efficacy of Policy-Based Network Management (PBNM) to reduce the complexity of the management task, augmented by advanced simulation to predict effects. Secondly, we are exploring the needs, wants and expectations of users to better understand and accommodate them, under the banner of Quality of Experience (QoE). Thirdly, we are modeling, developing and visualizing the evolving system using the approach of Architecture-based Engineering to ensure the realization of a system design which will achieve its functional and non-functional qualities. The remainder of this paper is organized in five sections. In Section 2, we provide an overview of the parallel and distributed simulator. In Section 3, we describe the design of the experiments conducted for this paper. In Section 4, we give details of the individual experiments. In Section 5, the results of the experiments are analyzed and discussed. Finally in Section 6, are our conclusions and future work. Additional related work is described in Section 7.
2. Parallel/Distributed Network Simulator The PADS research group at Georgia Tech [9] has developed extensions and enhancements to the popular ns-2 [10] simulator to allow a network simulation to be run in a parallel and distributed fashion, on a network of workstations. We chose PDNS instead of alternatives, such as GTNetS [11] and DaSSF [12] among others because of the familiarity, availability and wide-
spread use of ns-2 models. For the purposes of this work, we will not be examining the other parallel discrete event network simulators. PDNS uses a federated simulation approach where separate instantiations of ns-2 modeling different subnetworks execute on different processors. PDNS uses a conservative approach to synchronization. No federate in the parallel simulation will ever process an event that would later have to be undone due to receiving messages in the simulated past. PDNS uses a new scheduler called RTI instead of the default calendar scheduler in ns-2. The RTI scheduler uses the time management functions of the libSynk/RTIKIT libraries [13, 14] for synchronization.
3. Experimental design The experiments presented in this paper have been conducted as part of an experimental design life-cycle. Previously, pre-structural experiments have been performed, which has contributed to our evolution in understanding the problem. For a detailed discussion of the experimental design life-cycle, see our previous paper [1]. For all experiments, we have simplified the choice of network topology, traffic characteristics, and transport protocols. They represent abstractions of the access and core of any telecommunications network, and are not meant to be complete or accurate representations of a real EEN. These baseline experiments could serve as a reference when designing more realistic simulations. Although not as realistic, our topologies provide more control over the ratio of cross-traffic compared to the commonly used benchmark specification developed by the research group at Dartmouth College [15]. All simulation experiments were processed on resources at the Australian Centre for Advanced Computing and Communications (AC3) [16]. We used Barossa, which is a Linux Beowulf cluster with 155 dual 3GHz Pentium 4 nodes (152 compute nodes), each with 2GB RAM. It is located within the Australian Technology Park in Redfern, Sydney. There were a number of environmental factors that needed to be considered to control error in our experiments. Since the processor, disk and memory resources can be shared between users simultaneously, care was taken to minimize the effect due to this. Barossa uses the Portable Batch System (PBS), which is a batch scheduling system that allocates requested resources to jobs submitted in a queue. It is possible that PBS allocates one processor in a compute node where the other processor is in use by another
user. To ensure that exclusive use of that node could be obtained, it was necessary to request both processors of a compute node even though only one processor was used (i.e. the two processor experiments were conducted using one processor on each of two computers). The home directory of Barossa is shared among all nodes, meaning that there is a higher potential for disk access delays when the fileserver is busy. Although our experiments did not require extensive reading or writing, initial experiments had occasional standard output messages used for debugging and monitoring time/memory during a simulation. Even for such trivial operations, there were intermittent delays of up to 15 seconds. To ensure this did not affect our final results, these messages were turned off, and all files were written to the scratch space on the compute node’s local hard drive during a simulation and subsequently copied to the home directory. The focus of this work is the effect of cross-traffic on simulation wall-clock execution time, and not on simulation memory usage. However, we also monitored memory usage for all the experiments to ensure that there was sufficient physical memory available so that simulation wall-clock execution time would not be affected by virtual memory “disk thrashing”.
4. Details of experiments The experiments were conducting using PDNS version 2.27-v1a with libSynk dated 15 July 2004. For consistency, the same RTI scheduler was used for both one and two processor simulations, with message compression enabled. Scheduler look ahead was 10ms for two processor simulations, and 999999 for one processor simulations. Additionally, we disabled all unnecessary packet headers and used nix-vector routing to optimize memory usage and execution speed. We studied the effect of cross-traffic on wall-clock execution time for a set of basic network models. First is the dumbbell topology, and the second is an exten-
sion of the dumbbell topology. TCP traffic generators were used in both models and a number of parameters including wall-clock time to complete a simulation were observed and sampled. These are described in the following subsections.
4.1. Dumbbell topology The network model that we examined first is the familiar dumbbell topology that is frequently used in network research studies. Our dumbbell topology has C leaf nodes that are connected to routers N1,0 and N2,0 on both ends of a shared link. Each of the leaf nodes are connected to the corresponding router with 512 Kbps full-duplex links with an arbitrary 5 ms delay. The shared link has an over-provisioned full-duplex bandwidth of C × 512 Kbps to minimise the effect of congestion on wall-clock execution time, and has an arbitrary delay of 10 ms. There is a total of 2C + 2 nodes in this network model. For the purposes of these experiments, one end of the dumbbell is labelled Group 1, and the other end is labelled Group 2, as depicted in Figure 1. Each group can be distributed onto two separate processors, or they can be combined and simulated on one processor. Each leaf node is a source of traffic, and there are C sources in each group. Since the objective of this work is to study the effect of cross-traffic on wall-clock execution time, we define two types of traffic connections. Remote connections are source-destination pairs where the source N1,r or N2,r is in one group and the corresponding destination N2,r or N1,r is in the other group. There are R remote connections in each group. Local connections are source-destination pairs where the source N1,l or N2,l and destination N1,l+1 or N2,l+1 are neighbours in the same group. The last local source N1,C or N2,C in each group connects to the first local source N1,R+1 or N2,R+1 also in the same group. There are L local connections in each group. The number of traffic sources in each group is C=R+L. The total number of traffic sources in this network model is 2C. To illustrate the above, let C=500, R=100, L=400. Remote connections: N1,r sends traffic to N2,r and N2,r also sends traffic to N1,r where r=[1, 2, …, 100]. Local connections: NG,l sends traffic to NG,(l+1) where l=[101, 102, …, 499] and G=[1, 2]. NG,500 sends traffic to NG,101 where G=[1, 2].
Figure 1. Dumbbell topology.
With this model, we could vary the amount of crosstraffic in a two processor simulation by keeping C constant and using different values of R. For constant C in
two processor simulation, there is minimum crosstraffic when R/C=0, and there is maximum crosstraffic when R/C=1. Accordingly, for a two processor simulation there will be more message passing overhead due to cross-traffic when R/C=1 than when R/C=0. Part of the wall-clock execution time depends on the number of events that need to be processed by the simulator. Events include packet-level operations such as entering and exiting a queue at each packet hop. In the dumbbell topology above, each remote connection requires packets to be sent to a destination that is three hops away. In comparison, each local connection requires packets to be sent to a destination that is only two hops away.
4.2. Extended dumbbell topology The dumbbell topology previously described does not provide symmetry in terms of number of packet hops as R/C is varied. The network model that we examined next is an extension of the dumbbell topology that attempts to provide symmetry and therefore a more constant wall-clock execution time. This topology also contains C leaf nodes connected to routers N1,0 and N2,0 on both sides of a shared link, with one side labelled Group 1 and the other side labelled Group 2. In addition, a second router L1,0 and L2,0 is connected to the original router in both groups, and there are C leaf nodes connected to these second routers. The link characteristics are the same as before. There is now a total of 4C + 4 nodes in this network model. Each group can be distributed onto two separate processors, or they can be combined and simulated on one processor. The model is depicted in Figure 2. Each leaf node connected to N1,0 and N2,0 is a source of traffic, and there are C sources in each group. Remote connections are source-destination pairs where the source N1,r or N2,r is in one group and the corre-
Figure 2. Extended dumbbell topology.
sponding destination N2,r or N1,r is in the other group. There are R remote connections in each group. Local connections are source-destination pairs where the source N1,l or N2,l and corresponding destination L1,l or L2,l is in the same group. There are L local connections in each group. The number of traffic sources in each group is still C=R+L. The total number of traffic sources in this network model is still 2C. To illustrate the above, let C=500, R=276, L=224. Remote connections: N1,r sends traffic to N2,r and N2,r also sends traffic to N1,r where r=[1, 2, …, 276]. Local connections: NG,l sends traffic to LG,l where l=[277, 278, …, 500] and G=[1, 2]. As with the dumbbell model, we could vary the amount of cross-traffic in a two processor simulation by keeping C constant and using different values of R. Wall-clock execution time can be measured in one and two processor simulations with different amounts of cross-traffic. The key difference with this extended dumbbell model is that both remote and local connections require packets to be sent to a destination that is three hops away. It must be noted that a different number of L nodes participate in a connection when R/C is varied. Hence the number of nodes for which state is accessed during the course of a simulation is different. Although not evident in the results presented in Section 5, there is a possibility for cache performance to be affected due to the different amount of state that is accessed during the course of the simulation.
4.3. Traffic The traffic was kept homogeneous for simplicity and to make the results more predictable. We used Tahoe TCP transport agents with default parameters and simulated FTP applications for bulk data transfer. Each of the FTP applications were configured to start sending at a random time uniformly distributed throughout the duration of the simulated time, t. They were configured to continue sending for a random duration exponentially distributed with a mean of t/4, after which the application stops sending. This is representative of a number of data bursts within the simulated time, and distributes the TCP slow-start behaviour throughout the simulated time. It was expected that this type of traffic is sensitive to cross-traffic in a two processor simulation because of
the interaction that is necessary between sender and receiver. For this type of traffic, the sender is only able to process the current window of packets before having to wait for an acknowledgement sent from the receiver.
4.4. Sampling of data Since the dumbbell and extended dumbbell models are divided into groups, each group can be simulated as a federate on two processors. Alternatively, the groups can be combined into a one processor simulation. The wall-clock execution times for one processor and two processor simulations can be measured and compared. The expectation is that in general, two processor simulations with minimal cross-traffic will outperform the one processor equivalent. Also, the expectation is that two processor simulations with maximum cross-traffic will not outperform the one processor equivalent due to message passing overhead. If these expectations are correct then the objective of the experiment is to find the value of R/C where one processor simulation wall-clock execution time is less than two processor simulation wall-clock execution time. We performed simulations of the network model described above with C=500 for [20, 30, 40, 50, 60] minutes of simulated time, t. We took samples of each value of R from 0 to C in single increments. For each simulation, we recorded wall-clock time, described next. The total wall-clock execution time to complete a simulation is Ttotal = Tinit + Trun. Initialisation Tinit begins when the script is first loaded and includes creating the simulated node and link objects in memory. The main factor determining Tinit is the number of nodes and links in the simulated topology. Tinit finishes and Trun begins when the event scheduler begins processing packet-level events, and finishes when the scheduler is halted. The main factor determining Trun is the simulated time, t and the number of packet hops as a result of traffic being sent through the network from source to destination. Additionally, for two processor simulations, Trun is also dependent on the amount of crosstraffic between simulator instances. We did not record packet-level events to a trace file, so disk access was not a major factor affecting Ttotal. Available physical memory should also affect Ttotal, but was not considered in our experiments because our values of C were chosen such that there was sufficient available physical memory to avoid “disk
thrashing”. These values were determined through exploratory experiments.
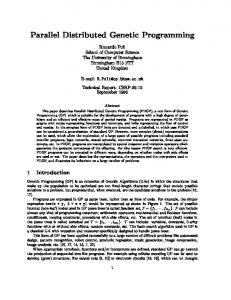
5. Results analysis and comments To illustrate our analysis of results for dumbbell and extended dumbbell topologies, the charts in Figure 3 and Figure 4 show the total wall-clock execution time required for simulating 60 minutes (t = 3600) as R/C is varied from 0 to 1. Note the points where one processor (1p) and two processor (2p) wall-clock execution times intersect. For brevity, charts for the other values of simulated time t are not included, but are summarized in the performance models shown in Table 1 and Table 2. The results of Tinit were approximately constant for all values of t and R/C, so we used the averages of those results in our performance models. The results of Trun for each value of t were dependent on R/C, especially for two processor simulations due to message passing overhead. The trendlines of Trun were approximately linear for each value of t, so we fitted it to the simple equation Trun = m × (R/C) + b. The gradient, m and y-intercept, b are functions of t, and we observed that they are actually proportional to t. Therefore, m/t and b/t were calculated for each value of t and the averages used in our performance models. These performance models of Ttotal for one and two processor simulations with C=500 are shown beneath the corresponding sections of Table 1 and Table 2. They were verified by plotting theoretical values with actual data. For small values of t, most of the computations only involve initialization and calculating the routes for connections since the number of packet-level events is also small. Because of this, there were cases where two processor simulations always completed faster than the one processor simulation, regardless of R/C. There were also cases where one processor simulation is more efficient than the two processor simulation, depending on the value of R/C. We used our performance model to solve for t when R/C=1 (i.e. when the two processor simulation is least efficient) to find the value of t such that two processor simulation would be more efficient than one processor simulation regardless of R/C. For the dumbbell topology, this value of t was 48 seconds. For the extended dumbbell topology, this value of t was 81 seconds. If the simulated times are less than these values, then there is a clear performance gain in using PDNS with two processors instead of one processor. For simulated times that are greater than the above
Table 1. Dumbbell topology results t
1 processor simulation, C =500 T run (m ) T run (m /t ) T run (b )
T sim_init
1200 1800 2400 3000 3600 Avg:
15.80 15.76 15.71 15.79 15.91 15.80 1p T total
139.52 208.74 278.36 350.00 426.22
0.12 0.12 0.12 0.12 0.12 0.12
T run (b /t )
t
0.45 0.45 0.45 0.45 0.45 0.45
1200 1800 2400 3000 3600 Avg:
540.75 807.81 1075.87 1345.27 1616.78
T sim_init
= 15.8 + t × [0.12 × (R/C) + 0.45]
8.42 8.28 8.36 8.43 8.48 8.39 2p T total
2 processor simulation, C =500 T run (m ) T run (m /t ) T run (b ) 539.61 828.77 1099.16 1338.58 1779.38
T run (b /t )
291.97 437.13 585.37 728.46 823.38
0.45 0.46 0.46 0.45 0.49 0.46
0.24 0.24 0.24 0.24 0.32 0.26
= 8.39 + t × [0.46 × (R/C) + 0.26]
Table 2. Extended dumbbell topology results T init
Total Wallclock Time [s]
1200 1800 2400 3000 3600 Avg:
22.39 24.40 24.45 22.33 24.50 23.92 1p T total
-45.93 -74.15 -93.49 -111.20 -126.98
-0.04 -0.04 -0.04 -0.04 -0.04 -0.04
T run (b /t )
t
0.58 0.61 0.61 0.58 0.61 0.60
1200 1800 2400 3000 3600 Avg:
699.39 1105.19 1473.78 1732.15 2192.66
T init
= 23.92 + t × [-0.04 × (R/C) + 0.6]
11.80 11.80 11.90 11.81 11.90 11.84 2p T total
3000
3000
2500
2500
2000 1500
1p T_total
1000
2p T_total
500 1p=2p T_total 0
Total Wallclock Time [s]
t
1 procesor simulation, C =500 T run (m ) T run (m /t ) T run (b )
2 processor simulation, C =500 T run (m ) T run (m /t ) T run (b ) 500.23 701.89 913.32 1145.98 1369.66
0.42 0.39 0.38 0.38 0.38 0.39
T run (b /t )
379.10 584.56 775.16 972.25 1179.47
0.32 0.32 0.32 0.32 0.32 0.32
= 11.84 + t × [0.39 × (R/C) + 0.32]
2000 1500
1p T_total
1000
2p T_total
500 1p=2p T_total 0
0%
20%
40%
60%
80%
100%
R /C
Figure 3. Results for dumbbell topology, C=500, t=3600 values, we can find the maximum value of R/C before one processor simulation becomes more efficient than two processor simulation due to message passing overhead. We used our performance model and found that: R/C = 21.46/t + 0.55 for the dumbbell topology, and R/C = 28.21/t + 0.65 for the extended dumbbell topology. From the above equations, we can estimate the maximum value of R/C before the effect of crosstraffic outweighs the performance gains of two processors. For very large simulated times (as t→∞), R/C=0.55 for the dumbbell topology. The value is R/C=0.65 for the extended dumbbell topology. This
0%
20%
40%
60%
80%
100%
R /C
Figure 4. Results for extended dumbbell topology, C=500, t=3600 means that for any R/C less than these values, two processor simulations will be more efficient than the one processor simulation. We can use this value as a general rule to keep remote connections versus total connections to be less than 0.55 for dumbbell topology and 0.65 for extended dumbbell topology.
5.1. Comments on dumbbell topology As described in section 4.1, our dumbbell topology is not symmetrical, and there are three hops from source to destination for remote connections, and only two hops for local connections. Accordingly, for a one processor simulation, there will be slightly more packet-level events that need to be processed by the
simulator when R/C=1. If there is sufficient bandwidth on the shared link, the expected wall-clock execution time should therefore increase slightly as R/C is varied from 0 to 1. For two processor simulation, it was expected that the effect of cross-traffic would result in a more significant increase in wall-clock execution time as R/C is varied from 0 to 1. Our results showed that this was true. The gradient m was positive for both one and two processor simulations, with the latter being more significant.
5.2. Comments on extended dumbbell topology As described in section 4.2, our extended dumbbell topology is more symmetrical and there are two hops from source to destination for both remote and local destinations. Accordingly, for a one processor simulation, there will be similar numbers of packet-level events that need to be processed by the simulator for all values of R/C. This model is more symmetrical in terms of packet hops as R/C varies. If there is sufficient bandwidth on the shared links, the expected wallclock execution time should therefore remain more constant as R/C is varied. However, since remote connections only are bi-directional, the link bandwidth will be shared with returning TCP acknowledgements. Accordingly, it was expected that there will be a slight decrease in wall-clock execution time as R/C is varied from 0 to 1. For two processor simulation, it was expected that the effect of cross traffic would result in a more significant increase in wall-clock execution time as R/C is varied from 0 to 1. Our results showed that this was true. The gradient m was negative for one processor simulations, and was positive for two processor simulations. The latter was more significant.
6. Summary and future work We studied the effect of cross-traffic on wall-clock execution time in the Parallel/Distributed Network Simulator (PDNS) for a set of basic network topologies by benchmarking the results from simulations on one and two processors. We defined our first topology based on a dumbbell network to include variables for remote and local connections. By controlling these variables, we were able to control the amount of crosstraffic in our experiments. We defined our second topology as an extension of the first such that there is the same amount of packet hops to destinations for both remote and local connections. For both topologies, we
defined the variables that were sampled, including components of total wall-clock time execution time. The experimental results were processed on a Beowulf cluster at the Australian Centre for Advanced Computing and Communications (AC3). We reduced error due to the shared computing environment by ensuring exclusive use of a compute node’s processors, as well as by writing to local scratch space instead of to the shared filesystem. Our experience gained from using these resources will be useful for future simulation studies. Our results showed that for C=500, when simulated time is less than 48 seconds for our dumbbell topology, or less than 81 seconds for our extended dumbbell topology, two processor PDNS simulations outperforms one processor simulations regardless of our defined unit of cross-traffic, R/C. When simulated time is more than these values, two processor PDNS simulations will be more efficient than one processor simulation if R/C < 21.46/t + 0.55 for our dumbbell topology, and if R/C < 28.21/t + 0.65 for our extended dumbbell topology. Finally, these results can help us estimate the maximum value of R/C before the effect of crosstraffic outweighs the performance gains of using two processors in parallel. The current results do not fully exploit the potential of the 155 node Beowulf cluster at AC3. Future work includes extending the experiments with more complex network models using more than two processors. We did not include results for shared memory communications, which is also future work. The details of the results and analysis are only applicable to the testing environment and models used and not to other scenarios. As such, the results must be interpreted in light of this. The models and methodology of varying the ratio of remote and local connections versus total connections that have been described in this paper need to be extended to other models. Further generalization of the performance models will be useful to help understand the relative advantages of using PDNS for our network simulations. Additionally, other methods for speeding up simulations, such as the other two categories described in the introduction of this paper can be examined in the future. We are particularly interested in the fluid-flow models.
7. Related work The creators of PDNS and libSynk at the Georgia Institute of Technology have published several papers that include benchmarks of PDNS, including the following.
In [17], Perumalla et al show that RTI-based parallel simulations can scale extremely well and achieve very high speedup. Their experiments yielded more than 80-fold scaled speedup in simulating large TCP/IP networks, demonstrating performance of up to 6 million simulated packet transmissions per second on a Linux cluster. Networks containing up to two million network nodes were simulated. In [18], Fujimoto et al presents results from experiments utilizing as many as 1536 processors yielding performance as high as 106 Million packet transmissions per second. In [19], Riley et al present experimental results achieving nearly 2 million network nodes with linear efficiency up to 128 federates. This paper differs from the abovementioned related works in that this is an independent benchmark that focuses on the overhead effects of simulated traffic crossing simulator boundaries. Although it is well known that increasing the ratio of remote traffic will degrade parallel distributed simulation performance, it is less well known the quantitative conditions where parallel distributed simulations become slower than an equivalent simulation performed on a single processor. As an independent research group, our experiences gained with PDNS have been very positive, and our results demonstrate certain conditions that need to be considered when designing future experiments.
8. Acknowledgement Thanks to AC3 for their support in using the cluster. Thanks to the PDNS group for the simulator software and support through the PDNS mailing list. We acknowledge the funding by UTS, Alcatel and the ARC via grant LP 0219784, which includes an APA(I) for Samson Lee.
8. References [1] S. Lee, N. Sheridan-Smith, T. O'Neill, J. Leaney, K. Sandrasegaran, and S. Markovits, "Managing the Enriched Experience Network -- Learning-Outcome Approach to the Experimental Design Life-Cycle," presented at Australian Telecommunication Networks and Applications Conference (ATNAC'03), Melbourne, Australia, 2003. [2] B. Liu, D. R. Figueiredo, Y. Guo, J. Kurose, and D. Towsley, "A Study of Networks Simulation Efficiency: Fluid Simulation vs. Packet-level Simulation," presented at IEEE INFOCOM'2001, Anchorage, Alaska, 2001.
[3] R. Brown, "Calendar queues: A fast O(1) priority queue implementation for the simulation event set problem," Communications of the ACM, vol. 31, pp. 1220-1227, 1988. [4] G. F. Riley, T. M. Jaafar, and R. M. Fujimoto, "Integrated Fluid and Packet Network Simulations," presented at MASCOTS'02, Fort Worth, Texas, 2002. [5] R. M. Fujimoto, Parallel and Distributed Simulation Systems: Wiley Interscience, 2000. [6] K. M. Chandy and J. Misra, "Distributed Simulation: A Case Study in Design and Verification of Distributed Programs," IEEE Transactions on Software Engineering, vol. 5, pp. 440-452, 1979. [7] D. R. Jefferson, "Virtual time," ACM Transactions on Programming Languages and Systems, vol. 7, pp. 404-425, 1985. [8] S. Bhatt, R. Fujimoto, A. Ogielski, and K. Perumalla, "Parallel Simulation Techniques for Large Scale Networks," IEEE Communications Magazine, vol. 36, pp. 42-47, 2002. [9] "PDNS - Parallel/Distributed NS." http://www.cc.gatech.edu/computing/compass/pdns/, 2004. [10] "The Network Simulator - ns-2." http://www.isi.edu/nsnam/ns/, 2004. [11] "GTNetS - Georgia Tech Network Simulator." http://www.ece.gatech.edu/research/labs/MANIACS/GTNet S/, 2004. [12] "Dartmouth Scalable Simulation Framework (DaSSF)." http://www.cs.dartmouth.edu/research/DaSSF/, 2004. [13] Georgia Tech, "Federated Simulations Development Kit." http://www.cc.gatech.edu/computing/pads/fdk.html, 2001. [14] K. Perumalla, "libSynk library." http://www.cc.gatech.edu/computing/pads/kalyan/libsynk.ht m, 2004. [15] J. H. Cowie, D. M. Nicol, and A. T. Ogielski, "Modeling the Global Internet," Computing in Science and Engineering, 1999. [16] "Australian Centre for Advanced Computing and Communications." http://www.ac3.edu.au/edu/, 2004. [17] K. S. Perumalla, A. Park, R. M. Fujimoto, and G. F. Riley, "Scalable RTI-Based Parallel Simulation of Networks," presented at Parallel and Distributed Simulation, San Diego, CA, USA, 2003. [18] R. M. Fujimoto, K. Perumalla, A. Park, H. Wu, and M. H. Ammar, "Large-Scale Network Simulation: How Big? How Fast?," presented at Meeting of the IEEE International Symposium on Modeling, Analysis, and Simulation of Computer and Telecommunication Systems (MASCOTS), 2003. [19] G. F. Riley, M. H. Ammar, R. M. Fujimoto, A. Park, K. Perumalla, and D. Xu, "A Federated Approach to Distributed Network Simulation," ACM Transactions on Modeling and Computer Simulation, vol. 14, pp. 116-148, 2004.