through 2003 Armstrong World Industries Inc. undertook an extensive series of earthquake qualification tests on SCS at the University at Buffalo (Badillo, 2003).
PERFORMANCE CHARACTERIZATION OF SUSPENDED CEILING SYSTEMS H. Badillo Almaraz, A. S Whittaker and A. M. Reinhorn Department of Civil, Structural, and Environmental Engineering State University of New York at Buffalo Buffalo, NY, USA Abstract The failure of suspended ceiling systems (SCS) has been one of the most widely reported types of nonstructural damage in past earthquakes. Fragility methods are used to characterize the vulnerability of SCS. Since SCS are not amenable to traditional structural analysis, full-scale experimental testing on an earthquake simulator was performed to obtain fragility data. Several ceiling-system configurations were studied. The results from the full-scale testing are presented as seismic fragility curves. Four limit states of response that cover most of the performance levels described in the codes and guidelines for the seismic performance of nonstructural components were defined using physical definitions of damage. Data was obtained for every limit state to compare the effect of each configuration on the response of the SCS. Based on the results of the experimental testing it was found that (a) the use of retainer clips generally improved the performance of SCS in terms of loss of tiles, (b) including recycled cross-tees in the assemblage of the suspended grid substantially increased the vulnerability of the SCS, (c) undersized (poorly fitting) tiles are substantially more vulnerable than properly fitted (snug) tiles, and (d) including compression posts improves the seismic performance of a SCS. Introduction The response of nonstructural components can significantly affect the functionality of a building after an earthquake, even when the structural components are undamaged. Poor performance of nonstructural components in past earthquakes has led to the evacuation of buildings, to substantial economic losses due to business interruption and in extreme cases to the loss of life. Reconnaissance following past earthquakes has shown that failures of ceiling systems during earthquakes have caused significant economic losses and disruption in important or critical facilities. Earthquake-history testing has been used recently for qualification and fragility testing of structural and nonstructural components. Seismic qualification is intended to demonstrate through experimentation that a component in a structure is able to function during and after an earthquake. In contrast to qualification testing, the objective of fragility testing is to establish a relationship between limit states of response and a representative excitation parameter for a component. The development of fragility curves generally involves the use of both mathematical modeling and physical observations. In the case of SCS, mathematical analysis is difficult to accomplish due to uncertainties in the physical behavior of elements and components of the system once that they are installed in the ceiling system. Further, the complexity of the mathematical model and the highly nonlinear behavior of the components once tiles are dislodged make robust structural analysis of SCS unrealistic. Since analytical methods are generally not applicable to the study of SCS and data collected following past earthquakes are not suitable for fragility characterization, experimental methods represent the best and most reliable technique to obtain fragility curves for SCS. The main goal of the study reported in this paper and by Badillo (2003) and Badillo et al. (2003) was to develop fragility curves of SCS subjected to earthquake shaking. Fragility curves were obtained by experimental testing of SCS on an earthquake simulator. The specific objectives of the research program were: (1) to study the performance of a SCS that is commonly installed in the United States; (2) to evaluate improvements in response offered by the use of retainer clips that secure the ceiling panels (tiles)
to a suspension system; (3) to investigate the effectiveness of including a vertical strut (or compression post) as seismic reinforcement in ceiling systems; and (4) to evaluate the effect of different boundary conditions on the response of a SCS. Seismic Fragility and Previous Studies on Suspended Ceiling Systems Seismic fragility has been defined as the conditional probability of failure of a system for a given intensity of a ground motion. In performance based seismic design, failure is said to have occurred when the structure fails to satisfy the requirements of a prescribed performance level. If the intensity of the ground motion is expressed as a single variable (e.g., the peak ground acceleration or the mapped maximum earthquake spectral acceleration at short periods, etc.), the conditional probability of failure expressed as a function of the ground motion intensity is called a seismic fragility curve (Reinhorn et al., 2002; Sasani and Der Kiureghian, 2001). Fragility curves can be generated empirically or analytically. Empirical fragility curves can be developed with the use of data from damage recorded in previous earthquakes or with the use of experimental data obtained from laboratory tests (i.e., scale model testing). Analytical fragility curves can be developed with the use of statistical data obtained with the use of accurate mathematical models that represent certain physical phenomenon. In statistical terms, a fragility curve describes the probability of reaching or exceeding a damage state at a specified ground motion level. Thus a fragility curve for a particular damage state is obtained by computing the conditional probabilities of reaching or exceeding that damage state at various levels of ground motion. Fragility curves can be used to present vulnerability data for both structural and nonstructural components systems on buildings. Fragility curves can also be used to compare different seismic rehabilitation techniques and to optimize the seismic design of structures (Shinozuka et al., 2000a). Although several studies have indicated that some improvement in the seismic capacity of SCS has been achieved in recent years (Rihal and Grannneman, 1984; ANCO, 1993; and Yao, 2000), there exists no robust fragility data for SCS and no proven strategies to increase the seismic strength of SCS. From 2001 through 2003 Armstrong World Industries Inc. undertook an extensive series of earthquake qualification tests on SCS at the University at Buffalo (Badillo, 2003). Among the most important findings of the qualification tests were that more failures occurred for the performance limit state of loss of tiles than for the performance limit state of failure of the suspension system and the addition of retention clips was a feasible and cost-effective strategy to improve the performance of ceiling systems, even for very intense earthquake shaking. Experimental Facilities for Seismic Testing and Test Specimens Earthquake Simulator. The earthquake simulator in the Structural Engineering and Earthquake Simulation Laboratory (SEESL) of the State University of New York at Buffalo was used to evaluate and qualify the ceiling systems. The performance envelope of the table is ± 152 mm (6 in.) displacement, ± 762 mm/sec (30 in./sec) velocity and 1.15g acceleration at a payload of 197 kN (44 kips) in the horizontal direction, and ± 76 mm (3 in.) displacement, ± 508 mm/sec (20 in./sec) velocity, and 2.30g acceleration in the vertical direction. For a payload of 489 kN (110 kips), the maximum platform accelerations are 0.55g and 1.1g in the horizontal and vertical directions, respectively. Input or command signals to the table can be of the following types: harmonic motions (sinusoidal, square, triangular), random motions, and most recorded earthquake histories. Test Frame. A 4.88 x 4.88 m (16 x 16 ft) square frame of ASTM Grade 50 steel was constructed to test the ceiling systems. See Badillo (2003) for details. The frame was attached to the simulator platform using 25 mm (1 in.) diameter bolts in the beams that were oriented in the East-West direction. Two 10.2 x
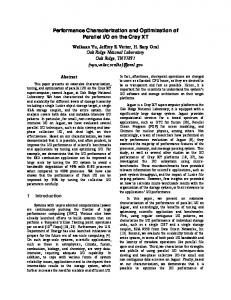
10.2 cm (4 x 4 in.) tubular sections connected at each corner served as main columns of the frame. A 3.8 x 3.8 cm (1-1/2 x 1-1/2 in.) angle was welded around the perimeter of the test frame. A 5.1 x 15.2 cm (2 x 6 in.) timber ledger was attached to the angle. The perimeter timber ledger served as a stud wall and anchored the ceiling system. For a detailed description of the features of the test frame refer to (Badillo, 2003). Figure 1 is a photograph of the test frame mounted on the earthquake simulator at the University at Buffalo.
Figure 1. Test frame mounted on the simulator at the University at Buffalo Specimen Description. Each ceiling system consisted of two key components: a suspension system and tiles. In some configurations retention clips were added to the ceiling systems. All components used in the development of this study (grid components, tiles and retention clips) were manufactured and provided by Armstrong World Industries Inc. Accelerometers and displacement transducers were used to monitor the response of the simulator platform, the test frame and the ceiling support grid. Suspension Grid. The ceiling systems were installed in a grid that was hung with suspension wires from the top of the test frame. The grid was constructed with the Armstrong PRELUDE XL 23.8 mm (15/16 in.) exposed tee system. A 5.1-cm (2-in.) wall molding was attached to the perimeter timber ledger. The main runners and cross runners were attached to the wall molding with rivets on the South and West sides of the frame, while the runners on the North and East sides floated free. The main runners were installed in the North-South direction at spacing of 1.22 m (48 in.) on center. The 1.22 m (4 ft) cross runners were installed in the East-West direction at spacing of 61 cm (24 in.) on center, whereas the 61cm (2 ft) cross runners were installed in the North-South directions at a spacing of 1.22 m (48 in.) on center. A compression post was placed 1.52 m (5 ft) from the South and the East sides of the frame. Tiles. Since the actual sizes of tiles may differ from the nominal size depending on quality control used in the manufacturing process, two types of tiles were used for fragility testing in this study. Based on personal communications with practicing engineers and manufacturers, ceiling tiles were considered to be of normal size if their plan dimensions are not smaller than the nominal dimensions by more than 6.4 mm (1/4 in.) and undersized otherwise. One of the tiles tested was the Armstrong Fine Fissured Humigard Plus tile. This tile was smaller than the nominal size by at least 12.7 mm (1/2 in.) and was therefore considered to be an undersized tile. The other tile used in this study was the Armstrong Dune Humigard Plus tile. This tile was a normal sized tile. Figure 2a is a photograph of the Dune Humigard Plus tile. Table 1 presents summary information on each of the two tiles used in this study. A total of 49 tiles were installed in the inner seven rows (seven tiles in each row). Cut tiles were used in the perimeter rows of the ceiling system.
TABLE 1. Summary information on the tiles used in this study Panel dimensions[B, D, T] * Nominal Size (cm)
Actual Size (cm)
Weight (kg/tile)
Fine Fissured HumiGuard Plus mineral fiber tile
61 x 61 x 1.6
59.7 x 59.7 x 1.6
1.3
Dune
61 x 61 x 1.6
60.3 x 60.3 x 1.6
1.7
Tile Name
Description
HumiGuard Plus mineral fiber tile
* B, D and T: breadth, depth and thickness, respectively Clips. Clips similar to those shown in Figure 2b were installed to investigate possible improvements in the seismic performance of SCS. These clips can be attached to main beams or cross tees behind lay-in ceiling tiles and help to prevent the panes from dislodging. In this study, the clips were installed on the 1.22 m (4 ft) long cross tees of the grid.
a) Tile Dune Humigard Plus b) Retention clips Figure 2. Tile and clips used in the fragility study Dynamic Characteristics of the Test Frame The dynamic characteristics of the test frame were evaluated along the two programmable axes of the earthquake-simulator platform, namely, the North-South and vertical directions. Three methods were used to identify the dynamic properties of the test frame: free vibration, by means of a snap-back test, and two forced vibration tests, by means of resonance search and white noise tests. Details are provided in Badillo (2003) and Badillo et al. (2003). Table 2 lists summary information for the first mode natural frequencies and the damping ratios, respectively, for the horizontal and vertical direction, obtained using the test three methods.
TABLE 2. Damping ratios and natural frequencies obtained with the three testing methods
Natural frequency Damping ratio
Direction
Snap Back
Frequency Sweep
White Noise
Horizontal
12.5 Hz
12.1 Hz
12.3 Hz
Vertical
9.6 Hz
9.6 Hz
9.5 Hz
Horizontal
2.6%
5.1%
4.7%
Vertical
0.5%
0.4%
0.7%
Seismic Qualification and Fragility Testing Protocol The protocol for fragility testing followed the procedures set forth in the ICBO-AC156 “Acceptance Criteria for Seismic Qualification Testing of Nonstructural Components” (ICBO, 2000). The first step to develop earthquakes histories for fragility testing was to define a target spectrum or required response spectrum (RRS) as a function of the mapped spectral acceleration at short period SS. The RRS for horizontal shaking was developed using the normalized response spectrum of Figure 3. Horizontal RRS Vertical RRS AFLX ARIG
2/3 AFLX
2/3 ARIG
AFLX /15 (2/3) AFLX /15 0.1
1.3
8.3
33.3
Frequency (Hz)
Figure 3. Parameters of the ICBO Required Response Spectrum for horizontal and vertical shaking For horizontal design basis earthquake shaking, the International Building Code (ICC, 2000) defines the short period design basis earthquake acceleration response as: 2 S DS = Fa S S (1) 3
where SDS is the design spectral response acceleration at short periods, Fa is the site coefficient, and SS is the mapped maximum earthquake spectral acceleration at short periods. Accelerations demands for testing components attached to floors are obtained per ICBO-AC156 assuming that the spectral acceleration ARIG of a rigid component (assumed to have a frequency f ≥ 33 Hz) is given by equation (2) and that of a flexible component AFLX is given by equation (3). z ARIG = 0.4 S DS (1 + 2 ) ≤ 1.2 S DS h z AFLX = S DS (1 + 2 ) ≤ 1.6 S DS h
(2) (3)
where z is the height above the base of the building where the equipment or component is to be installed and h is the height of the building. If the equipment or component is to be installed in the roof of the building, z/h = 1.0. If the location of the equipment or component in a building is unknown, or if it is being qualified for a general use in buildings structures, it is conservative, but appropriate, to set z = h. The ordinates of the vertical required response spectrum are given by ICBO as two-thirds (2/3) of those of the horizontal RRS. Testing Protocol. The testing protocol for fragility testing consisted of sets of horizontal and vertical dynamic excitations. Each set included unidirectional and bi-directional resonance search tests using white noise excitation along each programmable orthogonal axis of the simulation platform (North-South and vertical). Each set of excitations also included a series of unidirectional and bi-directional spectrumcompatible earthquake motions that were established for different multiples of RRS. The parameter selected to characterize the ground motion for input to the simulator was the mapped spectral acceleration at short periods, SS. The target of shaking levels ranged from a SS = 0.25 g through SS = 2.5 g. Information on the generation of the earthquake histories for testing is presented in Badillo (2003) and Badillo et al. (2003). Figure 4 presents the horizontal and vertical simulator input acceleration records and their corresponding response spectra after applying the procedure to eliminate the low frequency content, for a level of shaking corresponding to SS = 1.0g. 0.6 0.4 0.2 0.0 -0.2 -0.4 -0.6
1.4 1.2 1.0 0
10
20
30
40
Tim e (s e c o nds )
0.8
a) Horizontal acceleration
0.6
0.6 0.4 0.2 0.0 -0.2 -0.4 -0.6
0.4
Ho rizo ntal Target Spectrum Ho rizo ntal Respo nse Spectrum
0.2
Vertical Target Spectrum Vertical Respo nse Spectrum
0.0 0
10
20 Tim e (s e c o nds )
b) Vertical acceleration
30
40
0.1
1
F re que nc y (Hz)
10
100
c) Response spectra (target and calculated)
Figure 4. Earthquake histories and spectra for a level of shaking corresponding to SS = 1.0g Simulator Testing of SCS
Four variables that affect the seismic performance of SCS were investigated in this study: (1) the size and weight of tiles, (2) the use of retainer clips, (3) the use of compression posts, and (4) the physical condition of grid components. A total of six set-ups were configured using different combinations of these variables: (1) undersized tiles (series A-D), (2) undersized tiles with retainer clips (series E-G), (3) undersized tiles with recycled grid components (series H-J), (4) normal sized tiles (series L-O, Q, R and BB), (5) normal sized tiles with retainer clips (series P and S-U) and (6) normal sized tiles without the compression post (series: V-Z and AA). Results. The addition of the ceiling tiles added mass and some stiffness to the suspension grid. Only the vertical frequency of the system was altered substantially by the addition of the tiles. For example, the
natural frequencies of the test frame established using white noise testing were 12.3 Hz and 9.5 Hz in the horizontal and vertical directions, respectively, whereas when the ceiling system of Series F was installed in the test frame, the frequencies were 12.0 Hz and 6.7 Hz in the horizontal and vertical directions, respectively. Similar results were obtained in the other series. Configuration 1: Undersized Tiles. The most common failure pattern of the tiles began with the tiles jumping up (popping up) out of the grid. If the tiles did not return to the original position on the suspension system (i.e., tiles lying on the web of the cross tees in one or more sides of the tile or tiles slightly tilted), it was very likely that the tiles would rotate and fall. See Figure 5a that shows a tile an instant before it fell to the earthquake simulator below. Configuration 2: Undersized Tiles with Retainer Clips. The retainer clips substantially improved the behavior of the SCS in terms of loss of tiles in comparison with the systems of configuration 1. By retaining the tiles, the clips increased the inertial loads on the grid, resulting in grid damage at lower levels of shaking. Figure 5b shows a buckled 1.22 m (4-ft) cross tee following severe earthquake shaking. Another type of commonly observed damage to the grid components was failure and fracture of the latches of the cross tees. In the systems of configuration 2, tiles were lost primarily due to failure of grid components.
a) Tile rotating before falling, configuration 1 b) Buckling in 4-ft cross tees, configuration 2 Figure 5. Damage in tiles and suspension grid Configuration 3: Undersized Tiles with Recycled Grid Components. Including recycled cross-tees in the assemblage of the suspended grid substantially increased the number of tiles that fell during the earthquake tests, by comparison with the systems where only new grid components were used. Although the failure pattern of the tiles was similar to that of configuration 1, the number of tiles that fell in configuration 3 was larger because the locking assembly latches that secured the connection between the cross tees did not lock completely, leaving the mechanical connection between the cross tees slightly loose. Therefore, the ability to transfer load between adjacent sections of the ceiling grid was diminished by comparison with the systems where only new grid components were used. Configuration 4: Normal Sized Tiles. The number of tiles that fell during the shaking tests of ceiling systems with undersized or poorly fitting tiles was substantially larger by comparison with the systems equipped with normal sized (snug) tiles. However, ceiling system performance in terms of damage to grid components was better in the systems with undersized tiles. This observation is due mainly to two factors: (1) the weight of the normal sized tiles was larger (1.7 kg/tile) than the undersized tiles (1.3 kg/tile), and
(2) because the number of tiles that stayed in place during shaking was larger for the systems of configuration 4: inertial loads on the suspension grid were larger for configuration 4 than in configuration 1. The buckling in the web of the 1.22 m (4-ft) cross tees was similar to the damage that the grid components experienced in configuration 2 during higher levels of shaking. The tile failure pattern in configuration 4 was similar to that of configuration 1. Minor changes in boundary conditions can significantly affect the response of ceiling systems and the fragility curves developed using such data. This was the case for Series Q where damage to the wall molding resulted in a significant change in response. Because the boundary conditions of series Q varied from those of series L, M, N, O, R and BB, the data from the Series Q tests were not used to develop fragility curves. Configuration 5: Normal Sized Tiles with Retainer Clips. The damage produced by the horizontal and vertical unidirectional motions was minimal and was concentrated in the grid components. The retainer clips substantially improved the behavior of the SCS in terms of loss of tiles by comparison with the systems of configuration 4, where clips were not included. The use of the retainer clips shifted the damage from the tiles to the suspension grid. The type of damage that was observed in the East-West 1.22 m (4-ft) cross tees of configuration 2 was also observed in the systems of configuration 5. In both systems, the loss of tiles was primarily due to the failure of grid components. Configuration 6: Normal Sized Tiles without Compression Post. The absence of the compression post made the suspension grid more flexible in the vertical direction. One argument for including compression posts in SCS is that damage to the system is mitigated by reducing the vertical displacement of the tiles and grid. By comparing the results obtained from tests with and without compression posts it is not 100percent certain that the use of compression posts reduces damage to ceiling systems. General Observations. The rivets that attached the main runners and cross tees to the wall molding of the test frame played a very important role in the seismic performance of the SCS. When a rivet came loose or was destroyed during shaking, the damage in the ceiling systems in terms of loss of tiles was much larger than when all of the rivets were undamaged and the cross tees remained firmly attached to the wall molding. The main beams provide most of the stiffness in the suspension grid in the horizontal and vertical directions. However, the connections between the main beams were substantially more flexible than the main beams. This is clearly reflected in the performance of the ceiling systems in terms of loss of tiles because the first tiles to fall in most of the tests were the tiles located around connections between two main beams. Fragility Analysis and Data Evaluation. One of the purposes of fragility analysis is to identify the seismic vulnerability of systems (or components of a system) associated with various states of damage. A fragility curve describes the probability of reaching or exceeding a damage (or limit) state at a specified level of excitation. Thus, a fragility curve for a particular limit state is obtained by computing the conditional probabilities of reaching or exceeding that limit state at various levels of excitation. A plot of the computed conditional probabilities versus the ground motion parameter describes the fragility curve for that damage state (Singhal and Kiremidjian, 1996). The conditional probability of reaching or exceeding a damage state are described as follows:
P = P [D ≥ d | Y = y ] (4) ik i k where Pik is the probability of reaching or exceeding a damage state di given that the excitation is yk; D is a damage random variable defined on damage state vector D = {d0, d1, …. , dn}; and Y is an excitation random variable.
Limit States. A limit state is useful in describing the expected performance of a component or system when it is subjected to specific earthquake demands by characterizing the physical post-earthquake state of the component or structure. Limit states express qualitatively (physical condition of components, failure in specific areas of the structure, etc.) or quantitatively (measured in terms of internal forces, number of elements that fail in a system, damage indices of the overall structure, etc.) permissible levels of damage. Four limits states were defined in this study to characterize the seismic response of SCS. Limit states 1 through 3 account for the number (or percentage) of tiles that fell from the suspension grid. The fourth limit state is associated with structural damage to the suspension grid. The four limits states were: (1) minor damage (loss of 1% of the tiles from the grid), (2) moderate damage (loss of 10% of the tiles from the grid), (3) major damage (loss of 33% of the tiles from the grid), and (4) grid failure. Detailed descriptions of limit states are provided in Badillo (2003) and Badillo et al. (2003). Ground Motion Intensity Parameters. Several intensity parameters have been used in previous studies to create fragility curves, namely peak ground acceleration, peak ground velocity, spectral acceleration at specific periods, and spectral acceleration over a frequency range that would bracket the in-service dynamic properties of a specific system. There is no uniformly accepted intensity measure for a use in the construction of fragility curves. For transformer bushings, Whittaker et al. (2003) suggests that spectral acceleration is a better parameter than peak ground acceleration and that spectral acceleration over a broad frequency range that brackets the in-service condition of the system is likely the best fragility metric of the three identified above.
In this study, two excitation parameters were used to construct the fragility curves presented below and in Badillo (2003) and Badillo et al. (2003): (1) peak ground acceleration, and (2) average horizontal spectral accelerations at selected periods. The selected periods represent a broad range that should include most in-service conditions for SCS in buildings: 0.2, 0.5, 1.0, 1.5 and 2.0 seconds. The spectral acceleration ordinates were obtained by calculating the mean spectral acceleration for each ceiling system configuration tested. Evaluation of Fragility Data. The four limit states specified to characterize the seismic performance of SCS were selected with the intent of covering most of the performance levels described in current seismic codes and guidelines for seismic performance of nonstructural components. The procedure to develop the fragility curves for each configuration is illustrated in Figure 6. The data presented in the illustration of the procedure is from the 6 systems that were part of configuration 4: Systems L, M, N, O, R and BB. The procedure was as follows: (1) obtain the mean spectral acceleration response for each shaking level with the accelerometer mounted on the simulator platform (see the heavy solid line in figure 6a), (2) compute the spectral accelerations at selected periods (0.2, 0.5, 1.0, 1.5 and 2.0 seconds) from the mean spectral accelerations (see the arrows in figure 6a for the 1-second calculation, S1.0 = 2.36 g), (3) count the number of tiles that fell from the grid for each system (6 systems in this example) at each shaking level as a percentage of the total number of tiles in the ceiling system, (4) compare the percent tile failure with each limit state for each system, and (5) calculate the probability of reaching or exceeding the limit state as:
Pf =
Nf
(5) N where Nf is the number of systems (trials) where the limit state was reached or exceeded and N is the total number of systems in configuration. As N approaches infinity, Pf approaches the true probability of reaching or exceeding a limit state. The fragility curves were obtained by plotting Pf for each shaking level versus the corresponding mean spectral acceleration (Figure 6b).
1.0 6.0
0.9
Series L
0.8
Series M
5.0 4.0
Series N
0.7
Series O
0.6
Series R
0.5
Series BB
3.0
2.36g
M ean
0.4 0.3
2.0
0.2 0.1
1.0
0.0 0.0
0.0 0.01
0.1
1
0.5
1.0
10
1.5 S 1.0(g)
2.0
2.5
3.0
P e rio d (s e c o nds )
a) Mean spectral acceleration at 1.0 second for b) Fragility curve for limit state 2: moderate shaking level corresponding to SS = 2.5g failure for spectral acceleration at 1.0 second Figure 6. Illustration of procedure to develop fragility curves, configuration 4: normal sized tiles
Figure 7 presents sample fragility curves developed using data from the earthquake simulator testing of configuration 1 that used undersized tiles. Much additional information is available in Badillo (2003) and Badillo et al. (2003). Figure 7a presents fragility curves for peak ground acceleration (0 second period spectral acceleration) and Figure 7b presents fragility curve for the spectral period of 1.5 seconds. The curves below indicate that the limiting values of peak ground acceleration at which 100% probability of exceedance was observed were 0.90 g, 1.07 g, and 2.05 g for limit states 1 through 3, respectively. The corresponding values of spectral acceleration at 1.5 seconds were 0.27 g, 0.34 g and 0.44 g. Similar figures were obtained in this study for each of the spectral acceleration periods selected and for each of the six configurations. The fragility curves are incomplete because the maximum acceleration, velocity, and displacement of the simulator are limited to 1.5 g, 94 cm/sec (37 in/sec) and 14 cm (5.5 in.), respectively, and shaking in excess of these limits was not possible. Different scales were used in plotting the fragility curves because the magnitude of the spectral acceleration changed substantially as a function of period. 1.0
1.0 M ino r (1% fe ll)
0.9 0.8
0.8
M o de ra te (10% fe ll)
0.7
0.5
M a jo r (33% fe ll)
0.6 0.5
Grid fa ilure
0.4
M o de ra te (10% fe ll)
0.7
M a jo r (33% fe ll)
0.6
M ino r (1% fe ll)
0.9
Grid fa ilure
0.4
0.3
0.3
0.2
0.2
0.1
0.1
0.0
0.0 0.0
0.5
1.0
1.5 P GA(g)
2.0
2.5
0.0
0.1
0.2
0.3 S 1.5(g)
0.4
0.5
0.6
a) Curves for peak ground acceleration b) Curves for spectral acceleration at 1.5 seconds Figure 7. Fragility curves for configuration 1: undersized tiles
Conclusions
Twenty-seven sets of earthquake-simulator tests were undertaken on six tile-suspension systems as part of the first comprehensive evaluation of the seismic fragility of suspended ceiling systems. The key conclusions of the study include: 1. The most common failure mode of tiles when retention clips were not used was tiles popping out of the grid. If the tiles did not return to the original position on the suspension system, it was very likely for the tiles to rotate and fall to the simulator platform below. 2. The use of retainer clips substantially improved the behavior of the SCS in terms of loss of tiles. However, by retaining the tiles, the clips increased the inertial loads on the grid, resulting in grid damage at lower levels of shaking. The loss of tiles in systems with retention clips was due primarily to the failure of grid components. 3. Including recycled cross-tees in the assemblage of the suspended grid substantially increased the number of tiles that fell during the earthquake tests because the locking assembly latches that secured the connection between the cross tees did not lock completely, leaving the mechanical connection between the cross tees slightly loose. 4. The effect of a small variation in tile size on the performance of the ceiling systems was considerable in terms of loss of tiles. The number of tiles that fell during the shaking tests of ceiling systems with undersized tiles was substantially larger by comparison with the systems equipped with normal sized tiles. However, ceiling system performance in terms of damage to grid components was better in the systems with undersized tiles because the inertial loads on the suspension grid were smaller than in those systems with normal sized tiles. 5. The rivets that attached the main runners and cross tees to the wall molding played a very important role in the seismic performance of the SCS. Damage in the ceiling systems in terms of loss of tiles was much larger when a rivet failed than when all of the rivets were undamaged and the cross tees remained firmly attached to the wall molding. Acknowledgements
Armstrong World Industries Inc. provided all of the ceiling system components for the fragility testing program. This support is gratefully acknowledged. Special thanks are due to Messrs Paul Hough and Thomas Fritz of Armstrong World Industries and Messrs Mark Pitman, Scot Weinreber, Duane Kozlowski and Michael Astrella of the Department of Civil, Structural and Environmental Engineering at University at Buffalo for their technical guidance and support at different times over the course of this study. Partial support for the work described in this paper was provided by the Multidisciplinary Center for Earthquake Engineering Research through grants from the Earthquake Engineering Centers Program of the National Science Foundation (Award Number EEC-9701471) and the State of New York. This support is also acknowledged. The opinions, findings, conclusions expressed in this paper are those of the authors and do not necessarily reflect the views of the sponsors or the Research Foundation of the State University of New York.
References
ANCO. (1993). “Earthquake Testing of a Suspended Ceiling System”, ANCO Engineers Inc., Culver City, California. Badillo, H. (2003). “Seismic Fragility Testing of Suspended Ceiling Systems”, M.S. Thesis, School of Engineering, State University of New York at Buffalo, Buffalo, New York. Badillo, H., Whittaker, A. S., and Reinhorn, A. M. (2003). “Seismic Fragility of Suspended Ceiling Systems”, Paper submitted for review, Earthquake Spectra, November. ICC. (2000). International Building Code, International Code Council, Falls Church, Virginia. ICBO. (2000). “ICBO AC156 Acceptance Criteria for the Seismic Qualification of Nonstructural Components”, ICBO Evaluation Service, Inc. International Conference of Building Officials. Whittier, California 90601-2298. Reinhorn A. M., Barron-Corverra, R., and Gustavo Ayala, A. (2002), “Global Spectral Evaluation of Seismic Fragility of Structures” Proceedings, 7th U.S. National Conference on Earthquake Engineering, Earthquake Engineering research Institute, Oakland, California. Rihal, S. and Granneman, G. (1984). “Experimental Investigation of the Dynamic Behavior of Building Partitions and Suspended Ceilings During Earthquakes”, Rep. No. ARCE R84-1, California Polytechnic State University, Pomona, California. Sasani, M. and Der Kiureghian, A. (2001). “Seismic Fragility of RC Structural Walls: Displacement Approach”, Journal of Structural Engineering, Vol. 127, No.2, pp. 219-228. Shinozuka, M., Grigoriu M., Ingraffea, A. R., Billington, S. L., Feenstra, P., Soong T. T., Reinhorn A. M. and Maragakis, E. (2000a), “Development of Fragility Information for Structures and Nonstructural Components”, MCEER Research Progress and Accomplishments Volume 1999-2000, pp. 15-32. Shinozuka, M., Feng, M. Q., Lee, J., and Naganuma, T. (2000b). ‘Statistical Analysis of Fragility Curves”, Journal of Engineering Mechanics, Vol. 126, No. 12, pp. 1224–1231 Singhal, A. and Kiremidjian, A. S. (1996). “Method For Probabilistic Evaluation of Seismic Structural Damage”, Journal of Structural Engineering, Vol. 122, No.12, pp. 1459-1467. Smith, S. W. (1999). “The Scientist and Engineer's Guide to Digital Signal Processing”, 2nd Edition, California Technical Publishing, San Diego, California. Whittaker, A. S., Fenves, G. L. and Gilani, A. S. J. (2003). “Earthquake Performance of Porcelain Transformer Bushings”, Earthquake Spectra, Vol. 19, No. 4. Yao, G. C. (2000). “Seismic Performance of Direct Hung Suspended Ceiling Systems”, Journal of Architectural Engineering, Vol. 6, No. 1, pp. 6-11.