Performance Comparison of Speaker Recognition Systems in Presence of Duration Variability ∗‡
Arnab Poddar∗ , Md Sahidullah† , Goutam Saha‡ Dept of Electronics and Electrical Communication Engineering, Indian Institute of Technology, Kharagpur, India † Speech and Image Processing Unit, School of Computing, University of Eastern Finland, Joensuu, Finland Email: ∗
[email protected], †
[email protected], ‡
[email protected]
Abstract—Performance of speaker recognition system is highly dependent on the amount of speech data used in training and testing. In this paper, we compare the performance of two different speaker recognition systems in presence of utterance duration variability. The first system is based on state-of-the-art total variability (also known as i-vector system), whereas the other one is classical speaker recognition system based on Gaussian mixture model with universal background model (GMM-UBM). We have conducted extensive experiments for different cases of length mismatch on two NIST corpora: NIST SRE 2008 and NIST SRE 2010. Our study reveals that the relative improvement of total variability based system gradually drops with the reduction in test utterance length. We also observe that if the speakers are enrolled with sufficient amount of training data, GMM-UBM system outperforms i-vector system for very short test utterances. Keywords—Duration Variability, Gaussian Mixture ModelUniversal Background Model (GMM-UBM), Gaussian PLDA (GPLDA), i-vector, NIST SRE, Short Utterance, Speaker Recognition.
I.
I NTRODUCTION
Speech signal conveys information regarding the physiological aspects of a speaker because it is affected by the unique shape and size of vocal tract, mouth, nasal cavity, etc [1], [2]. It also carries information related to the behavioral aspects of a speaker like accent and involuntary transforms of acoustic parameters. Therefore, voice samples can be used as a biometric in real-life application. Speaker recognition is the process of automatically recognizing the speakers from their voice samples. Its potential applications include telephone banking system, system access control, providing forensic evidence, call centers and many more [1], [2]. Speaker recognition task can be sub-divided into two major tasks: speaker identification (SI) [3] and speaker verification (SV). Speaker identification is to find the identity of the speaker from a speech utterance. On the other hand, speaker verification refers to the authentication of a claimed identity of a person from his/her speech data. SV system can be broadly categorized as text-dependent (TD) [4] and text-independent (TI) modes depending on the speech content in training and test phase [1], [2]. The TD-SV requires the same set of text to be spoken during training as well as testing. In the case of TI-SV, it does not have any restriction over train and test data. A TI speaker recognition system includes three fundamental modules [1], [2]: a feature extraction unit, which represents the speech signal in a compact manner, a modeling block to characterize those features using statistical approaches, and c 2015 IEEE 978–1–4673–6540–6/15/$31.00 ⃝
lastly, a classification scheme to classify the unknown utterance. Mel frequency cepstral coefficients (MFCCs), perceptual linear prediction (PLP), etc. are commonly used as speech features for speaker recognition [5], [6]. For classification, various modeling techniques such as vector quantization (VQ) [7], dynamic time warping (DTW) [8], Gaussian mixture model (GMM) [9] were used. During the last two decades in speaker recognition research, most of the notable developments in classifier-level are based on the GMM concept [10], [11], [12]. It also found applications in various field like speech language recognition [13], voice conversion [14], detection of spoofing attacks [15] in SR systems etc. Subsequently, joint factor analysis (JFA) based approach is introduced which successfully integrates session variability compensation techniques [16], [17]. Here, the concatenated means of adapted GMM (known as GMM supervector) are decomposed into speaker and session dependent component using factor analysis technique. Speaker factors are compared for training and test segments after subtracting the session related factors. Inspired by the earlier use of JFA, Dehak et al. proposed total-variability based approach for reducing the dimensionality of GMM-supervector [18]. Here, unlike JFA, a single space called total variability space is used to represent the GMM supervector corresponding to a speech utterance. This low-dimensional representation of high-dimensional supervector is known as identity vectors or i-vectors. The state-of-the-art speaker recognition system uses i-vector based system with Gaussian probabilistic linear discriminant analysis (GPLDA) based scoring where the ivectors are further decomposed into speaker and channel subspace to efficiently handle intersession variability [19], [20]. Though i-vector based speaker recognition systems are shown to give best recognition accuracy in latest NIST SREs [18], [19], [21], they require huge computational resources as well as massive amount of development data for estimating its parameters and hyper-parameters. For this reason, GMM-UBM systems are still popular and widely used, particularly when suitable amount development data is inadequate [10], [5], [14]. The performance of a speaker recognition system is severely degraded with the reduction in amount of speech data during train and test phase [21], [22], [23], [24], [25]. State-ofthe-art i-vector system gives considerable recognition accuracy when more than two minutes of speech data are available in both phases [19], [21]. But practically, real-time systems may not facilitate the luxury on amount of speech data. When designing a practical speech-based authentication system, the requirement in training segment duration can be fulfilled by enrolling the speaker with adequate amount of speech data. However, this is impractical to maintain during the verification
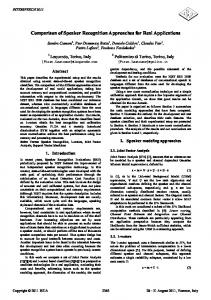
Universal Background Model ( UBM )
enrollment utterance
Total Variability Matrix
BW Statistics
Feature Extraction
Gaussian PLDA Model Parameter
i-vector Extraction
LDA +LN+WT
enrollment i-vectors
MAP adaptation speaker Model
Batch Likelihood estimation
verification utterance
Decision for
Feature Extraction
BW Statistics
Likelihood estimation UBM Decision for
i-vector Extraction
LDA +LN+WT
i-vector
verification i-vectors
UBM
Figure 1: Block Diagram showing how the scores of GMM-UBM and i-vector system are calculated from enrollment and verification utterance.
phase. The test speech duration should be as low as possible so that decision regarding acceptance or rejection can be made in real-time. Another issue associated with this state-of-theart i-vector system is that it requires various computationally expensive processes for getting the recognition results [26]. On the other hand, the GMM-UBM system gives the decision in relatively short time by just computing the likelihood ratio directly using the cepstral feature. GMM-UBM systems perform well for short test segments [27], [28]. To the best of our knowledge, a systematic comparison of these two systems including the effect of duration variability is not available in present literatures even though it has practical significance. In this work, we explore the impact of duration variability on both GMM-UBM and TV systems using the same benchmark data and performance evaluation metrics. Exhaustive experiments are carried out by varying both the length of training and test utterance. Our experimental results reveal that though TV system is performing better than GMM-UBM in many conditions, but the classical approach is still better than the state-of-the-art technique for condition very similar to practical requirements i.e. when speakers are enrolled with sufficient amount of speech data and tested with short segments. The rest of the paper is organized as follows. Section II briefly describes GMM-UBM based system. In section III, we have discussed about i-vector GPLDA system. In section IV, the set-up arranged to conduct the experiments is described. Experimental results are presented in section V. Finally, the paper is concluded in VI. II.
GMM-UBM BASED SV SYSTEM
The task of a typical SV system is to discriminate between target and imposter speakers based on two hypothesis, i.e, whether the verification utterance belongs to the target speaker or not. The block diagram of a typical SV system is shown in Fig 1 which shows both TV and GMM-UBM framework. In GMM-UBM, prior to enrollment phase, a single speaker independent universal background model (UBM) is created by using a large development data [10], [14]. The UBM represented as 𝝀𝑈 𝐵𝑀 = {𝑤𝑖 , 𝝁𝑖 , Σ𝑖 }𝐶 𝑖=1 where 𝐶 is the total number of Gaussian mixture components, 𝑤𝑖 is the weight or
prior of 𝑖th mixture component, 𝝁𝑖 is the mean and co-variance matrix ∑𝐶 is given by Σ𝑖 . Parameter 𝑤𝑖 satisfies the constrain 𝑖=1 𝑤𝑖 = 1. A group of 𝑆 speakers is represented by their corresponding model as {𝝀1 , 𝝀2 , . . . , 𝝀𝑆 }. In the GMM-UBM system, we derive the target speaker model by adapting the GMM-UBM parameters. The model parameters are adapted by maximum a posteriori (MAP) method. Initially, sufficient statistics 𝑁𝑖 and E𝑖 from a hypothesised speaker’s utterance with 𝑇 frames X = {x1 , x2 , . . . , x𝑇 }, are calculated as, ∑𝑇 ∑𝑇 𝑁𝑖 = 𝑡=1 𝑃 𝑟(𝑖∣x𝑡 ) and E𝑖 (X) = 𝑁1𝑖 𝑡=1 𝑃 𝑟(𝑖∣x𝑡 )x𝑡 where probability distribution of component density conditioned on speech data 𝑃 𝑟(𝑖∣x𝑡 ) is given by 𝑤𝑖 𝑝𝑖 (x𝑡 ) 𝑃 𝑟(𝑖∣x𝑡 ) = ∑𝐶 𝑗=1 𝑤𝑗 𝑝𝑗 (x𝑡 )
(1)
Each component density is a 𝑑-variate Gaussian function of the form 𝑝𝑖 (x) =
1 1
(2𝜋)𝑑/2 ∣Σ∣ 2
1 𝑒𝑥𝑝{− (x − 𝝁𝑖 )⊤ Σ−1 𝑖 (x − 𝝁𝑖 )} (2) 2
Finally, the sufficient statistics from training data are used to adapt GMM-UBM parameters to obtain adapted parameters 𝑤ˆ𝑖 , 𝝁ˆ𝑖 for target speakers. In the testing phase, average log-likelihood ratio Λ(X) is determined using test feature vector X = {x1 , x2 , . . . , x𝑇 } against both target model and the background model. Λ𝑈 𝐵𝑀 (X𝑡𝑒𝑠𝑡 ) = 𝑙𝑜𝑔 𝑝(X𝑡𝑒𝑠𝑡 ∣𝝀𝑡𝑎𝑟𝑔𝑒𝑡 ) − 𝑙𝑜𝑔 𝑝(X𝑡𝑒𝑠𝑡 ∣𝝀𝑈 𝐵𝑀 ) (3) ∑𝑇 where 𝑙𝑜𝑔 𝑝(X𝑡𝑒𝑠𝑡 ∣𝝀) = 𝑇1 𝑡=1 𝑙𝑜𝑔 𝑝(x𝑡𝑒𝑠𝑡 ∣𝝀) Finally, in 𝑡 decision logic block, an algorithm is applied to decide whether the claimant speaker will be accepted or rejected by the SV system. Popularly a decision threshold 𝜃 is used for decision, like if Λ𝑈 𝐵𝑀 (X) ≥ 𝜃 then the claim will be accepted, else rejected.
III.
I - VECTOR BASED
SV SYSTEM
i-vector is considered as the state-of-the-art in SV research. The basic block diagram of i-vector based SV system system is shown in Fig. 1. The i-vector represents the GMM supervector by a single variability space which reduces high dimensional GMM supervector into lower dimensional total variability space [18]. In TV space, GMM supervector, i.e, the concatenated means of GMM mixture components, is rewritten as M = m + Φy (4) where Φ is a low-rank total variability matrix and y is represented as i-vector, m is the speaker and channel independent supervector (taken to be UBM supervector) and 𝑴 is the speaker-and channel-dependent GMM supervector. A UBM model consisting of 𝐶 Gaussian components can be represented by the parameter set 𝝂 = {𝝂 1 , 𝝂 2 , . . . , 𝝂 𝐶 }, where 𝑖th mixture component is characterised by 𝝂 𝑖 = {𝑤𝑖 , 𝝁𝑖 , Σ𝑖 }. Then, for single utterance X with feature sequence {x1 , x2 , . . . , x𝑇 }, the zeroth and first order centered sufficient statistics ∑𝑇 are calculated as fol∑𝑇 𝑁𝑖 and F𝑖 respectively lows 𝑁𝑖 = 𝑡=1 𝑃 𝑟(𝑖∣x𝑡 ) F𝑖 = 𝑁1𝑖 𝑡=1 𝑃 𝑟(𝑖∣x𝑡 , 𝝀𝑖 )(x𝑡 − 𝝁𝑖 ). These 𝑁𝑖 and F𝑖 are used to obtain the i-vectors y. The prior distribution of i-vectors 𝑝(y), is assumed to be 𝒩 (0, 𝐼) and posterior distribution of F, conditioned on the ivector y is hypothesised to be 𝑝(F∣y) = 𝒩 (Φy, N−1 Σ). The MAP estimate of y conditioned on F is given by ⊤
𝐸(y∣F) = (I + Φ⊤ Σ−1 NΦ)−1 Φ Σ−1 NF
(5)
the mean of the posterior distribution of y conditioned on F is adopted as the i-vector of an utterance. A. Gaussian Probabilistic Linear Discriminate Analysis (GPLDA) A recent attempt to model speaker and channel variability in i-vector space is accomplished through Probabilistic LDA (PLDA) modelling approach. In this paper, we concentrate on a simplified variant of PLDA, named as Gaussian PLDA [19]. Here, the inter-speaker variability is modelled by a full covariance residual term. The generative model for 𝑠th speaker and 𝑗 th recording of new i-vector variability projected space is given by y𝑠,𝑗 = 𝜼 + Ψz𝑠 + 𝝐𝑠,𝑗 (6) where, 𝜼 is the mean of the development i-vectors, Ψ is eigenvoice subspace and z is a vectors of latent factors, which is assumed to have prior distribution 𝒩 (0, I). The residual term 𝝐 represents the variability not captured by the latent variables. This regenerative model approach of i-vector space representation has been applied successfully with significant improvement in speaker recognition research [19]. B. Likelihood Computation GPLDA based i-vector system score calculation uses batch likelihood ratio [19]. For a projected enrollment and verification i-vector z𝑡𝑎𝑟𝑔𝑒𝑡 and z𝑡𝑒𝑠𝑡 respectively, the batch likelihood ratio Λ𝐺𝑃 𝐿𝐷𝐴 (z𝑡𝑎𝑟𝑔𝑒𝑡 , z𝑡𝑒𝑠𝑡 ) can be calculated as follows
Table I: Database set-up description of NIST 2008 and NIST 2010. Database
Verification Task
NIST NIST NIST NIST
short2-10sec short2-short3 core-10sec core-core
2008 2008 2010 2010
No of speaker model
No of test trials
1270 1270 1203 1203
3958 6615 11990 14060
𝑝(z𝑡𝑎𝑟𝑔𝑒𝑡 , z𝑡𝑒𝑠𝑡 ∣𝐻1 ) 𝑝(z𝑡𝑎𝑟𝑔𝑒𝑡 ∣𝐻0 ) 𝑝(z𝑡𝑒𝑠𝑡 ∣𝐻0 ) (7) where 𝐻1 : The i-vectors belong to the same speaker. 𝐻0 : The i-vectors belong to different speaker. Λ𝐺𝑃 𝐿𝐷𝐴 (z𝑡𝑎𝑟𝑔𝑒𝑡 , z𝑡𝑒𝑠𝑡 ) = 𝑙𝑜𝑔
IV.
E XPERIMENTAL SET- UP
Both GMM-UBM and i-vector based systems use mel frequency cepstral coefficient (MFCC) with 20 ms frame size and 10 ms frame shift as in [5]. Hamming window is applied in MFCC extraction process [29]. The non-speech frames are dropped using energy based voice activity detector (VAD) [30] and at the end cepstral mean and variance normalisation (CMVN) is applied on coefficients [5]. 19 dimensional MFCC with appended delta and double delta coefficients (57 dimensional) are used throughout the experiments. Gender dependent UBM of 512 mixture components are trained with 10 iterations of EM algorithm. We have used NIST 2004 and NIST 2005 corpora as development data to generate UBM, GPLDA and LDA model parameters. Total variability subspace of dimension 400 is implemented for i-vector. LDA on i-vector space is used to reduce the dimension to 200, and speaker variability subspace i.e, eigen-voice space is applied to further reduce the i-vector dimension to 150. A. Experiments and Corpora The performance of two popular speaker modelling methods were evaluated on NIST SRE 2008 [31] and NIST SRE 2010 [32] corpora. We have used NIST 2008 short2-short-3, short2-10 sec and NIST 2010 core-core, core-10 sec speaker recognition task for evaluation. Later, we have used utterances which are utterance truncated versions of NIST 2008 Short2Short3 task for experiments in varying utterance duration condition. Truncation of speech utterances is done in 2 sec (200 active frames), 5 sec (500 active frames), 10 sec (1000 active frames), 20 sec (2000 active frames) and 40 sec (4000 active frames) duration. For truncation of utterances, the prior 500 active speech frames are discarded to avoid phoneme dependency which refers to, capturing phonetically similar data. Only male speakers of english trials from NIST 2008 and telephone-telephone trials of from NIST SRE 2010 are used in the following experiments. The experiments are preformed on the male data subset of the corpora, taken from both NIST databases. The database description is summarised in Table I. B. Performance metrics For both NIST 2008 and NIST 2010, the performance was evaluated using equal error rate (EER) and detection cost
Table II: Results for comparison of i-vector-GPLDA(TV) based system vs GMM-UBM based system on 2008 NIST SRE short2-short3, short2-10sec conditions. Verification Task
Training duration
Testing duration
short2-short3 short2-10 sec short2-10 sec
Full Full 10 sec
Full 10 sec 10 sec
EER [%] (TV)
EER [%] (UBM)
𝐸𝐸𝑅 𝑅𝐼𝑇 [%] 𝑉
DCF × 100 (TV)
DCF × 100 (UBM)
𝐷𝐶𝐹 𝑅𝐼𝑇 [%] 𝑉
3.48 11.49 16.81
12.30 18.46 20.76
72 38 19
2.16 4.62 6.45
5.28 6.30 8.05
59.04 26.67 19.88
Table III: Results for comparison of i-vector-GPLDA(TV) based system vs GMM-UBM based system on 2010 NIST SRE core-core, core-10sec conditions. Verification Task
Training duration
Testing duration
core-core core-10 sec core-10 sec
Full Full 10 sec
Full 10 sec 10 sec
EER [%] (TV)
EER [%] (UBM)
𝐸𝐸𝑅 𝑅𝐼𝑇 [%] 𝑉
DCF × 100 (TV)
DCF × 100 (UBM)
𝐷𝐶𝐹 𝑅𝐼𝑇 [%] 𝑉
4.53 11.41 19.54
14.16 18.64 23.82
68 39 18
2.33 5.60 7.85
4.88 6.84 8.39
52.25 18.13 6.44
function (DCF). EER is the point on detection error tradeoff (DET) plot, where probability of false acceptance and probability of false rejection are equal. The DCF is computed by creating a cost function assigning some unequal weight on false alarm and false rejection followed by computation of threshold where cost function is minimum. The cost function is computed as 𝐶𝐷𝑒𝑡 = 𝐶𝑀 𝑖𝑠𝑠 × 𝑃𝑀 𝑖𝑠𝑠∣𝑇 𝑎𝑟𝑔𝑒𝑡 × 𝑃𝑇 𝑎𝑟𝑔𝑒𝑡 + 𝐶𝐹 𝑎𝑙𝑠𝑒𝐴𝑙𝑎𝑟𝑚 ×𝑃𝐹 𝑎𝑙𝑠𝑒𝐴𝑙𝑎𝑟𝑚∣𝑁 𝑜𝑛𝑇 𝑎𝑟𝑔𝑒𝑡 × (1 − 𝑃𝑇 𝑎𝑟𝑔𝑒𝑡 ), (8) DCF is calculated using the parameter value 𝐶𝑀 𝑖𝑠𝑠 = 10, 𝐶𝐹 𝑎𝑙𝑠𝑒𝐴𝑙𝑎𝑟𝑚 = 1 and 𝑃𝑡𝑎𝑟𝑔𝑒𝑡 = 0.01 for both databases NIST 2008 and NIST 2010 [31], [32]. A measurement of relative improvement of EER and DCF rate of i-vector system over GMM-UBM is calculated as 𝑅𝐼𝑇𝐸𝐸𝑅 = 𝑉
(𝐸𝐸𝑅𝑇 𝑉 − 𝐸𝐸𝑅𝑈 𝐵𝑀 ) × 100% 𝐸𝐸𝑅𝑈 𝐵𝑀
(9)
𝑅𝐼𝑇𝐷𝐶𝐹 = 𝑉
(𝐷𝐶𝐹𝑇 𝑉 − 𝐷𝐶𝐹𝑈 𝐵𝑀 ) × 100% 𝐷𝐶𝐹𝑈 𝐵𝑀
(10)
V.
R ESULTS AND D ISCUSSION
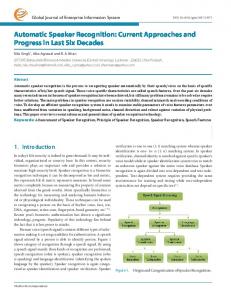
We have chosen NIST 2008 [31] and NIST 2010 [32] database to conduct the experiments as they have wide intersession and channel variability. In addition to that, they also provide a large number of speaker trials as described in Table I. We have used two different databases to show the consistency of the indications emerging from the results over databases. Table II and Table III show the results on NIST SRE 2008 and NIST SRE 2010 respectively, depicting the behavior and comparison of two systems for the different utterance duration. For the third case in Table II and Table III, training utterance is truncated to 1000 frames. The first 500 voiced frames are dropped to avoid phonetic similarity and also to ensure text independence of speech segments. This procedure is maintained for truncation in other experiments as well, of which the results are given in Table IV and V. The general trend shown by Table II and Table III is, as the utterance length decreases, significant degradation of performance occurs in both i-vector and GMM-UBM system.
The Fig. 2(a) and Fig. 4(a) show that the performance of both system degrades for reduction in duration of utterance. We also observe that the realtive improvement of TV system over GMM-UBM system degrades for shorter test segments. As these trends of results are found in 4 different SV system evaluation plan, it establishes consistency of trends of results over databases. The results of the experiments reported in Table IV and Table V exhibits a deeper comparative study. In Table IV and V, it depicts that the relative improvement 𝑅𝐼𝑇𝐸𝐸𝑅 and 𝑅𝐼𝑇𝐷𝐶𝐹 𝑉 𝑉 decreases monotonically with the reduction in utterance duration. If we go on increase the no of active frames in utterance irrespective of training and testing, the relative performance improvement of i-vector based system exhibited higher rate of over GMM-UBM system. In Fig. 2(a) and Fig. 4(a), the red lines representing i-vector performance, showed steeper curves with respect to the blue lines representing GMM-UBM system. This indicates the fact that the relative improvement of i-vector system over GMM-UBM system increases with utterance length. Figure 2(b), Fig. 4(b), Table IV and Table V supports this observation for both Full-duration training - truncated duration testing and truncated duration training - truncated duration testing condition. In Fig. 3 and Fig. 5 detection error tradeoff (DET) plots of i-vector and UBM based system are shown, which shows a deeper comparative performance study on decision threshold. DET curves are given for both Full-duration training - truncated duration testing and truncated duration training - truncated duration testing in Fig. 3 and Fig. 5 respectively. The overall result shows some relevant observations. The results from all the tables shows that i-vector based system worked significantly better than GMM-UBM for longer utterances. The results from Table II show upto 72% relative improvement of i-vector based system over GMM-UBM based system. For real-time application, SV system with very short duration with minimum complexity is desired. Both the systems’ performance fall on durations as small as 2 sec, 5 sec etc. From Table IV and Table V, we observe that in case of very short duration utterances specially in Full duration training-2 sec testing and 2 sec training-2 sec testing, GMM-UBM based system showed better performance over i-vector based system.
Table IV: NIST 2008 short 2 short 3 Results on truncated Training and Testing. Training duration
Testing duration
2 sec 5 sec 10 sec 20 sec 40 sec Full
2 sec 5 sec 10 sec 20 sec 40 sec Full
EER [%] (TV)
EER [%] (UBM)
𝐸𝐸𝑅 𝑅𝐼𝑇 [%] 𝑉
DCF × 100 (TV)
DCF × 100 (UBM)
𝐷𝐶𝐹 𝑅𝐼𝑇 [%] 𝑉
35.37 23.23 13.47 7.51 4.92 3.48
37.04 26.19 16.62 13.43 12.04 12.30
4.51 11.3 18.95 44.04 59.14 71.71
9.81 8.65 6.35 4.11 2.85 2.16
9.59 8.57 7.00 6.21 5.69 5.28
-2.24 -0.93 9.29 33.82 49.91 59.09
Table V: NIST 2008 short-2 short 3 Results on Full length Training and truncated Testing. Training duration
Testing duration
Full Full Full Full Full Full
2 sec 5 sec 10 sec 20 sec 40 sec Full
EER [%] (TV)
EER [%] (UBM)
𝐸𝐸𝑅 𝑅𝐼𝑇 [%] 𝑉
DCF × 100 (TV)
DCF × 100 (UBM)
𝐷𝐶𝐹 𝑅𝐼𝑇 [%] 𝑉
22.09 11.61 8.33 6.21 4.55 3.48
20.50 15.44 14.35 13.43 12.92 12.30
-7.76 24.81 41.95 53.76 64.78 71.71
7.79 5.43 4.14 3.22 2.73 2.16
7.57 6.22 5.81 5.55 5.52 5.28
-2.91 12.70 28.74 41.90 50.54 59.09
EER/ %
15
(a)
10 5 0 0
Relative improvement of EER/%
40
EER UBM EER TV
20
5
10
15
20
25
30
Test Utterance Duration (in sec) →
35
60 40
(b)
20 0 −20 0
5
10
15
20
25
30
Test Utterance Duration (in sec) →
35
40
Figure 2: (a) Plot of EER of i-vector system and UBM system. (b) Relative improvement of EER for full length trainingtruncated testing condition in NIST 2008, short2 short3 corpora.
False Negative Rate (FNR) [%]
False Negative Rate (FNR) [%]
10
1 0.5 0.2 0.1
10 5
10
15
20
25
30
35
Training and Test Utterance Duration (in sec) →
40
60
40
(b)
20
0 0
5
10
15
20
25
30
35
Training and Test Utterance Duration (in sec)→
40
40
20
2
(a)
20
Figure 4: (a) Plot of EER of i-vector system and UBM system. (b) Relative improvement of EER for truncated trainingtruncated testing condition in NIST 2008, short2 short3 corpora.
40
5
EER UBM EER TV
30
0 0
40
80
Relative improvement of EER/ %
EER/%
25
2s−2s UBM 2s−2s TV 5s−5s UBM 5s−5s TV 10s−10s UBM 10s−10s TV 20s−20s UBM 20s−20s TV 40s−40s UBM 40s−40s TV Full−Full UBM Full−Full TV 0.1 0.2
0.5
1
20
10
2s UBM 2s TV 5s UBM 5s TV 10s UBM 10s TV 20s UBM 20s TV 40s UBM 40s TV Full UBM Full TV
5
2 1 0.5
0.2 0.1
2
5
10
20
40
False Positive Rate (FPR) [%]
Figure 3: DET plot of i-vector (TV) system and GMM-UBM system for Full utterance duration training-truncated testing condition in NIST 2008, short2 short3 corpora.
0.1
0.2
0.5
1
2
5
10
20
40
False Positive Rate (FPR) [%]
Figure 5: DET plot of i-vector (TV) system and UBM system for truncated training - truncated testing condition in NIST 2008, short2 short3 corpora.
VI.
C ONCLUSION
The primary concern of state-of-the-art SV system is the modelling part of it. A critical comparison of factor analysis based state-of-the-art modelling method and a background model based straight-forward modelling method is presented in this work. The present study gives an indication of merits and demerits of i-vector based and GMM-UBM based system for different train-test condition. It is found that modelling speakers in total variability subspace framework exhibits a significant relative performance improvement upto 72% on long duration utterances. But, small utterance duration is desirable for a real-time SV system. Both GMM-UBM and i-vector based systems degrade severely when test utterance length falls below 10 sec. This characteristics limits the utility of SV system in real life scenario. The relative improvement measures of i-vector based system over GMM-UBM based system are also found to get reduced significantly in utterance length below 10 sec. Hence performance of the classical straight-forward GMM-UBM system is more close to i-vector based system in short duration utterance. Moreover, in case of very short utterances like 2 sec, the GMM-UBM based system has performed better over i-vector based system. ACKNOWLEDGEMENTS This work is partially supported by Indian Space Research Organization (ISRO), Government Of India. The work of the second author is also partially supported by the Academy of Finland (projects 253120 and 283256). R EFERENCES [1] T. Kinnunen and H. Li, “An overview of text-independent speaker recognition: From features to supervectors,” Speech communication 52, no. 1 (2010): 12-40. [2] J. Campbell, J. P., “Speaker recognition: A tutorial,” Proceedings of the IEEE 85, no. 9 (1997): 1437-1462. [3] S. Chakroborty and G. Saha, “Improved text-independent speaker identification using fused MFCC and IMFCC feature sets based on Gaussian filter,” International Journal of Signal Processing 5, no. 1 (2009): 11-19. [4] M. Hbert, “Text-dependent speaker recognition,” In Springer handbook of speech processing, pp. 743-762. Springer Berlin Heidelberg, 2008. [5] M. Sahidullah, and G. Saha, “Design, analysis and experimental evaluation of block based transformation in MFCC computation for speaker recognition” Speech Communication 54, no. 4 (2012): 543-565. [6] S. M. Prasanna, C. S. Gupta, and B. Yegnanarayana, “Extraction of speaker-specific excitation information from linear prediction residual of speech”, Speech Communication, vol. 48, no. 10, pp. 1243 1261 [7] F. K. Soong, A. E. Rosenberg, B. Juang and L. R. Rabiner, “Report: A vector quantization approach to speaker recognition,” AT & T technical journal 66, no. 2 (1987): 14-26. [8] S. Furui, “Cepstral analysis technique for automatic speaker verification,” IEEE Trans. Acoustics, Speech Signal Process, 1981 vol. 29 no. 2, 254272 [9] D. Reynolds and R. C. Rose, “Robust text-independent speaker identification using Gaussian mixture speaker models,” Speech and Audio Processing, IEEE Transactions on 3, no. 1 (1995): 72-83. [10] D. A. Reynolds, T. F. Quatieri, and R. B. Dunn, “Speaker verification using adapted Gaussian mixture models,” Digital signal processing 10, no. 1 (2000): 19-41. [11] W. M. Campbell, D. E. Sturim and D. A. Reynolds “Support vector machines using GMM supervectors for speaker verification,” Signal Processing Letters, IEEE 13, no. 5 (2006): 308-311.
[12] W. M. Campbell, D. E. Sturim, D. A. Reynolds and A. Solomonoff, “SVM based speaker verification using a GMM supervector kernel and NAP variability compensation,” In Acoustics, Speech and Signal Processing, 2006. ICASSP 2006 Proceedings. 2006 IEEE International Conference on, vol. 1, pp. I-I. IEEE, 2006. [13] D. Sengupta and G. Saha, “Study on Similarity among Indian Languages Using Language Verification Framework,” In Advances in Artificial Intelligence , vol. 2015, Article ID 325703, 24 pages, 2015. doi: 10.1155/2015/325703 [14] M. Pal and G. Saha, “On robustness of speech based biometric systems against voice conversion attack”, Applied Soft Computing 30 (2015): 214-228 [15] D. Paul, M. Pal and G. Saha, “ Novel Speech Features for Improved Detection of Spoofing Attacks”, In India Conference (INDICON), 2015 Annual IEEE, (Accepted) [16] P. Kenny, G. Boulianne, P. Ouellet and P. Dumouchel, “Joint factor analysis versus eigenchannels in speaker recognition,” Audio, Speech, and Language Processing, IEEE Transactions on 15, no. 4 (2007): 14351447. [17] P. Kenny, P. Ouellet, N. Dehak, V. Gupta and P. Dumouchel, “A study of interspeaker variability in speaker verification,” Audio, Speech, and Language Processing, IEEE Transactions on 16, no. 5 (2008): 980988. [18] N. Dehak, P. Kenny, R. Dehak, P. Dumouchel and P. Ouellet, “Front-end factor analysis for speaker verification,” Audio, Speech, and Language Processing, IEEE Transactions on 19, no. 4 (2011): 788-798. [19] P. Kenny, “Bayesian Speaker Verification with Heavy-Tailed Priors,” In Odyssey, p. 14. 2010. [20] A. Kanagasundaram, R. J. Vogt, D. B. Dean and S. Sridharan, “PLDA based speaker recognition on short utterances,” In The Speaker and Language Recognition Workshop (Odyssey 2012). ISCA, 2012. [21] A. Kanagasundaram, R. Vogt, D. B. Dean, S. Sridharan, and M. W. Mason. “I-vector based speaker recognition on short utterances,” In Proceedings of the 12th Annual Conference of the International Speech Communication Association, pp. 2341-2344. International Speech Communication Association (ISCA), 2011. [22] A. K. Sarkar, D. Matrouf, P. M. Bousquet and J. Bonastre, “Study of the Effect of I-vector Modeling on Short and Mismatch Utterance Duration for Speaker Verification,” In INTERSPEECH. 2012. [23] A. Kanagasundaram, D. Dean, S. Sridharan, J. Gonzalez-Dominguez, J. Gonzalez-Rodriguez, and D. Ramos, “Improving short utterance i-vector speaker verification using utterance variance modelling and compensation techniques,” Speech Communication 59, (2014): 69-82. [24] V. Hautamki, Y. Cheng, P. Rajan, and C.H. Lee, “Minimax i-vector extractor for short duration speaker verification,” In INTERSPEECH, pp. 3708-3712. 2013. [25] R. Travadi, M. V. Segbroeck and S. Narayanan, “Modified-prior i-vector estimation for language identification of short duration utterances,” In Proc. Interspeech. 2014. [26] O. Glembek, L. Burget, P. Matjka, M. Karafit and P. Kenny, “Simplification and optimization of i-vector extraction,” In Acoustics, Speech and Signal Processing (ICASSP), 2011 IEEE International Conference on, pp. 4516-4519. IEEE, 2011. [27] A. Larcher, JF. Bonastre, and J. SD. Mason, “Short utterance-based video aided speaker recognition,” In Multimedia Signal Processing, 2008 IEEE 10th Workshop on, pp. 897-901. IEEE, 2008. [28] T. Kinnunen, J. Saastamoinen, V. Hautamki, M. Vinni and P. Frnti, “Comparative evaluation of maximum a posteriori vector quantization and Gaussian mixture models in speaker verification,” Pattern Recognition Letters 30, no. 4 (2009): 341-347. [29] M. Sahidullah and G. Saha, “A novel windowing technique for efficient computation of MFCC for speaker recognition,” Signal Processing Letters, IEEE 20, no. 2 (2013): 149-152. [30] M. Sahidullah, and G. Saha, “Comparison of speech activity detection techniques for speaker recognition,” arXiv preprint arXiv:1210.0297 (2012). [31] “The NIST year 2008 speaker recognition evaluation plan”, tech.rep., NIST, April 2008 [32] “The NIST year 2010 speaker recognition evaluation plan,” tech.rep., NIST, 2010.