Informatici e Calcolo Parallelo" under grants N. 93.01592. ... under the 40% Project and by a NASA Grand Challenge Grant under the HPCC program. 1 ...
Performance Debugging on the Paragon: A Case Study
1
M. Calzarossa, L. Massari, A. Merlo, D. Tessera Dipartimento di Informatica e Sistemistica Universit�a di Pavia I-27100 PAVIA
1 Introduction A performance evaluation study constitutes the basis for various activities involving design, con guration and tuning of a computer system. In parallel environments, in particular, the evaluation of the program performance requires methods and tools which allow the programmer to observe, analyze, and visualize the behavior of the program itself. This is due to the non{deterministic behavior of the execution, which depends not only on the program structure but also on the interactions of various hardware and software components, such as, the programming paradigm and language adopted, the code optimizations achieved by means of specialized compilers, the interconnection topology of the system and the scheduling policies. Performance debugging studies, that is, the tuning of a program to a given architecture aimed at performance optimization of the code [LSVC89], [SG93], are generally based on measurement activities. Measurements generated and collected by means of monitoring tools need to be analyzed through statistical techniques, and visualized into graphical forms to highlight signi cant performance indices. The observation of program behavior requires the tracing of the events occurred (e.g., wait for a message, beginning of a communication) during its execution. This activity can generate vast amount of data, creating problems during the analysis and interpretation phases. In what follows, a performance debugging methodology is proposed and then applied to the study of a real code, with the aim of identifying possible problems leading to performance losses.
2 A methodology towards performance debugging Performance evaluation studies of parallel systems reveal very critical, in that their architectural components may play some unpredictable roles. Pro ling of the source code on sequential systems provides preliminary insights into the composition of the program in terms of the relative weights of its components (e.g., subroutines, functions, procedures). Hints about possible parallelization strategies can then be derived. However, such technique is not always applicable when studying real applications because of the requirements in terms of computation time and memory, which, sometimes, make impossible This work was supported in part by the the Italian Research Council (C.N.R.) \Progetto Finalizzato Sistemi Informatici e Calcolo Parallelo" under grants N. 93.01592.PF69 and N. 94.00409.CT12, by the Italian M.U.R.S.T. under the 40% Project and by a NASA Grand Challenge Grant under the HPCC program. 1
1
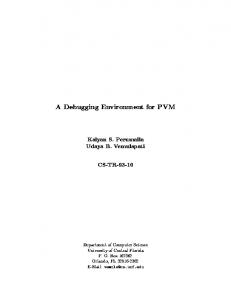
their execution on a single processor. Hence, performance debugging techniques need to be applied for understanding and explaining the behavior of the program. Its performance can be improved, for example, by identifying \critical points", such as, bottlenecks and unbalanced work distributions among the processors. \Optimal" program performance can be achieved by successive modi cations and re nements of the code. Hence, iterative steps can be recognized in every performance debugging activity. Figure 1 summarizes such steps. Instrumented source code
Parallel system
Tracing facilities
Execution
Measurements
Performance analysis and visualization
Critical points
Tuning and optimization actions
Figure 1: Phases of a performance debugging methodology. Once the source code has been manually or automatically instrumented and the program has been executed on a parallel system, a post-processing of the large amount of raw measurements has to be applied. Such phase makes the data more manageable and easily understandable by the programmer. From the events stored during the program tracing, performance metrics and statistical indices are derived [CS93]. Execution, computation and communication pro les represent, as a function of the elapsed time, the number of processors which are simultaneously active, computing or communicating, respectively. Such pro les are suitable for discovering phases in the program by showing how the execution evolves over time. For example, particular communication patterns and synchronization barriers which may be responsible of poor performance are easily identi ed by applying visualization techniques, providing an intuitive description of the analyzed phenomenon. Then, in the case of SPMD programming paradigm, the most suitable data distribution can be derived. In the case of functional parallelism, an appropriate allocation of the tasks of the program among the available processors is obtained. 2
Other information about the optimal number of processors to be used are provided by parameters, which describe the behavior of the program with respect to its parallelism. Examples of such parameters are speedup, e�ciency, e�cacy and processor working set [EZL89], [GST91]; they are computed by running the program with di�erent number of processors. Various statistical techniques can also be applied for the characterization of the measurements. Basic statistics, such as, means and standard deviations, help in discovering variabilities which may be a synonym of unbalanced conditions due to uneven work distributions. Clustering techniques can then be used for discovering similarities in the data. For example, a subdivision of the communication activities (e.g., send, receive) with respect to the parameters chosen for their characterization (e.g., number of bytes transferred, communication time) is very useful for identifying portions of the code characterized by \irregular" communication patterns. A better understanding of the program behavior is also achieved by applying, to the obtained clusters, a functional description with the aim of analyzing their composition with respect to the activities performed.
3 A case study The methodology introduced in the previous section has been applied to the analysis of a real code solving the turbulent ow problem. In what follows, brief descriptions of the analyzed code and of the programming environment adopted are provided. Finally, experimental results aimed at evaluating the performance of the code and at driving the debugging activity are presented.
3.1 Description of the application
The code under test has been developed at the University of Chicago in collaboration with the Argonne National Laboratory under a NASA Grand Challenge project. The code solves the turbulent convection and mixing problem in compressible, highly{strati ed plasmas. Finite di�erence methods and domain decomposition techniques have been applied during the implementation of the program in order to solve on parallel systems the underlying equations used to simulate the physical phenomenon. These equations model a problem of compressible hydrodynamics with the inclusion of an external gravitational force g and a temperature{dependent thermal conduction. The mathematical model is represented by the following system:
8 >< @t� + r � �u = 0 + r � �uu = ?rP + g�z + Qvisc >: @@tt�u u + u � rT + ( ? 1)T r � u = �C1 v [r � (k(T )rT )] + Hvisc
where �, u and T are the density, the velocity and the temperature of the gas, respectively; is the ratio of speci c heats and Cv is the heat capacity at constant volume; Qvisc and Hvisc represent the rates of viscous momentum dissipation and viscous heating, respectively. Four main steps can be identi ed when solving this system of equations2 : 2
More details on the physical and mathematical aspects of the problem can be found in [DMCL94].
3
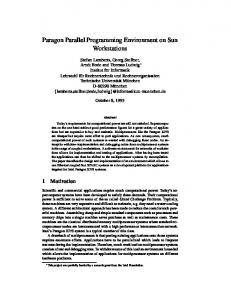
- initialization of the terms involved in the heat transfer equation; - solution of the Riemann shock tube problem by means of the higher-order Godunov method and time advancement of the uid variables; - solution of the non{linear heat conduction equation by using a multigrid method applied to the temperatures derived in the previous step; - dumping of the physical variables of the model in order to obtain a snapshot of the evolving behavior of the plasma at di�erent time steps. Note that, the fourth solution phase is very I/O intensive since at each time step several megabytes of data need to be stored. As an example, the solution of the turbulent ow problem over a grid of 1024�1024 points generates 18Mbytes of data at each time step. This huge amount of information represents a severe limitation to the overall performance of the code if non{specialized I/O routines are used. Furthermore, this phase requires a global synchronization of the processors allocated to the problem in order to obtain a physically coherent representation of the phenomenon starting from the partial data scattered on the di�erent processors. Figure 2 shows a snapshot of the model obtained for a 10 time step solution of a 1024�512 problem.
Figure 2: Temperature uctuations on a 1024�512 problem. In this gure, the convection turbulences generated in a layer of unstable gas (upper half) into a layer of stable gas (lower half) are shown. This process of convective penetration, combined with the external gravitational force, plays a fundamental role in understanding the evolution of stellar interiors.
3.2 Programming environment
The code considered in our study exploits the inherent parallelism of the application by means of an SPMD programming paradigm. The communication among the processors are handled 4
by means of a set of portable libraries, BlockComm [Grop94] and Chameleon [GS93], developed at Argonne National Laboratory. BlockComm contains routines and templates to set up the data domain decomposition and data communication patterns used when nite di�erence techniques are adopted. BlockComm, in turn, uses the lightweight message{passing package Chameleon, which translates the user{supplied communication issues to the vendor{supplied set of communication routines. Both blocking and nonblocking send and receive statements can be selected within BlockComm. Furthermore, in order to aid the performance debugging and evaluation activities, Chameleon provides the possibility of collecting detailed information on the behavior of parallel programs by means of event monitoring. The analysis of the resulting trace les (stored according to the upshot tracing format) gives insight into the obtained performance and drives the tuning of the code itself.
3.3 Hardware platform
The platform used for our experimental study has been the Intel Paragon XP/S located at IRISA. The system has a distributed{memory, wormhole{routed, mesh{connected architecture con gured with 56 computing nodes. Each node is equipped with two Intel i860 processors, namely, a Message CoProcessor for communication handling and a Computing Processor, and 16Mbytes of main memory.
3.4 Experimental results
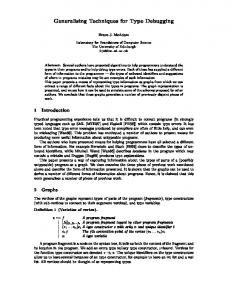
First of all, a pro ling of the program has been performed in order to discover the most computation intensive components of the code. By means of a single node execution, the weight of each component has been obtained in terms of the number of occurrences and the total time required for its execution. Note that the pro ling activity depends on the problem size, since the program uses the Jacobi relaxation iterative method when the multigrid technique is applied. For the sake of simplicity, unless otherwise stated, we will refer in the following to the analysis performed for a 512�256 problem. Figure 3 shows the results of the pro ling activity. The percentage of the time spent by the program in each routine is plotted in Fig. 3(a): The 17 \heaviest" routines, which contribute for about 67.4% of the total execution time, plus the remaining routines, denoted as \others", are shown. Another parameter derived by means of the pro ling is the number of calls to each routine (see Fig. 3(b)). This parameter, together with the above percentage, gives a more precise description of the weights of the various program components. As can be seen from Fig. 3, the \heaviest" routine is the sweep, which accounts for about 14% of the time. However, such routine has a call percentage of only 0.2%. In performance debugging studies, trade-o�s existing between these performance measures represent the key factor in understanding the behavior of the analyzed program. Indeed, a divide and conquer methodology is usually applied to the components with the largest time per call. This is the case of our application. An alternative approach is based on the redistribution of the routine calls according to their number and their time per call. 5
sweep riemann states exec_array flluid_driver interp monot iniect_r u2var intrfc coeff flaten iniect var2u init_heat prolong oper others 0
2
4
6
8
10
14
%
0
5
15
10
20
25
%
(b)
(a)
Figure 3: Percentages of the accumulated time of each component (a) and of the occurrences (b) obtained by pro ling the program on a single node. After the sequential pro ling, the program has been executed under di�erent conditions, namely, varying the number of allocated processors, the problem size, the communication types and the number of dumping phases. As already pointed out, the execution and communication activities have been monitored by means of the Chameleon facilities. The overhead due to the tracing activities accounts for less than 1% of the program elapsed time. Then, the collected measurements have been analyzed by means of the functionalities provided within MEDEA (MEasurements Description Evaluation and Analysis), a software tool developed at the University of Pavia for the evaluation and visualization of the performance of parallel programs [Merl93]. The problem has been executed on the Paragon with number of processors ranging from 1 to 32. Note that due to the domain decomposition technique adopted, the number of processor allocated to the problem has to be a power of two. The single node execution time of our problem is equal to 36 minutes on one processor. As can be observed in Fig. 4, the speedup curve for the 512�256 problem is linear up to 8 processors, then it goes down because the communication times become larger with respect to the computational counterpart. Hence, a loss in performance results. Such phenomenon is less evident if the execution times of larger size problems are considered. For example, the execution times on 16 and 32 processors, 6
respectively, for a 1024�1024 grid are 5 hours and 50 minutes and 3 hours and 57 minutes. 10
8
speedup
6
4
2
0 0 1 2
4
8
16 # of processors
32
Figure 4: Speedup curve for a 512�256 problem executed with variable number of processors on the Paragon. Figures 5 and 6 represent the communication pro les for our problem executed on four processors of the Paragon, with blocking and non-blocking communications, respectively. As can be seen, repeated communication patterns between processors can be identi ed. Furthermore, these patterns, one for each time step, presents a few asymmetries in the processor timings, in that, it is likely to nd three processors in a communication phase waiting for the fourth one. The communications activity has then been analyzed by means of statistical techniques in order to discover irregular patterns and similarities in the behavior of each processor. Mean communication times together with the corresponding standard deviations and distributions of the times spent by the various communication events have been computed.
Figure 5: Communication pro le of a 512�256 problem on a four processor partition of the Paragon with blocking communications. 7
Figure 6: Communication pro le of a 512�256 problem on a four processor partition of the Paragon with non-blocking communications. Table 1 shows basic statistics obtained when executing the code on a eight processor partition of the Paragon. Unbalanced conditions can easily be identi ed. Indeed, even and odd numbered processors present very similar behaviors. This is related to the concept of processor \leader" adopted in the code, i.e., processors which are also responsible of coordinating the activities of a few other nodes as far as synchronization controls are concerned. Such activities lead to unbalance timings and undesiderable delays in the program executions. Processor Average St. Dev. Min Max 1 0.378 5.675 0.015 465.160 2 2.293 61.171 0.015 5612.889 3 1.882 33.423 0.015 2111.845 4 2.492 60.789 0.015 5612.873 5 1.756 32.774 0.015 2111.911 6 2.366 60.439 0.015 5612.918 7 1.644 33.066 0.015 2111.901 8 2.262 60.601 0.016 5612.920 Table 1: Basic statistics of the communication times over eight processors of the Paragon. Times are expressed in ms. The clustering, applied to the 12606 communication events collected on eight processors, yields to a subdivision of the events themselves into two groups characterized by di�erent parameters, i.e., communication times. The two groups are very unbalanced either with respect to the number of events and to their timings. The rst cluster contains the most part of the events (99.7%). The second group is very small and contains events whose times are two orders of magnitude larger than the global averages. Such events refer to particular communications where the processors have to wait for each other. The functional description of this cluster supports these conclusions. In Figure 7 the distribution of the communication types belonging to this cluster is shown. As can be seen, there are only three di�erent event types, namely, 8
WRECV, GMIN, and SYNC. Note that the SYNC events are related to the dumping phase of the code. % 100.0
63.6
27.3 9.1 WRECV
GMIN
SYNC
Figure 7: Functional description of the cluster analysis applied to measurements collected on eight processors with a non-blocking communication paradigm. As already pointed out, the dumping activity has a large in uence on the program performance. For example, for the 512�256 problem, the global size of data generated during this phase is about 25 Mbytes. The overhead due to such operations, i.e., I/O time plus time spent for contentions on system resources, accounts for more than 31% of the global elapsed time. Indeed, the transfer of large amounts of data is a critical factor for the interconnection network of parallel systems, especially in the case of message{passing architectures. This heavy ow of data consumes resources on the intermediate processors because of the routing handling.
4 Conclusions Performance debugging activities are very important in the case of parallel systems since the program execution is heavily in uenced by the characteristics of the systems as well as of the program itself. Poor performance results when a program exhibits unbalanced work distributions among the processors or when communications are prevalent with respect to computation phases. Hence, a deep knowledge of such \critical" conditions can help the programmer in identifying the portions of the source code which need to be modi ed in order to improve the overall performance. Statistical analyses are used to obtain a compact description of the program behavior. Visualization methods provide a more immediate and intuitive means for understanding what happened during the program execution. These two techniques combined together have been used in a case study where a real application solving a turbulent ow problem has been examined. 9
References [CS93]
M. Calzarossa and G. Serazzi. Workload Characterization: A Survey. Proc. of the IEEE, 81(8):1136{1150, 1993.
[DMCL94] A. Dubey, A. Malagoli, F. Cattaneo, and Levine D. Portable and E�cient Parallel Algorithms for Compressible Hidrodynamics. (in preparation), 1994. [EZL89]
D.L. Eager, J. Zahorjan, and E.D. Lazowska. Speedup Versus E�ciency in Parallel Systems. IEEE Trans. on Computers, 38(3):408{423, 1989.
[Grop94]
W. Gropp. BlockComm: Data Exchange on Parallel Computers. Argonne National Laboratory, June 1994.
[GS93]
W. Gropp and B. Smith. User's manual for the Chameleon programming tools. Technical Report, Argonne National Laboratory, 1993.
[GST91]
D. Ghosal, G. Serazzi, and S.K. Tripathi. The Processor Working Set and its Use in Scheduling Multiprocessor Systems. IEEE Trans. on Software Engineering, 17(5):443{453, 1991.
[LSVC89] T. Lehr, Z. Segall, D.F. Vrsalovic, E. Caplan, A.L. Chung, and C.E. Fineman. Visualizing Performance Debugging. IEEE Computer, pages 38{51, October 1989. [Merl93]
A. Merlo. MEDEA: MEasurements Description Evaluation and Analysis tool { User's Guide Release 1.0. Technical Report R3/117, Italian C.N.R. Project, April 1993.
[SG93]
S. R. Sarukkai and D. Gannon. SIEVE: A Performance Debugging Environment for Parallel Programs. Journal of Parallel and Distributed Computing, 18:147{168, 1993.
10