Performance Evaluation in Computational Grid Environments. Liang Peng, Simon See, Yueqin Jiang*, Jie Song, Appie Stoelwinder, and Hoon Kang Neo.
Performance Evaluation in Computational Grid Environments Liang Peng, Simon See, Yueqin Jiang*, Jie Song, Appie Stoelwinder, and Hoon Kang Neo Asia Pacific Science and Technology Center, Sun Microsystems Inc. Nanyang Center for Supercomputing and Visualization, *School of Electrical and Electronics Engineering, Nanyang Technological University, 50 Nanyang Avenue, Singapore 639798 pengliang,simon,yueqin,songjie,appie,norman�@apstc.sun.com.sg Abstract
Grid computing has been developed extensive in recently years and is becoming an important platform for high performance computing in scientific areas. Grid performance evaluation is an important approach to improve the performance of Grid systems and applications. However, few work has been conducted in grid performance evaluation due to a lot of reasons like lack of appropriate grid performance metrics, complexity of the grids, etc. In this paper, we analyze the performance metrics like response time and system utilization in the computational grid environment. We argue that instead of calculating the system utilization in the traditional, a concept of relative grid utilization, which describes how close is a single grid application performance to the performance of the same application submitted without grid middleware. We also discuss the utilization for the grid systems processing a number of jobs. In our experiments, we use NPB/NGB to evaluate the APSTC cluster grid and NTU Campus Grid performance, especially the overhead of SGE and Globus. Our results show that the overhead of grid middleware turns to be ignorable when the job size grows, and the characteristics of the grid applications affect a lot on utilization of computational grids. Keywords: Grid computing, Performance evaluation, Benchmarking, Response time, System utilization
1. Introduction With the popularity of computational grids in scientific high performance computing, it is more and more desirable to provide widely acceptable approach to evaluate performance of the grid systems and applications. Although the grid architecture/middleware has been developed extensively in recently, the existing systems are not well understood by grid users and this is heavily because of the lack of performance evaluation results for them. One of the problem in grid performance evaluation/benchmarking is the performance metrics. There is no widely used performance metrics for computational grid environment. This is due to the high complexity and dynamism nature of the grids. In this paper, we try to present some analysis on the grid performance metrics (mainly the response time and the system utilization). Benchmarking is a typical way to test and evaluate the performance of a grid system. A grid benchmark enables one to compare the capabilities of a grid system to those of another system in order to find out the features and the ways to improve it. However, currently few benchmark suites have been developed and widely used, which results in an obstacle to better understanding and wider acceptance of the grids. NGB (NAS Grid Benchmarks) [9] is a recently proposed Grid benchmarks based on widely used NAS Parallel Benchmarks. In this paper, we introduce the organization of our Sun cluster grid and NTU (Nanyang Technological University) Campus Grid [4], which an established and running grid computing environment. The performance evaluation results by using NGB is also presented. In our experiments, We mainly focus on the turnaround
Proceedings of the Seventh International Conference on High Performance Computing and Grid in Asia Pacific Region (HPCAsia’04) 0-7695-2138-X/04 $ 20.00 IEEE
time and CPU utilization of the cluster grid. Our results shows that the overhead of SGE and Globus middleware is negligible especially for bigger problem sizes. Meanwhile, the NGB results show very low resource utilization, and this implies the traditional system utilization may not be suitable for grids and relative grid utilization could be a better metric. The remainder of this paper is organized as follows: In Section 2 we analyze some performance metrics in computational environments; Section 3 describes the Sun Grid Engine as a grid computing middleware. Section 4 introduces NGB benchmark suite. The experimental results are presented and analyzed in Section 5. Some related work are introduced in Section 6 and finally we give a conclusion in Section 7.
2. Grid Performance Metrics There are very few performance metrics particularly defined for computational grids. In traditional parallel computing, response time (or turnaround time) is a major concern of user, and system utilization is an important metric from the perspective of system engineers/administrators. In computational grid environment, although sometimes users submit job to grid because of the reasons other than speedup, response time still remains an important factor in consideration. For a single grid job, response time can be defined as �� �� is the time when the job is ������ , where finished, and ������ is the time when the job is submitted to the system. For a number of jobs, sometimes we also use average response time, which can be calculated as � �� ������ ���, where N is the total number of submitted jobs. In traditional parallel computing, the system utilization can be computed as the ratio of the achieved speed to the peak speed of a given computer system. With this definition, the system utilization is usually very low (typically ranging from 4% to 20% ( [13]). This concept can also be applied to computational grid environment, but it can be expected that the system utilization could be even lower. Therefore, for single grid job, we find it more appropriate to define the relative grid utilization based on the traditional parallel system resource utilization: (system utilization of grid job submission)/(system utilization of parallel job submission). This concept reveals how close is the grid application to parallel execution on the same machines, instead of calculate the ”absolute” value of utilization. Since applications run-
ning on computation grid environment is supposed to have more overhead and is expected to be slower, we can treat the corresponding parallel system as the upper bound of the application. Another way to measure grid utilization is calculating the overall ratio of consumed CPU cycles and the available computational resources defined in [16], i.e. the grid efficiency. With the consideration of multiple components within single grid job, an improved definition of grid utilization is presented as follows:
� �
�
� ��� �� ���� ��
��
�
����
��� � ���� ��
��
��������
� � �
� � �� �� ��
� ��
(1)
where �� is the time when the job is finished, and ��� is the time when the job is submitted, � is the speed of � th CPU where component � is running, and � � is the total number of CPUs on � th server.
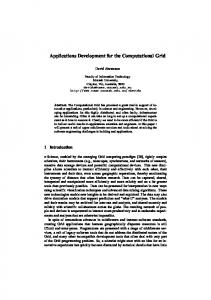
3. Cluster Grid and NTU Campus Grid The cluster grids are the simplest form of a grid which can be used to compose higher logical level enterprise/Campus grids and global grids. The key benefit of cluster grid architecture is to maximize the use of compute resource and increase throughput for user jobs. The cluster grid architecture can be divided into three non-hierarchical logical tiers: Access tier, Management tier, and Compute Tier. The access layer provides the means to access the cluster grid for job submission, administration and so on. The management layer provides the major cluster grid services such as job management, monitoring, NFS, etc. The computer layer provides the compute power for the cluster grid, and supports the runtime environments for user applications. The performance of higher level grids largely relies on that of lower level grids. In order to evaluate the performance of the enterprise/campus level grids, classifying performance of cluster grid is necessary and meaningful. The cluster grid in APSTC is a part of NTU campus grid, which consists of multiple cluster grids running SGE/Globus at different schools and the whole campus grid is managed by ClearingHouse. The cluster grid of APSTC is illustrated in Figure 1. APSTC cluster grid consists of two Sun Fire V880 servers (totally twelve CPUs) with Sun Grid Engine (SGE). One server is the master host, and both servers are submission host and execution host.
Proceedings of the Seventh International Conference on High Performance Computing and Grid in Asia Pacific Region (HPCAsia’04) 0-7695-2138-X/04 $ 20.00 IEEE
To NTU Campus Grid
APSTC Cluster Grid
Sun Blade 150 System Login Host SGE submit Host
Access tier
Sun Fire V880 server
Management Tier
Compute Tier SGE master 4 CPUs
Sun Fire V880 server 8 CPUs
Figure 1. The APSTC Cluster Grid Organization.
tion, we use NGB to do a performance evaluation on our cluster grid. The cluster grids in the NTU campus grid can run SGE or Globus, or both. In our scenario, when jobs are submitted from NTU campus grid ClearingHouse portal, it is forwarded to the local Globus gatekeeper and handled by Globus. Another approach is to integrate Globus with local SGE. But we do not use this mixed approach in our experiments in order to separate their individual effects on performance. A demonstration is shown in Figure 3. In this senario, when jobs are submitted from ClearingHouse client, it is sent to the ClearingHouse Server. The ClearingHouse server will record some relative information in local database and then forward the job request to the user-selected cluster grid, which is handled by its local Globus gatekeeper. There will be some procedure like user account mapping, CA checking, etc. Finally the job will be executed there.
4. NAS Grid/Parallel Benchmarks 4.1 Grid Benchmarking
The SGE distributed resource management (DRM) software is the core component of the Sun Cluster Grid software stack. It provides the DRM functions such as batch queuing, load balancing, job accounting statistics, user-specifiable resources, suspending and resuming jobs, and cluster-wide resources. The procedure of job flow in Sun Grid Engine is illustrated in Figure 2. In this job flow, each step may result in extra overhead
A benchmark is a performance testing program that is supposed to capture processing and data movement characteristics of a class of applications. In performance benchmarking, selection of benchmark suite is critical. The benchmark suite should be able to test the affecting factors in the system and results should reveal the characteristics of the systems reasonably. Strictly speaking, there is no complete grid benchmarks existing for grid platforms like the parallel benchmarks for parallel computing systems, mainly because of the inherent complexity of the grids. Grid benchmarks should take into account more factors which are related to the grid environment but are not major considerations in traditional high performance computing system. For example, the grid benchmark designers may need to think about the various types of grid jobs which may possibly consists of multiple applications running over wide area networks.
4.2 NAS Grid Benchmarks Figure 2. The job flow in SGE.
in job submission and execution. In order to give a brief overview of the overhead as well as the resource utiliza-
NGB (NAS Grid Benchmarks) [9] is a recently proposed benchmark suite for grid computing. It is evolved from NPB (NAS Parallel Benchmarks) [6], which was designed and widely used for performance benchmarking on parallel computing systems.
Proceedings of the Seventh International Conference on High Performance Computing and Grid in Asia Pacific Region (HPCAsia’04) 0-7695-2138-X/04 $ 20.00 IEEE
ClearingHouse Client
ClearingHouse Server
To outer computing resources
Genome Institute of Singapore
......
Institute of HPC
Globus Gatekeeper
Cluster Grid
Cluster Grid
Globus Gatekeeper
record
database retrieve
...
Globus Gatekeeper
Account Mapping Cluster Grid
CA Checking
Cluster Grid
JOb Execution
Cluster Grid
Campus Grid Figure 3. The job flow in NTU Campus Grid (with ClearingHouse and Globus).
In NPB, the are eight benchmarks (i.e. BT, CG, EP, FT, IS, LU, MG, SP) on behalf of various type of scientific computation (for more details please refer to [6]). In current NGB, there are four problems representing four different typical classes of grid applications:
¯ Embarrassingly Distributed (ED) represents a class of applications which execute same program for multiple times with different parameters. In ED, the SP program, which is selected from NPB, is executed for several times depending on the problem size. There is no data exchange between each execution of SP, so it is very loosely coupled. ¯ Helical Chain (HC) stands for long chains of processes which are executed repeatedly. Three programs, BT, SP, and LU, are selected from NPB. During execution, the output of one program is fed into another, and these procedure repeats for sev-
eral times.
¯ Visualization Pipeline (VP) consists of three NPB programs: BT, MG, and FT, which fulfill the role of flow solver, post processor, and visualization module respectively. This triplet simulates a logically pipelined process. ¯ Mixed Bag (MB) is similar to VP except that it introduces asymmetry. In MB, different volumes of data are transferred between different tasks and the workload of some tasks may be more than the others. NGB contains computation-intensive programs and it mainly addresses grid computing system’s ability to execute distributed communicating processes. It does not specify how to implement or choose other grid computing components such as scheduling, grid resource allo-
Proceedings of the Seventh International Conference on High Performance Computing and Grid in Asia Pacific Region (HPCAsia’04) 0-7695-2138-X/04 $ 20.00 IEEE
cation, security, etc.
5. Experimental Results 5.1 Testbed and Workloads Our benchmarking is performed on APSTC cluster grid, which consists of a four UltraSPARC III CPU (900MHz, 8GB memory) node (hostname: sinope) and an eight UltraSPARC III CPU (750MHz, 32GB Memory) node (hostname: ananke). They all run Solaris 9 with Sun Grid Engine 5.3p4 and Globus toolkit 2.4. All NGB benchmarks are compiled with JDK1.4. The jobs can be either submitted to the cluster grid locally, or submitted from the NTU campus grid ClearingHouse portal. We use NPB programs to simulate the workload of NTU campus grid. Specifically, we use all the eight benchmarks in NPB suit with problem sizes S, W, A, and B. The jobs that require relatively short CPU time (S size) take 10% of the total number of jobs; the jobs that require relative long CPU time (B size) also take 10% of the total number of jobs. The rest 80% of the jobs evenly consists of W and A size jobs. We submit totally 100 jobs in each simulation. The jobs distribution is the Poisson distribution, and the arrival rate is 0.04 (i.e. in average one job is submitted every 25 seconds).
5.2 Turnaround Time First we measure the turnaround time and grid middleware overhead for the single NGB benchmarking programs. Table 1 gives the timing results of execution on sinope server (i.e. the master host). The percentage of the overhead are shown in Figure 4. When the problem size is relatively small, the SGE overhead is significant comparing with the execution time (5.47 seconds out of 15.73 seconds for ED/S, 10.67 out of 23.46 seconds for HC/S, 7.71 out of 21.14 seconds for MB/S, and 9.79 out of 26.73 seconds for VP/S). However, generally this overhead is not greatly increased when the problem size is increased. For the bigger size problem (W size) execution on the same server, in which case the system overhead only takes a very small percentages (11.84 seconds out of 674 seconds for ED/W, 11.76 seconds out of 1031 seconds for HC/W, 14.13 seconds out of 907 seconds for MB/W, and 4.61 seconds out of 148 seconds for VP/W). For the bigger size problem (A size for ED and HC) execution on the same server, in which case the
Figure 4. The percentage of grid middleware overhead with NGB (on one server).
system overhead takes even smaller percentages (14.79 seconds out of 3996 seconds for ED/A, and 34.11 seconds out of 7213 seconds for HC/A). We also evaluate the system by utilizing both of the two servers, in which case the number of CPUs is larger than the number of tasks. Table 2 shows the results of execution with S problem The percentage of the overhead are shown in Figure 5. We can see that the situation of system overhead on two servers are roughly the same as that on one server: the overhead of small problem size is significant, but when the problem size increases, it turns to be negligible since the overall execution time increase much faster. Depending on the characteristics of particular benchmarks, the increase of the number of CPU may have different effects on the execution time. We found that all benchmarks except ED run for more time on two servers than on one server. ED takes less time to finish on two servers. This is mainly because ED represents for very loosely coupled applications, and there is very few or even no data communication between the tasks. When the number of CPUs increased to be larger than the number of tasks, the execution time decreases. However, for HC, MB, and VP, there are data communications between tasks. Some of their tasks can run in parallel and some others depend on the others. In this case, the network bandwidth limit the execution speed. Figure 4 shows that the percentages of the overhead in turnaround time decrease very fast when the problem sizes increase.
Proceedings of the Seventh International Conference on High Performance Computing and Grid in Asia Pacific Region (HPCAsia’04) 0-7695-2138-X/04 $ 20.00 IEEE
Benchmarks and Problems size S (w/o middleware) S (with SGE) W (w/o middleware) W (with SGE) A (w/o middleware) A (with SGE)
ED 10.259 15.733 662 674 3981.49 3996.28
HC 12.791 23.459 1019 1031 7179.74 7213.85
MB 13.437 21.144 892 907 -
VP 16.941 26.734 143 148 -
Table 1. Timing of NGB benchmarks on single server (in Seconds). Benchmarks and Problems size S (w/o middleware) S (with SGE) S (with Globus) W (w/o middleware) W (with SGE) W (with Globus) A (w/o middleware) A (with SGE)
ED 7.192 13.194 23.24 358.584 374 390 2304.29 2302
HC 15.367 22.984 31.36 1301.084 1306 1316 9197.77 9240
MB 18.34 26.162 33.39 1272.787 1283 1290 -
VP 19.526 25.532 33.31 181.99 197 203 -
Table 2. Timing of NGB benchmarks on two servers (in Seconds).
The SGE overhead and Globus overhead are also compared with the benchmarks running on both of the two servers Figure 5. The globus has more overhead for all cases: With S size problem, the SGE overheads are 6.00, 7.62, 7.82, and 6.01 seconds in comparison with 16.05, 15.99, 15.05, and 13.78 seconds of Globus overhead for ED, HC, MB, and VP benchmarks respectively. With W size problem, the SGE overheads are about 15, 4, 10, and 15 seconds in comparison with 31, 14, 17, and 21 seconds of Globus overhead for ED, HC, MB, and VP benchmarks respectively. This is partially because it does more operations like account mapping, authentication checking, MDS services, etc. However, when the problem size grows, the overhead of Globus also becomes negligible.
Figure 5. The percentage of grid middleware overhead with NGB (on two servers.
In order to test the performance of processing multiple job submission, we use NPB benchmarks to simulate the NTU campus grid workloads for SGE running on the cluster grid. The average response times of the NPB jobs are listed in Table 3. According to the description in Section 2, we can calculate the overall average response time is 330.42 seconds.
Proceedings of the Seventh International Conference on High Performance Computing and Grid in Asia Pacific Region (HPCAsia’04) 0-7695-2138-X/04 $ 20.00 IEEE
Benchmarks/Problems size BT CG EP FT IS LU MG SP
S 0.99 1.015 3.798 0.809 0.047 0.238 0.094 0.291
W 22.90 2.91 7.54 2.27 0.75 40.76 2.055 42.81
A 697.93 16.05 61.88 39.87 10.52 392.41 26.90 385.32
B 2686.75 1009.82 276.42 598.30 57.04 2320.83 93.48 1770.77
Table 3. Average Response Times of NPB Benchmarks (in Seconds). Benchmarks/Problems size S S (relative grid utilization) W W (relative grid utilization)
ED 0.189% 65.2% 0.0348% 98.3%
HC 0.229% 54.5% 0.049% 98.8%
MB 0.191% 63.5% 0.045% 98.4%
VP 0.268% 63.3% 0.461% 96.9%
Table 4. Utilization of the cluster grid.
5.3 Resource Utilization Resource utilization is another major concern in grid computing. At this moment, we mainly consider the CPU utilization. Table 4 shows resource utilization of the NGB on our cluster grid. We calculate the CPU utilization by dividing the performance of the benchmarks (in MFlop) by theoretical peak performance. In our experiments, the CPU utilizations in all cases are very low (far less than 1%). The low utilization of the cluster grid reveals that the traditional utilization metric may not be appropriate for grids. So in Table 4, we also show the relative grid utilizations which are calculated according to the description in Section 2.
6. Related Work In computational grid benchmarking, few results has been published although a lot work has been done in performance evaluation [14] and benchmarking [10] for traditional high performance systems. The most recently work include grid job superscheduler architecture and performance in computational grid environments by Shan et al. [16]. In their work they propose several different policies for superschedulers and use both real and synthetic workloads in simulation to evaluation the performance of the superschedulers.
They also present several grid performance metrics including response time and grid efficiency. But the their definition of grid efficiency does not consider the situation where the sub-jobs within a single job are computed on different servers (with different CPU speeds), and this concept is improved in our work. There is a working group in GGF [2] working on grid benchmarking, but so far no detailed results have been published or declared. There is also a grid performance working group in GGF and they proposed a grid monitoring architecture [17] as well as a simple case study [5]. They mainly use a producer-consumer model to define the relationship between the nodes. Their architecture is more or less a specification of the required functionality in grid monitoring, and they adopt a model consists of producer, which generates and provides the monitoring data, consumer, which receives the monitoring data, and directory service, which is responsible for maintaining the control information or meta-data. They pose many design issues and problems need to be considered but without in-depth description of solutions, and currently it has not be implemented. The producer-consumer-directory service architecture mainly describes the scenario of how the performance can be monitored. But it is basically a simplified specification and many important open issues (like scalability, performance, etc) are not addressed.
Proceedings of the Seventh International Conference on High Performance Computing and Grid in Asia Pacific Region (HPCAsia’04) 0-7695-2138-X/04 $ 20.00 IEEE
Some initiative work has been done by NASA people based on NAS Grid benchmarks [9, 6, 11]. They also did some work on tools and techniques for measuring and improving grid performance [7]. Hamscher et al. tried to evaluate grid job scheduling strategies [12] with a simulation environment based on discrete event simulation instead of running benchmarks or applications on grids. Their performance metrics are also common criteria like average response-time and utilization of the machines. GridBench [3] is a tool for benchmarking grids and it is a subproject of CrossGrid [1]. GridBench provides a framework for the user to run the benchmarks on grid environments by providing functions like job submission, benchmarking results collection, archiving and publishing. Although some traditional benchmark suites (like Linpack, NPB, etc) are revised and included by GridBench, currently it is mainly focused on providing the portal and environment for users instead of developing benchmarking applications. The GridBench people also discuss the grid benchmark metrics, but so far no novel metrics are proposed and measured. There are also some benchmark probes for Grid assessment done by Chun et al. [8]. They developed a set of probes that exercise basic grid operations by simulating simple grid applications. Their probes fall into the low level measurement on basic grid operations such as file transfers, remote execution, and queries to Grid Information Services. The collected data include compute times, network transfer times, and Globus middleware overhead. They also declare that they are focusing on data-intensive benchmarks based on applications in domains such as bio-informatics or physics. Basically their problems are rather simple. They mainly measure the performance of pipelined applications which transfer a large volume of data from database node to compute node and transfers the result file to the results node. The real data grid situation can be much more complex and more sophisticated models are needed. Performance forecasting in metacomputing environment also has been explored in FAST system [15] by Quinson et al. The FAST system heavily relies on the Wolski et al.’s Network Weather Service [18]. It also provides routine benchmarking to test the target system’s performance in executing the standard routines so that a prediction can be made on these results.
7. Conclusion In this paper we present some preliminary analysis on grid performance metrics and show some experimental results of using NGB/NPB to evaluation the APSTC cluster grid and NTU Campus Grid. Our experiments with NGB show that the grid middleware overhead can become negligible for large size grid applications. We also show that Traditional resource utilization may not be appropriate for computations grids and relative grid utilization could be a more suitable metric. Our work is a part of the campus grid performance evaluation and it is still ongoing. Our future work include deeper analysis of the NGB on grids, the performance evaluation of the whole campus grid, defining new performance metrics to describe and measure the character of the grids, and development of new benchmarks representing other class and areas of grid applications.
8. Acknowledgement We thank NTU campus grid team members (Prof. Lee, Hee Khiang) for providing us the relative information about the campus grid and their cooperation for our work.
References [1] CrossGrid. http://www.cs.ucy.ac.cy/crossgrid/. [2] GGF Grid Benchmarking. http://forge.gridforum.org/projects/gb-rg. [3] GridBench. http://www2.cs.ucy.ac.cy/ georget/gridb/gridb.html. [4] NTU Campus Grid. http://ntu-cg.ntu.edu.sg/. [5] A. Aydt, D. Gunter, W. Smith, B. Tierney, and V. Taylor. A Siimple Case Study of a Grid Performance system. Technical Report GWD-Perf-9-3, GGF Performance Working Group, 2002. http://www-didc.lbl.gov/GGFPERF/GMA-WG/papers/GWD-GP-9-3.pdf. [6] D. Bailey, E. Barscz, J. Barton, D. Browning, R. Carter, L. Dagum, R. Fatoohi, S. Fineberg, P. Frederickson, T. Lasinski, R. Schreiber, H. Simon, V. Venkatakrishnan, and S. Weeratunga. The NAS Parallel Benchmarks. Technical Report NAS-94-007, NASA Advanced Supercomputing (NAS) Division, NASA Ames Research Center, 1994. [7] R. Biswas, M. Frumkin, W. Smith, and R. V. der Wijngaart. Tools and Techniques for Measuring and Improving Grid Performance. In IWDC2002, LNCS 2571, pages 45–54, 2002.
Proceedings of the Seventh International Conference on High Performance Computing and Grid in Asia Pacific Region (HPCAsia’04) 0-7695-2138-X/04 $ 20.00 IEEE
[8] G. Chun, H. Dail, H. Casanova, and A. Snavely. Benchmark Probes for Grid Assessment. Technical Report CS2003-0760, UCSD, 2002. http://grail.sdsc.edu/projects/grasp/publications.html. [9] R. F. V. der Wijngaart and M. Frumkin. NAS Grid Benchmarks Version 1.0. Technical Report NAS-02005, NASA Advanced Supercomputing (NAS) Division, NASA Ames Research Center, 2002. [10] R. Eigenmann. Performance Evaluation And Benchmarking with Realistic Applications. The MIT Press, 2001. [11] M. A. Frumkin, M. Schultz, H. Jin, and J. Yan. Performance and Scalability of the NAS Parallel Benchmarks in Java. In the International Parallel and Distributed Processing Symposium (IPDPS’03), 2003. [12] V. Hamscher, U. Schwiegelshohn, A. Streit, and R. Yahyapour. Evaluation of Job-Scheduling Strategies for Grid Computing. Lecture Notes in Computer Science, 1971:191–202, 2000. [13] K. Hwang and Z. Xu. Scalable Parallel Computing. McGraw-Hill, 1998. [14] R. Jain. The Art of Computer Systems Performance Analysis. WILEY, 1992. [15] M. Quinson. Dynamic Performance Forecasting for Network-Enabled Servers in a Metacomputing Environment. In International Workshop on Performance Modeling, Evaluation, and Optimization of Parallel and Distributed Systems (PMEO-PDS02), Apr. 2002. [16] H. Shan, L. Oliker, and R. Biswas. Job Superscheduler Architecture and Performance in Computational Grid Environments. In the Proceedings of ACM Super Computing 2003, 2003. [17] B. Tierney, R. Aydt, D. Gunter, W. Smith, M. Swany, V. Taylor, and R. Wolski. A Grid Monitoring Architecture. Technical Report GWD-Perf-16-3, GGF Performance Working Group, 2002. http://wwwdidc.lbl.gov/GGF-PERF/GMA-WG/papers/GWD-GP16-3.pdf. [18] R. Wolski, N. T. Spring, and J. Hayes. The Network Weather Service: A Distributed Resource Performance Forecasting Service for Metacomputing. Future Generation Copmuting systems, Metacomputing Issue, 15(56):757–768, Oct. 1999.
Proceedings of the Seventh International Conference on High Performance Computing and Grid in Asia Pacific Region (HPCAsia’04) 0-7695-2138-X/04 $ 20.00 IEEE