Automated Teller Machine (ATM) has become a fundamental part of banking world-wide as ... fuzzy TOPSIS model for ranking service quality criterions of ATMs.
International Journal of Business and Social Science
Vol. 5, No. 13; December 2014
Performance Evaluation of Automated Teller Machine (ATM) with Fuzzy TOPSIS Using Sample Survey Results Yousaf Shad Muhammad Sadia Aslam Nouman Afgan Azhar Mehmood Abbasi Department of Statistics Quaid-i-Azam University Islamabad Abstract The aim of this study is to propose a fuzzy multi-criterion decision model (MCDM) to evaluate the performance of ATMs of larger Pakistani banks. For this purpose six banks of Pakistani banking sector are examined and evaluated their quality performance in terms of cost-benefit criterions or factors of ATM facility. Fuzzy Technique for order performance by similarity to ideal solution (TOPSIS) is incorporated in the proposed model. Important factors of service quality are evaluated, ranked and graphically depicted. As customer’s satisfaction represents a modern approach for quality in different business organizations, so in this study, we transform the decision maker’s responses into direct customer’s responses. Bank’s performance may be evaluated in relation to a set of satisfaction factors that indicates the weak and strong points of business organizations. For this purpose we introduce the survey technique to collect the data of customer’s. The study provides important results for development of banking sector.
Keywords: Performance evaluation, Multi-criterion decisions, Fuzzy,TOPSIS and Closeness Coefficient 1. Introduction Automated Teller Machine (ATM) has become a fundamental part of banking world-wide as it is the easiest way for monetary transaction(s). There is a wide range of banks providing services of ATM by installation of ATM machines not only in their premises but off-premises-public locations. There are five main dimensions of ATM service as follows: (a) Reliability: It relates to the accuracy, speed and 24 hours service.(b)Tangibles: Must focus on the physical appearance of service (interior/exterior, decoration etc.)(c) Responsiveness: It is totally related to the bank and their staff’s providing the ATMs services that how they respond to help the customer when they face the problems of card blocking/locking, machines break downs etc. (d) Assurance: It reflects the experience and knowledge of staff to overcome the technical problems. (e) Empathy: It is the judgment aspect of the customers of the banks providing the ATMs services. All these dimensions integrate different factors of ATMs service quality. Neat and clean machines, user friendly, conveniently located, 24 hour service, correct and clear guidance machine, interbank transfer, technologically updated, quick operation machine, sufficient number of ATMs machines, waiting time, per day limit of cash withdrawal, awareness of fee charges, availability of different facilities (payment of bills), all time availability of cash, flexibility, machines breakdown and safe and secure machine etc. Different researchers set up experimental studies for service quality of ATM’s taking some of the above mentioned service quality criterions. For instance, Al-Hawari et al. (2006)studiedfive aspects of ATM i.e. user friendliness of the systems, procedures, secured, convenient locations and adequate number of ATM’s. Shamsdouha et al. (2005) analyzed three service quality factors of ATM which areconvenient locations, 24 hour service and accuracy. Joseph and Stone (2003) studied the factors: user friendly, easy access to location and security that influenced the perception of customers towards the Service Quality of ATMs.Islam et al. (2005) examined level of satisfaction of ATM card holders of a top Bangladeshi bank (HBSC) by fuzzy TOPSIS. 216
© Center for Promoting Ideas, USA
www.ijbssnet.com
Sun and Lin (2009) used fuzzy TOPSIS method for evaluating the competitive advantage shopping websites to select the best alternate based on 12 different criteria. Ashrafzadeh (2012) used fuzzy TOPSIS method for selection of warehouse location. Semih et.al (2009) selected shipping center site in Istanbul using combined model of fuzzy Analytical Hierarchy Process(AHP) and fuzzy TOPSIS model. In this study we incorporated fuzzy TOPSIS model for ranking service quality criterions of ATMs. In this study we incorporated all these factors of ATMs Service Quality,analyzeand prioritizethem,using Fuzzy TOPSIS methodology. The remaining paper is organized as follows: Fuzzy TOPSIS algorithm discussed in section 2, Data collection methodology is discussed in Section 3, Results obtained using Fuzzy TOPSIS algorithm in Section4 and finally we summarized the results in Section 5.
2. Fuzzy Topsis Algorithm Chen (2000) proposed the following algorithm of Fuzzy TOPSIS: Step 1: firstly, decision maker’s team is formed. The team has K decision makers,fuzzy rating of each decision maker DK for (k = 1, 2…k) can be represented by triangular/quadrilateral fuzzy numbers such as ( x) xk k 1, 2,...k with membership function k Step 2: Criteria evaluation is determined. Step 3: Choose the appropriate linguistic variables for importance weight of criteria and linguistic ratings for alternatives w.r.t criteria. Step 4: Aggregate the performance rating of each alternatives and criteria weights as follows: 1 w j = k
w j,1 + w j,2 + ...w j,k
1 1 2 k x = x +xij +...+x ij ij k ij
Where x ij and w j are aggregated performance rating of each alternative and criteria weight, respectively. Step 5: Construct fuzzy decision matrix
D
xij with ‘n’ criterions and‘m’ alternatives for K decision makers. m*n
Step 6: Normalize the decision matrix. The normalization matrix of fuzzy decision R͂͂ shownas follows: R͂͂= [rij] m*n , i = 1, 2. . .m andj = 1, 2,. . . ,n
C1 r1,1
Cj
A1 r1, j A ri ,1 ri , j R͂= i Am rm,1 rm, j
Cn r1,n ri ,n rm,n
Here, alternative Ai , i 1, 2, ..., m , criterion C j , j 1, 2, ..., n and rijareelement of normalized decision matrix. The normalization aim isdual i.e. It ensures that all triangular fuzzy numbers are in range within interval [0, 1]. To compare heterogeneous criteria, the normalization is necessary. In the process of normalization, different equations have to be applied to cost criteria and benefit criteria. The normalization is as follows; rij =
x ij c
+ j
=
a xij b xij c xij + ; + ; + j∈B cj cj cj (3.1)
Where c j max(c xij ) i 1,....,m B , and B represents the benefit criteria
217
International Journal of Business and Social Science a r = ij
j
x ij
Vol. 5, No. 13; December 2014
a -j a -j a -j = ; ; j ∈ C c x ij b xij a xij (3.2)
Where a j min(axij ) i 1,...., m C ,
and C represents the cost criteria
Step 7:Compute the weighted normalized decision matrix. For this purpose, firstly, consider the different weights of each criterion,then multiplying the normalized decision matrix with weight of criteria evaluation.V͂ is denoted as weighted normalized decision matrix. V͂= [ vij ]m*ni= 1,2......m; j= 1,2.......n
V=
C1
Cj
Cn
A1
v1,1
v1, j
v1,n
Ai
vi ,1
vi , j
vi ,n
Am
vm,1
vm, j
vm,n
i 1 , . . ., m j 1 , . . ., n (3.3) Where vij = rij * w j fuzzy normalized number ranges in [0, 1]. Step 8:Determine the fuzzy positive ideal solution A and fuzzy negative ideal solution A . After normalization, we know that each element v ij of fuzzyweighted normalize matrix lies within the interval [0, 1], so the formulae
defined for fuzzy positive ideal solution and fuzzy negative ideal solution are as follows:
A v1 ,v2 ,...,v j
A v1 ,v2 ,...,v j , Where
v j =max vij for Band min vij for C
, Where v j =min vij for Band max vij for C
Or simply it can be defined as:
A v1 ,v2 ,...,v j
, A v1 ,v2 ,...,v j (3.4)
Where v j 1,1,1
,
v j 0,0,0 ,
j= 1, 2, …,n
Step 9: Compute the n-dimensional separation distances of each criterion j=1, 2… m to fuzzy positive-ideal solution A+and fuzzy negative-ideal solutionA-.
d d d
m
j
d ( v ij , v j ) ;
j
d ( v ij ; v j ) ;i= 1, 2 ...m;
j
i1 m
i1
i= 1, 2 ...m;
j=1, 2 ...n(3.5)
j=1, 2 ...n
(3.6)
R , d j R
Where d j is separation distances from positive-ideal solution and d j is separation distances from negative-ideal solution respectively.
218
© Center for Promoting Ideas, USA
www.ijbssnet.com
Step 10: Calculate the relative ‘closeness index’ of each alternatives or criterion by using;
Cj
dj
dj dj
(3.7)
Where C j [0,1] is closeness index The value of closeness index close to 1 gives the optimal alternativeor criteria. Closeness coefficient determined the ranking of alternatives. Such that the coefficient having value nearer to 1 is ranked high while value far from 1 ranked lowest.
3. Data Collection Survey In this study survey was conducted to collect the opinions of ATM users and service provider of ATM for the ATM’s Service Quality factors. For this purpose, we selected the six ATMs booths of different banks of Islamabad, the capital city of Pakistan. The findings of the study, research involves the use of questionnaire as well as structured interviews. The questionnaire was distributed using convenience sampling as well as judgmental sampling technique to a number of ATM users and to staff that are the responsible of operations of ATMs in each six banks. Convenience sampling is the type of sampling in which the sample is selected such that it is convenient to take because it is easy to use when the factor is time, location and cost. Whereas, in judgmental sampling, the sample is selected on the basis of the survey conductor (enumerator),because this is claimed that enumerator knows the units in the population. So they can determine that which unit should be included in the sample and which not. The managerial charge of ATM operations of each selected bank was targeted for the criterions weights. 3.1 Sample Size Since the population is large sowe used the convenience/accidental sampling as well as judgmental sampling. As for qualitative research the start of sample size is typically considered to be small. So we considered the sample of 100 customers and 6 representatives from the banks. Then we divided the samples of 100 customers into subsamples and each sub-sample contained different number of customers. For the alternatives rating, data was collected by the ATM customers. But for the criterion weights data was collected from the management of each selected bank. 3.2 Data Source and Data Collection Tool For studying and investigation of Service Quality, different researchers have used different methods to collect the data. These methods include interview studies, experimental studies, literature review and observational studies. In this study, primary data was collected through questionnaire (see Appendix.1) from six ATM booths of selected banks. 3.3 Data Organization We collected the opinions of customers from the 6 ATMs of different banks. Then we separated the data. In the next step, each service quality factor was chosen separately as a mode from each ATMs data (Appendix.1). Then we combined all the modes of each service quality factor for alternative rating and converted into linguistic variables. The responses from banks management are also obtained and converted into linguistic variables (Appendix.3).
4. Analysis of Data by Fuzzy TopsisAlgorithm We consider the 17 factors (as indicated above) of service quality as criterions and responses of customers to 6 ATMs machines from different banks as an Alternatives in fuzzy TOPSIS, namely as A1, A2, A3, A4, A5, A6 respectively. In fuzzy TOPSIS method decision makers have right to judge the importance of each criterion and as well as performance of alternative ratings. But in this study we used the customer responses and staff responses as alternative ratings and criterion weights. For alternative ratings, we already used the mode asaverage from different ATMs and then combined all of them into a matrix. So there is no need to find the aggregated mean of those alternatives. Simply we put all those opinions into linguistic variables. But for criterion weights, we need to find aggregated mean because we get all those responses from just one member of staff from each ATM. 219
International Journal of Business and Social Science
Vol. 5, No. 13; December 2014
Thus first of all, we set linguistic scales to evaluate the importance of criteria weights and alternative ratings based on opinions. The triangular fuzzy numbers for criterion and alternative rating are shown in Table 1 and Table.2 respectively by using the relation a≤ b≤ c. The criteria weights lie within the interval [0, 1] whereas; the alternative ratings lie within 1 to 10 scales (Goli, 2013). Table.1: Linguistic Variable for Importance of Weight of Each Criterion Linguistic variable Very Low (VL) Low (L) Medium (M) High (H) Very High (VH)
Triangular fuzzy numbers (0.0, 0.1, 0.3) (0.1, 0.3, 0.5) (0.3, 0.5, 0.7) (0.5, 0.7, 0.9) (0.7, 0.9, 0.9) Table.2: Fuzzy Rating of Alternatives
Linguistic variable Very Poor (VP) Poor (P) Fair (F) Good (G) Very Good (VG)
Triangular fuzzy numbers (1,1,3) (1,3,5) (3,5,7) (5,7,9) (7,9,9)
Step 1.Alternative versus service quality factors was considered. The alternatives are denoted by A1, A2, A3, A4, A5, and A6 respectively. Step2. In the next step the important criterions used for service quality factors of ATMs was identified. The 17 important criteria used in this study are: User friendly, Neat and Clean machine,Adequate number of ATM machines, Conveniently located,Correct and Clear guidance machine,Flexibility,24 hour service,Availability of cash all the time,Quick operation machine,Safe & secure machines, per day limit of cash withdraw,Other facilities availability, Interbank transfer,Machines breakdown,Technological updating,Waiting time (queues),Awareness of fee charged and these are denoted by C1, C2, C3, C4, C5, C6, C7, C8, C9, C10, C11, C12, C13, C14, C15, C16, and C17 respectively. Step 3.The weights to the criterions of service quality were assigned by using the linguistic variables. Similarly the alternatives rating are worked out using Table.2. Table.3: Criterion Weights Using Linguistic Variables Criterions C1 C2 C3 C4 C5 C6 C7 C8 C9 C10 C11 C12 C13 C14 C15 C16 C17
220
VH H H H H L L L M M M VH M H VH VL H
H H L M H M M H M H H VH VH VH M H H
Responses H M H L H H L L L L L H VL VH L H H
H H M H H H H L M M L L H H H H H
H VH H M VH L VL L H VH L H H VH VH VL M
H L H VL H VH H VL VL M L VH VH M M VH VH
© Center for Promoting Ideas, USA
www.ijbssnet.com
Step 4. The transformation of opinions for criterion weights into linguistic variables is shown in Table.3. Then aggregated the criterion weights and the result is shown in Table .4 and the aggregated alternativerating (fuzzy decision matrix) is shown in Table.5 Table.4: Aggregated Fuzzy Weights for Criterion Criterions C1 C2 C3 C4 C5 C6 C7 C8 C9 C10 C11 C12 C13 C14 C15 C16 C17
Aggregated fuzzy weights (0.53,0.73, 0.90) (0.43, 0.63, 0.80) (0.40, 0.60, 0.80) (0.66, 0.46, 0.66) (0.53, 0.73, 0.90) (0.35, 0.53, 0.70) (0.25, 0.43, 0.63) (0.15, 0.33, 0.53) (0.25, 0.43, 0.63) (0.26, 0.46, 0.66) (0.26, 0.46, 0.66) (0.53, 0.73, 0.83) (0.60, 0.80, 0.86) (0.56, 0.76, 0.86) (0.43, 0.63, 0.76) (0.36, 0.53, 0.70) (0.50, 0.70, 0.86)
Table.5 Aggregated Rating of Alternatives (Fuzzy Decision Matrix)
C1 C2 C3 C4 C5 C6 C7 C8 C9 C10 C11 C12 C13 C14 C15 C16 C17
A1 (7,9,9) (3,5,7) (1,3,5) (5,7,9) (5,7,9) (5,7,9) (1,3,5) (5,7,9) (5,7,9) (5,7,9) (5,7,9) (5,7,9) (5,7,9) (5,7,9) (5,7,9) (3,5,7) (3,5,7)
A2 (7,9,9) (3,5,7) (5,7,9) (5,7,9) (5,7,9) (5,7,9) (1,3,5) (3,5,7) (5,7,9) (3,5,7) (5,7,9) (5,7,9) (7,9,9) (3,5,7) (5,7,9) (5,7,9) (5,7,9)
A3 (7,9,9) (5,7,9) (3,5,7) (5,7,9) ((5,7,9) (5,7,9) (3,5,7) (1,3,5) (3,5,7) (5,7,9) (5,7,9) (5,7,9) (5,7,9) (7,9,9) (5,7,9) (5,7,9) (7,9,9)
A4 (1,3,5) (3,5,7) (1,3,5) (5,7,9) (3,5,7) (3,5,7) (1,3,5) (1,3,5) (3,5,7) (3,5,7) (1,3,5) (7,9,9) (5,7,9) (5,7,9) (3,5,7) (5,7,9) (5,7,9)
A5 (5,7,9) (7,9,9) (5,7,9) (3,5,7) (5,7,9) (5,7,9) (5,7,9) (5,7,9) (5,7,9) (3,5,7) (5,7,9) (5,7,9) (5,7,9) (5,7,9) (5,7,9) (1,3,5) (3,5,7)
A6 (7,9,9) (1,3,5) (5,7,9) (3,5,7) (7,9,9) (7,9,9) (1,3,5) (1,3,5) (5,7,9) (3,5,7) (1,3,5) (7,9,9) (5,7,9) (5,7,9) (5,7,9) (5,7,9) (7,9,9)
Step 5. The fuzzy decision matrix was normalized for benefit criterion and cost criteria usingequation(3.2) and equation(3.3) respectively. The criterions C1, C2, C3, C4, C14, and C16 are considered as cost criterion whereas C5, C6, C7, C8, C9, C10, C11, C12, C13, C15, and C17 are taken as benefit criterion. The normalized decision matrix is given in Table.6 as shown below:
221
International Journal of Business and Social Science
Vol. 5, No. 13; December 2014
Table.6: Normalized Fuzzy Decision Matrix C1 C2 C3 C4 C5 C6 C7 C8 C9 C10 C11 C12 C13 C14 C15 C16 C17
A1 (.11,.11,0.14) (.14,.20,.33) (.20,.33,1.0) (.33,.42,.60) (.55,.77,1.0) (.55,.77,1.0) (.11,.33,.55) (.55,.77,1.0) (.55,.77,1.0) (.55,.77,1.0) (.55,.77,1.0) (.55,.77,1.0) (.55,.77,1.0) (.33,.42,.60) (.55,.77,1.0) (.14,.20,.33) (.33,.55,.77)
A2 (.11,.11,.14) (.14,.20,.33) (.11,.14,.20) (.33,.42,.60) (.55,.77,1.0) (.55,.77,1.0) (.11,.33,.55) (.33,.55,.77) (.55,.77,1.0) (.33,.55,.77) (.55,.77,1.0) (.55,.77,1.0) (.77,1.0,1.0) (.42,.60,1.0) (.55,.77,1.0) (.11,.14,.20) (.55,.77,1.0)
A3 (.11,.11,.14) (.11,.14,.20) (.14,.20,.33) (.33,.42,.60) (.55,.77,1.0) (.55,.77,1.0) (.33,.55,.77) (.11,.33,.55) (.33,.55,.77) (.55,.77,1.0) (.55,.77,1.0) (.55,.77,1.0) (.55,.77,1.0) (.33,.33,.42) (.55,.77,1.0) (.11,.14,.20) (.77,1.0,1.0)
A4 (.2,.33,1.0) (.14,.20,.33) (.2,.33,1.0) (.33,.42,.60) (.33,.55,.77) (.33,.55,.77) (.11,.33,.55) (.11,.33,.55) (.33,.55,.77) (.33,.55,.77) (.11,.33,.55) (.77,1.0,1.0) (.55,.77,1.0) (.33,.42,.60) (.33,.55,.77) (.11,.14,.20) (.55,.77,1.0)
A5 (.11,.14,.20) (.11,.11,.14) (.11,.14,.20) (.42,.60,1.0) (.55,.77,1.0) (.55,.77,1.0) (.55,.77,1.0) (.55,.77,1.0) (.55,.77,1.0) (.33,.55,.77) (.55,.77,1.0) (.55,.77,1.0) (.55,.77,1.0) (.33,.42,.60) (.55,.77,1.0) (.20,.33,1.0) (.33,.55,.77)
A6 (.11,.11,.14) (.20,.33,1.0) (.11,.14,.20) (.42,.60,1.0) (.77,1.0,1.0) (.77,1.0,1.0) (.11,.33,.55) (.11,.33,.55) (.55,.77,1.0) (.33,.55,.77) (.11,.33,.55) (.77,1.0,1.0) (.55,.77,1.0) (.33,.42,.60) (.55,.77,1.0) (.14,.20,.33) (.77,1.0,1.0)
Step 6: The weighted normalized decision matrix was computed by multiplying the weights of each criterion to the values of normalized fuzzy decision matrix. The computed weighted matrix is shown in Table.7 as below: Table.7: Weighted Normalized Decision Matrix Criterions C1 C2 C3 C4 C5 C6 C7 C8 C9 C10 C11 C12 C13 C14 C15 C16 C17
C1 C2 C3 C4 C5 C6 C7 C8 C9 C10 C11 C12 C13 C14 C15 C16 C17
A1 (.058,.080,.126) (.060,.126,.264) (.080,0.198,.800) (.218,.1932,.396) (.292,.5621,.900) (.193,.4081,.700) (.028,.1419,.346) (.083,.2541,.530) (.138,.331,.630) (.143,.354,.660) (.143,.354,.660) (.292,.562,.830) (.330,.616,.860) (.185,.3192,.516) (.237,.485,.760) (.050,.106,.231) (.165,.385,.662)
A4 (.106,.241,.900) (.060,.126,.264) (.080,.198,.800) (.218,.193,.396) (.175,.402,.693) (.116,.292,.539) (.028,.142,.347) (.016,.109,.292) (.083,.237,.485) (.086,.253,.508) (.029,.152,.363) (.408,.730,.830) (.330,.616,.860) (.185,.319,.516) (.142,.347,.585) (.039,.074,.140) (.275,.539,.860)
A2 (.058,.080,.126) (.060,.126,.264) (.044,.084,.160) (.218,.193,.396) (.2915,.5621,.900) (.1925,.4081,.700) (.2075,.1419,.346) (.049,.1815,.408) (.138,.331,.630) (.086,.253,.508) (.143,.354,.660) (.292,.562,.830) (.462,.800,.860) (.235,.456,.860) (.237,.485,.760) (.039,.074,.140) (.275,.539,.860)
A5 (.058,.102,.180) (.047,.069,.112) (.044,.084,.160) (.277,.276,.660) (.295,.562,.900) (.195,.408,.700) (.138,.331,.630) (.083,.254,.53) (.138,.331,.63) (.086,.253,.508) (.143,.354,.660) (.292,.562,.830) (.330,.616,.860) (.185,.319,.516) (.237,.485,.760) (.072,.175,.700) (.165,.385,.662)
A3 (.058,.080,.126) (.047,.088,.160) (.056,.120,.264) (.218,.193,.396) (.292,.562,.900) (.193,.408,.700) (.083,.237,.485) (.016,.1089,.291) (.083,.237,.485) (.143,.354,.660) (.143,.354,.660) (.292,.562,.830) (.33,.616,.860) (.185,.251,.361) (.237,.485,.760) (.039,.074,.140) (.385,.700,.860)
A6 (.058,.080,.126) (.086,.208,.800) (.044,.084,.160) (.277,.276,.660) (.408,.730,.900) (.269,.530,.700) (.027,.141,.346) (.016,.108,.291) (.138,.331,.630) (.086,.253,.508) (.028,.152,.363) (.408,.730,.830) (.330,.616,.860) (.184,.319,.516) (.236,.485,.760) (.050,.106,.231) (.385,.700,.860)
Step 7:The fuzzy negative ideal (A-) and fuzzy positive ideal (A+) solution was determined. As we know the values of normalized fuzzy decision matrix lies within the interval [0, 1]. This is 0 for negative ideal solution (NIS) and 1 for positive ideal solution (PIS) using equation (3.4); the results are shown in Table.8 and Table.9. 222
© Center for Promoting Ideas, USA
www.ijbssnet.com
Table.8: Fuzzy Positive Ideal Solution (A+) Criterions C1 C2 C3 C4 C5 C6 C7 C8 C9 C10 C11 C12 C13 C14 C15 C16 C17
A1 .9124 .8542 .7140 .7365 .4843 .6034 .8384 .7346 .6653 .6498 .6498 .4907 .4531 .6738 .5494 .8741 .6296
A2 .9124 .8542 .9052 .7365 .4843 .6034 .8384 .8007 .6653 .7383 .6498 .4907 .3410 .5478 .5494 .9163 .5025
A3 .9124 .9082 .8577 .7365 .4843 .6034 .7505 .8685 .7505 .6498 .6498 .4907 .4531 .6738 .5494 .9163 .4032
A4 .6795 .8542 .7140 .7365 .6146 .7063 .8384 .8685 .7505 .7383 .8304 .3882 .4531 .6738 .6671 .9163 .5025
A5 .9124 .9243 .9052 .6224 .4843 .6034 .6653 .7346 .6653 .7383 .6498 .4907 .4531 .6738 .5494 .7375 .6296
A6 .9124 .7077 .9052 .6224 .3800 .5305 .8384 .8685 .6653 .7383 .8304 .3882 .4531 .6738 .5494 .8741 .4032
A5 .1241 .0807 .1073 .4429 .6353 .4808 .4185 .3426 .4185 .3314 .4402 .6027 .6397 .3661 .5381 .4186 .4532
A6 .0924 .4797 .1073 .4429 .7093 .5302 .2167 .1799 .4185 .3314 .2277 .6802 .6397 .3661 .5381 .1495 .6776
Table.9: Fuzzy Negative Ideal Solution (A-) Criterions C1 C2 C3 C4 C5 C6 C7 C8 C9 C10 C11 C12 C13 C14 C15 C16 C17
A1 .0924 .1724 .4780 .2837 .6353 .4808 .2167 .3426 .4185 .4402 .4402 .6027 .6397 .3661 .5381 .1495 .4523
A2 .0924 .1724 .1073 .2837 .6353 .4808 .2167 .2594 .4185 .3314 .4402 .6027 .7287 .5781 .5381 .0942 .6071
A3 .0924 .1088 .1705 .2837 .6353 .4808 .3152 .1799 .3152 .4402 .4402 .6027 .6397 .3661 .5381 .0942 .6071
A4 .5413 .1724 .4780 .2837 .4733 .3600 .2167 .1799 .3152 .3314 .2277 .6802 .6397 .3661 .4011 .0942 .6071
Step 8: As the distances from each criterion to fuzzy positive ideal solution (FPIS) and fuzzy negative ideal solution (FNIS) are computed in the above step. In this step we then summed up all distances of each criterion by using equation (3.5) and (3.6) respectively and results are shown in Table.10.
223
International Journal of Business and Social Science
Vol. 5, No. 13; December 2014
Table.10: Distances ofCriterions from A+ and ACriterions C1 C2 C3 C4 C5 C6 C7 C8 C9 C10 C11 C12 C13 C14 C15 C16 C17
dj+ 5.2415 5.1026 5.0013 4.1908 2.9318 3.6504 4.7694 4.8754 4.1622 4.2528 4.2600 2.7392 2.6065 3.9168 3.4141 5.2346 3.0706
dj1.0350 1.1864 1.4484 2.0206 3.7238 2.8134 1.6005 1.4843 2.3044 2.2060 2.2162 3.7712 3.9272 2.4086 3.0916 1.0002 3.4740
Step 9: Now we calculate the criterion ‘closeness coefficient index’ by using the equation (3.7). Closeness coefficient value close to 1 shows the optimal criterion. Then determined the ranking of each criterion along with closeness coefficient values and the results are shown in Table.11. Table.11: Closeness Coefficient and Ranking of Criterions Criterions C1 C2 C3 C4 C5 C6 C7 C8 C9 C10 C11 C12 C13 C14 C15 C16 C17
dj1.0350 1.1864 1.4484 2.0206 3.7238 2.8134 1.6005 1.4843 2.3044 2.206 2.2162 3.7712 3.9272 2.4086 3.0916 1.0002 3.4740
dj-+ dj+ 6.2765 6.2890 6.4497 6.2114 6.6556 6.4638 6.3699 6.3597 6.4666 6.4588 6.4762 6.5104 6.5337 6.3254 6.5057 6.2348 6.5446
Cj 0.1649 0.1886 0.2245 0.3253 0.5594 0.4352 0.2512 0.2333 0.3563 0.3415 0.3422 0.5792 0.6010 0.3807 0.4752 0.1604 0.5308
Rank 16 15 14 11 03 06 12 13 08 10 09 02 01 07 05 17 04
Step 10: The prioritized factors of service quality of ATMs with respect to‘closeness coefficients’ can be shown as in Table.12.
224
© Center for Promoting Ideas, USA
www.ijbssnet.com
Table.12: Prioritized factors of Service Quality of ATMs Rank 1 2 3 4 5 6 7 8 9 10 11 12 13 14 15 16 17
Cj 0.6010 0.5792 0.5594 0.5308 0.4752 0.4352 0.3807 0.3563 0.3422 0.3415 0.3253 0.2512 0.2333 0.2245 0.1886 0.1649 0.1604
Factors Interbank Transfer(C13) Availability of other facilities(C12) Correct & Clear guidance(C5) Awareness of fee charged(C17) Technological updating(C15) Flexibility(C6) Machines Breakdown(C14) Quick operations(C9) Per day limit of cash(C11) Safe & secured machines(C10) Neat & clean machines(C2) Sufficient number of ATMs(C3) Availability of cash all the time(C8) 24 hour service(C7) Conveniently located(C4) User friendly(C1) Waiting times(C16)
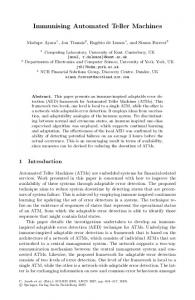
The values of closeness coefficient corresponding to ranked factors of Service Quality of ATMs can be depicted as below(Fig.1): Fig.1:Ranks VS Closeness Coefficient
The factor C13-Interbank Transfer, ranked first as it has closeness coefficient value closer to 1 while factor C16Waiting time, ranked the lowest and it has value of closeness coefficient closer to 0. Similarly, all other factors are ranked corresponding to their closeness coefficient values. High ranked values indicate the customer’s satisfaction towards the factor(s) but lower ranked values indicate the customer’s dissatisfaction. Similarly satisfaction/dissatisfaction of customers regarding remaining factors can be seen from the above exponentially decay graph (see Fig.1).
5. Conclusion and Remarks The performance evaluation of banking sector is a multi-criteria decision-making problem including both quantitative and qualitative. In this paper, we presented a multi-criteria decision-making approach for performance evaluation of ATMs of different banks in Pakistan under fuzzy environment. The proposed approach comprises of two steps. In step 1, the criteria are identified.
225
International Journal of Business and Social Science
Vol. 5, No. 13; December 2014
These criterions are user friendly, neat and clean machine, Adequate number of ATM machines, Conveniently located, Correct and Clear guidance machine, Flexibility, 24 hour service, Availability of cash all the time, Quick operation machine, Safe & secure machines, Per day limit of cash withdraw, Other facilities availability, Interbank transfer, Machines breakdown, Technological updating, Waiting time (queues),Awareness of fee charged. In step 2, the experts and customers provided linguistic ratings to the criteria and the alternatives respectively. Fuzzy TOPSIS is used to aggregate the ratings and generate an overall performance score for measuring each alternative. We carried out this study in Islamabad, Pakistan. The results indicate that there are some important factors that should be improved to get more satisfaction of customers such as to install more ATMs at secured area which may help to reduce the waiting time and risk in cash. Focus should be given on neatness (interior/exterior) of machines, make more user friendly, to provide the 24 hour service with quick operations and the cash availability all the times especially on weekends, ending days of month, and Eidholidays etc.The study could be helpful tointer-alia and to the banking sector of the country to make new policies, decisions and plans to improve those service quality factors that are ranked lowest to attract more customers with greater convenience. This study may be further extended as follows: 1. Others method such as Data Envelopment Analysis(DEA) may be used to evaluate the performance and compare those results with the above study. 2. Ranking may be applied to alternatives rather than criteria 3. Performance may be evaluated using trapezoidal/quadrilateral fuzzy numbers in TOPSIS. 4. Sensitive analysis may be conducted to evaluate the influence of criteria weights on closeness coefficient(ranking).
References Al-Hawari,M., and Ward,T.(2006). The impact of automated service quality on financial performance and the mediating role of customer retention. Journal of Financial Service Marketing, 10(3), 228-43. Ashrafzadeh,M.,Mokhatab,F.R.,Mollaverdi,N.I(2012): Application of fuzzy TOPSIS method for selection of Warehouse Location: A case study. Interdisciplinary Journal of contemporaryResearch Bussiness.Vol.3, No.(9). Chen, C. T. (2000). Extension of the TOPSIS for group decision-making under fuzzy environment. Fuzzy Sets and Systems, Vol. 114, No. 1, pp. 1-9. Goli,D.(2013). Group fuzzy TOPSIS methodology in computer security software selection. International Journal of fuzzy logic system 3(2) Islam,R.,Kumar,S.,andBiswas,P.K(2005/2007).Customer satisfaction of ATM service: A case study of HSBC ATM.(http://papers.ssrn.com/sol3/papers.cfm?abstract id=990242). Joseph,M.,Stone,G.(2003). An empirical evaluation of USbank customer perceptions of the impact of technology on service devilvery in the banking sector. International journal of Retail and Distribution Management,6(5), 53-71. Semih,O., Efendigil,T.,andKara,S.S.(2009). A combined fuzzy MCDM approach for electing shopping center site: An example from Istanbul,Turkey. Expert System with applications,37, 1973-80 Sun,C.C.,andLin,T.R.G.(2009). Using fuzzy TOPSIS method for evaluating the competitive advantages of shopping websites. Expert System with Applications, 36, 11764-11771. Shamsuddoha,M.,Chowdhury,M.T.,andAhsan,A.B.M.J(2005). Automated Teller Machine: A New Dimension in the Banking Sector of Bangladesh.
226
© Center for Promoting Ideas, USA
www.ijbssnet.com
Appendix.1 Questionnaire Instructions:Pleasemarkthe mostappropriateboxagainsteachquestion LikertScale:Strongly Disagree(SD),Disagree(DA),Neutral (N),Agree(A),StronglyAgree(SA) S.No. 1 2 3 4 5 6 7 8 9 10 11 12
13 14 15 16 17
Statements ATMs are more user friendly machine. The machines are neat and clean in appearance. The number of ATMs is sufficient. ATMs are located at convenient places. The functions of ATMs are easily understandable. Machine can understand customer need perfectly. Services are accessible all the times. Required amount of money are available all the time. It provides the speedy operations all the time. The risk of cash with the use of ATMs is low. The limit of cash Availability per day is satisfactory. It provides the availability of balance inquiry, ministatement and change of personal identification number etc. It provides the facility to pay bills and transferring the funds. Have you ever faced the problem of card locking, machine breakdown etc. Do you satisfy with the technological updating for the service? Do you never wait in long queues to receive the service? Do you have an idea about the fee charged while using an ATM not owned by your bank?
SD
DA
N
A
SA
Appendix.2 Alternative.1(Respondents=15) Q.No. 1 2 3 4 5 6 7 8 9 10 11 12 13 14 15 16 17
SD 1 1 4 2 1 1 1 1 -
DA 2 8 4 2 3 5 3 4 1 1 3 2 2
N 1 7 3 5 1 3 3 5 3 5 6 4 4 1 6 5 5
A 5 5 4 6 8 6 3 5 6 5 6 8 10 8 8 5 3
SA 9 4 2 1 3 1 3 1 3 1 2 4
Mode SA=9 N=7 DA=8 A=6 A=8 A=6 DA=5 A=5 A=6 A=5 A=6 A=8 A=10 A=8 A=8 N=5 N=5 227
International Journal of Business and Social Science
Vol. 5, No. 13; December 2014
Alternative.2(Respondents=20) Q.No. 1 2 3 4 5 6 7 8 9 10 11 12 13 14 15 16 17
SD 2 2 1 1 3 2 2 1 2 1 1 2 1 1 4
DA 1 2 4 3 8 6 3 4 3 1 3 5 3 6 2
N 9 6 7 1 4 6 6 6 6 4 2 4 6 5 3 -
A 8 8 8 8 10 10 2 5 6 6 10 10 6 3 11 9 13
SA 9 1 2 8 5 1 1 3 3 1 6 6 4 1 1
Mode SA=9 N=8 A=8 A=8 A=10 A=10 DA=8 N=6 A=6 N=6 A=10 A=10 SA=6 N=6 A=11 A=9 A=13
DA 2 5 4 6 4 7 1 4 4 1 3 3 2 3 4
N 3 5 6 1 3 6 6 9 5 6 4 2 3 5 5 2
A 8 9 5 7 12 7 4 4 7 8 7 8 10 4 10 7 3
SA 12 6 5 1 7 4 1 2 2 2 2 7 4 7 3 2 9
Mode SA=12 A=5 N=5 A=7 A=12 A=7 N=6 DA=7 N=9 A=8 A=7 A=8 A=10 SA=7 A=10 A=7 SA=9
Alternative.3(Respondents=20) Q.No. 1 2 3 4 5 6 7 8 9 10 11 12 13 14 15 16 17
228
SD 2 5 1 1 1 1 1 3 3 2
© Center for Promoting Ideas, USA
www.ijbssnet.com
Alternative.4(Respondents=12) Q.No. 1 2 3 4 5 6 7 8 9 10 11 12 13 14 15 16 17
SD 1 1 3 1 2 2 1 2 1 1 2 1 2 1 1
DA 4 4 5 3 2 1 8 5 3 3 6 1 2 3 2 1
N 3 4 3 2 6 5 4 5 5 2 1 2 4 2 4
A 4 4 3 4 2 4 1 1 1 4 2 4 5 8 3 4 4
SA 1 1 1 1 1 5 3 1 3 2
Mode DA=4 N=4 DA=5 A=4 N=6 N=5 DA=8 DA=5 N=5 N=5 DA=6 SA=5 A=5 A=8 N=4 A=4 A=4
DA 1 2 2 1 3 2 1 1 3 1 1 4 5
N 3 3 4 2 3 3 4 1 2 2 2 2 3 4
A 7 2 5 4 5 7 3 6 5 3 4 8 6 5 6 2 -
SA 3 3 3 2 2 1 2 2 1 2 2 -
Mode A=7 SA=3 A=5 N=4 A=5 A=7 A=3 A=6 A=5 N=4 A=4 A=8 A=6 A=5 A=6 DA=4 N=4
Alternative.5(Respondents=10) Q.No. 1 2 3 4 5 6 7 8 9 10 11 12 13 14 15 16 17
SD 1 1 1 1
229
International Journal of Business and Social Science
Vol. 5, No. 13; December 2014
Alternative.6(Respondents=20) Q.No. 1 2 3 4 5 6 7 8 9 10 11 12 13 14 15 16 17
SD 1 2 3 3 1 4 3 1 3 3
DA 1 7 5 4 3 3 7 8 3 1 7 2 1 1 1 2
N 2 5 3 7 1 3 4 7 4 8 1 1 3 4 6 2
A 8 3 8 3 8 5 5 4 7 7 7 8 10 9 8 6 6
SA 9 4 2 3 8 9 1 2 4 2 10 9 6 7 4 7
Mode SA=9 DA=7 A=8 N=7 SA=8 SA=9 DA=7 DA=8 A=7 N=8 DA=7 SA=10 A=10 A=9 A=8 A=6 SA=7
A3 SA A N A A A N DA N A A A A SA A A SA
A4 DA N DA A N N DA DA N N DA SA A A N A A
A5 A SA A N A A A A A N A A A A A DA N
A6 SA DA A N SA SA DA DA A N DA SA A A A A SA
Appendix.3 Combined Customer’s Responses for Alternatives Criterions 1 2 3 4 5 6 7 8 9 10 11 12 13 14 15 16 17
230
A1 SA N DA A A A DA A A A A A A A A N N
A2 SA N A A A A DA N A N A A SA N A A A
© Center for Promoting Ideas, USA
www.ijbssnet.com
Transformation of combined customer’s response into linguistic variable for Alternatives Criterions 1 2 3 4 5 6 7 8 9 10 11 12 13 14 15 16 17
A1 VG F P G G G P G P G G G G G G F F
A2 VG F G G G G P F G F G G VG F G G G
A3 VG G F G G G F P F G G G G VG G G VG
A4 P F P G F F P P F F P VG G G F G G
A5 G VG G F G G G G G F G G G G G P F
A6 SA DA A N SA SA DA DA A N DA SA A A A A SA
Management responses for criterion weights with linguistics variables in parenthesis Criterions 1 2 3 4 5 6 7 8 9 10 11 12 13 14 15 16 17
SA(VH) A(H) A(H) A(H) A(H) DA(L) DA(L) DA(L) N(M) N(M) N(M) SA(VH) N(M) A(H) SA(VH) SD(VL) A(H)
A(H) A(H) DA(L) N(M) A(H) N(M) N(M) A(H) N(M) A(H) A(H) SA(VH) SA(VH) SA(VH) N(M) A(H) A(H)
Responses A(H) N(M) A(H) DA(L) A(H) A(H) DA(L) DA(L) DA(L) DA(L) DA(L) A(H) SD(VL) SA(VH) DA(L) A(H) A(H)
A(H) A(H) N(M) A(H) A(H) A(H) A(H) DA(L) N(M) N(M) DA(L) DA(L) A(H) A(H) A(H) A(H) A(H)
A(H) SA(VH) A(H) N(M) SA(VH) DA(L) SD(VL) DA(L) A(H) SA(VH) DA(L) A(H) A(H) SA(VH) SA(VH) SD(VL) N(M)
A(H) DA(L) A(H) SD(VL) A(H) SA(VH) A(H) SD(VL) SD(VL) N(M) DA(L) SA(VH) SA(VH) N(M) N(M) SA(VH) SA(VH)
231