performance of the two hypervisors used to create the virtual environment is ... introduced by a group for automatic page replacement ... tools. 3.1 Test Environment Specification. In this research work, three Lenovo Servers i3 2120 are taken.
International Journal of Computer Applications (0975 – 8887) Volume 89 – No 11, March 2014
Performance Evaluation of Virtual Environment with respect to Physical Environment Pooja Kedia
Renuka Nagpal
Amity University Noida, Uttar Pradesh
Amity University Noida, Uttar Pradesh
ABSTRACT Virtualization is the most emerging topic of this decade that has transformed the way the IT infrastructure is deployed. Virtualization is capturing the IT industry and replacing the physical environment with the virtual one. Thus, before switching to virtualization it is very essential for an organization to evaluate the performance of the virtual environment. In this paper, the performance of virtual and physical environment is evaluated. Two types of hypervisors i.e. VMWare ESXi 5 and Hyper V Windows Server 2012 are used in order to create the virtual environment. The performance of the two hypervisors used to create the virtual environment is also compared and evaluated. The performance evaluation is done with the help of benchmarking tools.
General Terms Cloud computing, Virtualization
Keywords Benchmarking Tools, Hypervisor, Virtual machines, Security, Virtualization Tools.
1. INTRODUCTION Virtualization is the most emerging technology of this decade in which advancement is taking place exponentially. Day by day virtualization is gaining a lot of popularity as it increases the hardware utilization and provides an easy management of the infrastructure [1]. Virtualization is the foundation of cloud computing and forms the base for offering cloud services therefore, it is very essential for an organization to be aware of the virtualization technology and its benefit. In the physical environment, resources are not utilized completely, but with the help of virtualization this problem can be eliminated. Thus virtualization technology has emerged as boon to IT Industry. There are a lot of vendors offering virtualization technologies in the market thus, it is very important for an organization to be aware of the virtualization technology that will be suitable for them. The available virtualization technology ranges from open source technologies such as Xen and KVM to commercial ones such as Microsoft Hyper V and VMware vSphere. Among all, VMware is the global leader and is ranked no. 1 in providing virtualization services. Microsoft which is growing with a faster pace has now become the close competitor of VMware in offering virtualization services. Thus, the two commercial technologies i.e. vSphere and Hyper V is considered for our research. A physical and a virtual environment of same configuration are created in order to get accurate results. This paper is divided into five sections. In section 2, the background of virtualization technology and its related work is discussed. Methodology to conduct the
performance evaluation is discussed in section 3. In section 4 the results of the benchmarking tools are discussed. The conclusion of the research work is discussed in section 5.
2. BACKGROUND AND RELATED WORK Virtualization, which is the most popular technology presently, is not something new. This term came into picture way back in 1950’s when the concept of virtual memory was introduced by a group for automatic page replacement university of Manchester [2]. In 1960’s, IBM came up with the concept of virtual machine by introducing System/360 model 67, which was a system having virtual memory. In the mid of 1960’s IBM came up with idea of time sharing in its project named M44/44X. Hardware virtualization concept also came into picture during this time which permitted VMM to run VM’s in a secure and isolated environment. The concept of virtualization was fully accepted by several users and gained a lot of popularity by the mid 1970’s. But with the development of mini computers and PC’s the popularity of virtualization started decreasing and by the end of 1990’s virtualization disappeared due to availability of cost effective mini computers. As the time passed, the number of servers in the organizations started increasing with the minimum utilization of the resources per server. It proved to be very costly, and made the organizations think upon a way which could increase the resource utilization and reduce the number of physical servers. This was the time when the virtualization technology re-emerged to serve the industry again. In 1990’s when research was going on VMM by a research group in Stanford University then VMWare was the prime organization. VMWare transformed the virtualization technology, successfully remoulded it and provided it new dimensions. Earlier virtualization started with the concept of multitasking but today, it is catering the industries by providing excellent services, which helps in reducing hardware, operational and management cost. Today, there are many vendors such as IBM, Microsoft, Intel, Citrix, Xen, etc. other than VMWare, available in the market which is providing virtualization services, but among all VMWare is the global leader. There have been many performance evaluations of the hypervisors in the past. In [3] the author compared the performance of Xen and KVM by conducting benchmarking test and evaluates the performance on the basis of scalability of CPU and isolation. Performance comparison of VMware and Xen was done by the author in [4] in two different environments i.e. thin provisioned and thick provisioned. In [5] the performance of Xen and VMWare hypervisor is compared on the basis of scalability and performance. Many comparative studies are done on various hypervisors on the
17
International Journal of Computer Applications (0975 – 8887) Volume 89 – No 11, March 2014 basis of various performance metrics. As the virtualization technology has grown exponentially within past few years therefore, it is very essential to evaluate the performance very carefully. There is a lot of work done in order to compare VMWare, Xen, KVM and VirtualBox. But performance evaluation of Hyper V and VMWare is not very common. Thus in this research work, the performance of native environment with the virtual environment is evaluated carefully.
3. METHODOLOGY In this research work, the performance evaluation of two scenarios will be done. In the first scenario, the performance evaluation of virtual environment and non virtual environment will be done. In second scenario, the performance evaluation of VMWare ESXi and Microsoft Hyper-V will be done. The performance evaluation is done on the basis of benchmarking tools.
3.1 Test Environment Specification In this research work, three Lenovo Servers i3 2120 are taken out of which one is used to create physical environment and the other two are used to make virtual environment using VMWare’s ESXi and Microsoft’s Hyper V.
3.1.1 Bare metal Virtualization In this type of full virtualization, there is no host operating system i.e. the hypervisor directly runs on the underlying hardware. It is also known as native virtualization and uses Type 1 Hypervisor.
3.1.2 Hosted Virtualization In this class of full virtualization, there is a host operating system which can be any common OS such as Linux, Windows etc. on which the hypervisors runs. Hosted virtualization architectures have an additional layer of software (the virtualization application) running in the guest OS that provides utilities to control the virtualization while in the guest OS, such as the ability to share files with the host OS [5]. It uses Type 2 Hypervisor.
3.2 Benchmarking Tools Benchmarking tools are used in order to test the characteristics of a specific technology. Benchmarking tools are used when real time environment is not available [6]. There are many benchmarking tools used in order to evaluate the performance of the virtual and non virtual environment as well as to evaluate and compare the performance of the two hypervisors used. The benchmarking tools used are briefly discussed.
3.2.1 Passmark Performance Test It is a benchmarking tool that tests all the major sub-systems of a machine. It permits to benchmark a system using various tests and compare the outcome with other systems. PassMark Performance Test runs a set of various benchmarking test in order to evaluate the performance [7]. It has five basic test suites:
CPU Test Suite
2D Graphics Test Suite
3D Graphics Test Suite
Memory Test Suite
Disk Test Suite
These tests further consist of various operations for example the CPU Test Suite has Integer Math Test, Compression Test, Prime Number Test, Encryption Test, Floating Point Math Test etc. PassMark Performance Test 8.0 is installed on both the environments. In this research work, only three test suites are considered i.e. CPU Test Suite, Memory Test Suite, and Disk Test Suite. On the basis of these three test suites, the performance evaluation of virtual and non virtual environment is done. The two hypervisors are also compared on the basis of these tests.
3.2.2 IOmeter It is an I/O benchmarking tool which is used to measure input output operations. It is used to generate the workload and evaluate the performance under a disciplined workload. It can be used to test various performances such as network throughput, bandwidth, latency etc [8]. IOmeter 1.1 is installed on both the environments and the tests such as total I/O per second, total MBs per second, average I/O Response time in ms, CPU utilization and network packets per second were made to run several times on both the environments. These tests were made to run several times in order to obtain accurate results.
3.2.3 Iperf It is a network benchmarking tool which is used to measure the throughput of the network carrying UDP and TCP data. It is based on client and server model, thus one can measure the throughput between a client and a server [9]. The output of Iperf comprises of a time stamped data about the throughput measured and the amount of data transferred. It is an open source command line utility. It also has a java based front end named as Jperf. Jperf has a graphical user interface which makes its usage very simple. It is a cross platform tool thus, can be executed over any network and can make useful comparisons. In this research work, Iperf is used to measure the jitter and bandwidth of various environments. Firstly, the server is started and then the client. Iperf-2.0.5-2-win32 is installed on both the environments. A connection is established between the client and the server in order to measure the jitter and bandwidth.
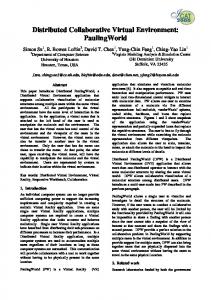
4. RESULTS AND DISSCUSSION 4.1 PassMark Performance Test 4.1.1 CPU Mark PassMark Performance Test CPU Mark is used in order to test the CPU operations. According to this test, Physical machine’s performance is the best and then the VMWare. Among both the hypervisors VMWare is leading.
4.1.2 Memory Mark PassMark Performance Test Memory Mark is used in order to test the memory operations. According to this test Physical machine’s performance is the best and then the VMWare. Among both the hypervisors VMWare is leading.
4.1.3 Disk Mark PassMark Performance Test Disk Mark is used in order to test the disk operations. According to this test Physical machine’s performance is the best. Among both the hypervisors, Hyper V is leading.
18
International Journal of Computer Applications (0975 – 8887) Volume 89 – No 11, March 2014 Table1. Test Environment Specification
Features/ Environment Type
Physical Environment
Virtual Environment with VMware ESXi
Virtual Environment with Microsoft Hyper V
Server
Lenovo Servers
Lenovo Servers i3 2120
Lenovo Servers i3 2120
Processor
Intel Core i3 2120
Intel Core i3 2120
Intel Core i3 2120
Processor Speed
3.30 GHz
3.30 GHz
3.30 GHz
RAM
8 Gb
8 Gb
8 Gb
Hard disk
250 Gb
250 Gb
250 Gb
System Type
64 bit
64 bit
64 bit
No. of cores
4
4
4
Bare Metal Hypervisor
N/A
VMWare’s ESXi 5
Hyper V Windows Server 2012
Operating System
Windows Server 2008
Windows Server 2008
Windows Server 2008
Figure1. PassMark CPU Performance Test
19
International Journal of Computer Applications (0975 – 8887) Volume 89 – No 11, March 2014
Figure 2. PassMark Memory Performance Test
Figure 3. PassMark Disk Performance Test
Figure 4. PassMark Overall Performance Test
4.1.4 PassMark Overall Performance Test
4.2 IOmeter
It gives the overall summary of the tests. According to this test Physical machine’s performance is the best and then the VMWare. Among both the hypervisors VMWare is leading.
IOmeter is used in order to test the I/O operations of the subsystems. All the tests were made to run several times so that the accurate results can be generated. In evaluating total I/O per second, Physical machine is leading and then the
20
International Journal of Computer Applications (0975 – 8887) Volume 89 – No 11, March 2014 VMWare. While among the hypervisors, VMWare is the leader. In evaluating average I/O Response time in ms, VMWare is the leader. While among hypervisors, VMWare is leading. In evaluating max I/O Response time, Hyper V is leading. While among the hypervisors, Hyper V is the leader.
4.3 Iperf The Iperf is a network benchmarking tool which is used to measure the throughput of the network carrying UDP and TCP data. It helps in calculating jitter and bandwidth of both the environments. Jitter is defined as the variation in delay while transferring packets [10]. Iperf is installed on both virtual and non virtual environment. Afterwards, one machine is made as server and the other acts as client and jitter is calculated. While comparing among the hypervisors, Hyper V has maximum jitter value. It can be clearly seen that the jitter is maximum in Hyper V and is minimum in the physical machine.
Figure 5. Total I/O per second
Figure 8. Jitter
Figure 6. Average I/O Response time
Figure 9. Bandwidth
Figure 7. Maximun I/O Response time
Iperf has a java based front end named as Jperf that has a graphical user interface which makes its usage very simple. Using this interface we can measure the bandwidth. Jperf is installed in both the environments. One machine is made as a client and the other machine is made as server. The data is transferred between the client and the server and the bandwidth is calculated. The results are recorded for the analysis. It can clearly be seen that the bandwidth of the physical machine is more among the three. While considering the hypervisors, the bandwidth of VMWare is high.
21
International Journal of Computer Applications (0975 – 8887) Volume 89 – No 11, March 2014
5. CONCLUSION In this paper the performance evaluation of the physical and virtual environment is done and was founded that the performance of physical environment is better than the virtual. We know that in a virtual environment, the hypervisor lies upon the abstraction layer i.e. between the physical hardware and the operating system. Thus, it will definitely affect the performance of the system as there is an additional component in between. Therefore, while comparing both the virtual and non virtual environment it was seen that the performance of the non virtual environment was much better than that of a virtual environment. But we know that virtualization offers a lot of excellent features such as live migration, cloning, dynamic resource scheduling, reduced downtime and small datacenters thus one can move on to virtualization technology to reap its benefits, if performance issues are overlooked. In this paper, the performance evaluation and comparison of two commercial hypervisors i.e. VMware’s vSphere and Microsoft’s Hyper V is also done. While comparing the performance of the two hypervisors i.e. VMWare ESXi 5 and Microsoft Hyper V Server 2012 it was founded that the overall performance of VMWare ESXi 5 was better. While performing Memory Mark test it was seen that the performance of both the hypervisors were nearly the same. But while performing Disk Mark test, the performance of Hyper V was better. Again when the test was carried out with IOmeter it was observed that the performance of VMWare was better than Hyper V. Although there are some cases like max I/O per second where Hyper V performed better than VMWare but if we consider the overall performance then VMWare is better. While evaluating jitter and bandwidth it was seen that VMWare performed better than Hyper V. Thus, the outcome of this research work was that among virtual and physical environment, one can achieve better performance in physical environment. And among the two hypervisors the performance of VMWare is better. In future we would like to
IJCATM : www.ijcaonline.org
extend our research work and evaluate the performance of other hypervisors.
6. REFERENCES [1] Pooja Kedia, Renuka Nagpal, Tejinder Pal Singh, A Survey on Virtualization Service Providers, Security Issues, Tools and Future Trends, IJCA, May 2013. [2] Sean Campbell and Michael Jeronimo, , An Introduction toVirtualization, 2006 [3] Barham, P., Dragovic, B., Fraser, K., Hand, S., Harris, T., Ho, A., Neugebauer,R., Pratt, I., Warfield, A., Xen and the art of virtualization. Proceedings of the19th ACM symposium on Operating systems principles. ACM Press., pp. 164-177, 2005. [4] Devanathan Nandhagopal, Nithin Mohan, Saimanoj kumaar Ravichandran, Shilp Malpani, VMware and Xen Hypervisor Performance Comparisons in Thick and Thin Provisioned Environments, 2012 [5] Muditha Perera, P. Keppitiyagama, Chamath, A performance comparison of hypervisors , 2012, IEEE [6] Daniel A. Menasce, Virgilio A.F. Almeida, Capacity Planning for Web Services: Metrics, Models, and Methods, 200,1 Prentice Hall [7] Passmark performance http://www.passmark.com/products/pt.htm
test,
[8] Iometer, Iometer User’s Guide,2003 [9] Anuj Sehgal, Jürgen Schönwälder, Testing Network Performance with Iperf, 2010 [10] P. Calduwel Newton, L. Arockiam, A Quality of Service Algorithm to Reduce Jitter in Mobile Networks, 2011, Springer
22