Performance Indicators for Robotics Systems in Logistics Applications Wolfgang Echelmeyer, Alice Kirchheim, Achim L. Lilienthal, Hülya Akbiyik, Marco Bonini
The transfer of research results to market-ready products is often a costly and time-consuming process. In order to generate successful products, researchers must cooperate with industrial companies; both the industrial and academic partners need to have a detailed understanding of the requirements of all parties concerned. Academic researchers need to identify the performance indicators for technical systems within a business environment and be able to apply them. In service logistics today, nearly all standardized mass goods are unloaded manually with one reason for this being the undefined position and orientation of the goods in the carrier. A study regarding the qualitative and quantitative properties of goods that are transported in containers shows that there is a huge economic relevance for autonomous systems. In 2008, more than 8,4 billion Twenty-foot equivalent units (TEU) were imported and unloaded manually at European ports, corresponding to more than 331,000 billion single goods items. Besides the economic relevance, the opinion of market participants is an important factor for the success of new systems on the market. The main outcomes of a study regarding the challenges, opportunities and barriers in robotic-logistics, allow for the estimation of the economic efficiency of performance indicators, performance flexibility and soft factors. The economic efficiency of the performance parameters is applied to the parcel robot – a cognitive system to unload parcels autonomously from containers. In the following article, the results of the study are presented and the resultant conclusions discussed.
G
I. INTRODUCTION
lobalization increases the transportation of goods, implying that efficient processes for goods transportation would be a competitive advantage for companies to have. One possibility to create efficient processes is the automation of process chains, but automation within logistics chains faces one of its largest Manuscript received July 25, 2011. This work is supported by EU FP7 in the area of Cognitive Systems and Robotics (ICT-2009.2.1) under Grant Agreement 270350. Prof. Dr.-Ing. Wolfgang Echelmeyer is professor for material flow / logistics at the University of Reutlingen, Alteburgstraße 150, 72762 Reutlingen, Germany, phone: +49 7121-271-3076; e-mail:
[email protected] Dr.-Ing. Alice Kirchheim is senior researcher at Orebro University, Studentgatan 1, 70182 Örebro, Sweden Prof. Dr. Achim L. Lilienthal is professor at Orebro University Studentgatan 1, 70182 Örebro, Sweden Hülya Akbiyik is researcher at Reutlingen University, Alteburgstraße 150, 72762 Reutlingen, Germany Marco Bonini is researcher at Reutlingen University, Alteburgstraße 150, 72762 Reutlingen, Germany
challenges in the handling of randomly packed goods. If it is not possible to develop a system that handles these tasks using existing methods and technology, research projects are often initiated to tackle the problem. The subsequent transfer of research results to market-ready products is frequently a time and cost consuming process. If researchers keep in mind the performance indicators for technical systems in a business environment, it is possible to achieve this purpose with less effort. This paper therefore focuses on performance indicators for autonomous systems in loosely structured environments within logistics. The paper begins by identifying the unloading of goods from containers as a task within logistics, still requiring a high amount of manual labor and also being a highly challenging scenario for automation. Subsequently, a study about the qualitative and quantitative properties of transported goods reveals the economic relevance of employing cognitive systems for this task. The key information from a study about potentials, requirements and challenges for robotics in logistics are summarized to derive performance parameters for cognitive robotics systems in logistics applications. These statements are used to obtain performance parameters, which are applied afterwards to the parcel robot – a cognitive system for unloading cuboid goods. The conclusions are summarized in the final part of the paper. II. AUTOMATION IN LOGISTICS CHAINS Many different definitions exist for logistics with respect to the angle of view [1,2]. All definitions commonly agree that logistics is the planning and implementing of material flow and information flow within a supply chain. This paper sets a focus on service logistics. “Service logistics includes the complete planning, controlling, realization and testing of all institution internal and overlapping flow of goods and personnel” [3]. Typical tasks for the material flow within service logistics are palletizing/de-palletizing, commissioning and loading/unloading of carriers. Among these tasks the automation of unloading is the most challenging due to the undefined position and orientation of goods in the carrier. Typically, goods in containers can be classified by their packaging. They are either transported on pallets, have random packaging, or have standardized packaging. Today, forklifts usually unload palletized goods, further automation cannot promise more economic efficiency. Goods with random packaging may have different dimensions (up to the
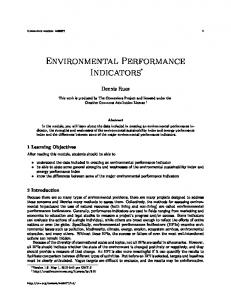
size of the container) and different weights (up to the maximum payload of containers) so that automation may not be economically efficient because individual solutions would be necessary. On the contrary, goods with standardized packaging are often consumable goods; their packaging is within a certain bandwidth regarding both their dimension and weight, making automation a good prospect [4]. A study has been conducted to validate these assumptions about the qualitative and quantitative properties of transported goods [5]. The core statements are communicated in the following section. III. TRENDS IN THE CONTAINER MARKET Global economy goes hand in hand with world trade and builds the foundation of container traffic. There is a positive relationship between three factors, since an increase of the international economy of 3 % leads to a 6 % increase in world trade and a 9 % increase in container traffic [9]. The growing needs in container shipping caused by an increase in the volumes handled worldwide are justified, considering the recent positive development of global economy after the global financial crisis in 2009. The container traffic is mostly handled within three major trade routes: the Transatlantic route between North America and Europe, the Transpacific route between North America and Asia and the Europe-Far East route between Europe and Asia. These are the major routes within the container market, since they connect the countries of the triad with 85% of the worldwide container traffic occurring within these routes, as shown in the figure 1 [10].
Figure 1: Trade routes [10]. In order to gain new information about the recent developments in the container market, a study was made among the market leading shipping companies. The study was conducted on European container traffic with its focus on the contents of containers arriving in European ports and the process of unloading of containers. The main ports within Europe are in Nordrange namely Antwerp, Bremerhaven, Hamburg, Amsterdam and Rotterdam, whereas the study includes the European ports shown in figure 2.
Bremerhaven Hamburg Tilbury Bremen Thamesport RotterdamAmsterdam Southhampton
Zeebrügge Antwerpen Le Havre
Fos-sur-Mer Barcelona
Gioia Tauro
Figure 2: European ports. The target of the study was receiving internal data concerning the contents of containers, which includes the different types and quantities of goods transported within containers to European ports. The survey was conducted through the use of interviews via telephone and e-mail. All data from the three shipping companies was then analyzed. These companies are within the first ten shipping companies in the world ranking. Apart from the internal political decisions of the interviewed companies, other companies were unable to participate in this study due to the technical limitations of their systems. As a result, more than 13 % of total European imports could be analyzed in detail. The method used to generate the qualitative and quantitative statements was based on the information regarding the various kinds and quantities of enterprises. Based on this information, the next analysis step took different types of packaging and geometrical forms into account. Beginning with the available literature and interviews with experts, as well as personal experiences and assumptions, the piece goods were given weights and volumes. The quantitative statements arise from the total amount of goods and the previous qualitative analysis. The following transport packaging is mainly used for the transport of goods in containers and load carriers: • barrels, cylinders, canisters • euro palettes • boxes, cartons • heavy-load carriers, low-load carriers • sacks, bags • large bags • sheds • rolls, coils A thorough examination of the aforementioned transport packaging, regarding its relevance for the process of automatic unloading, shows that only sacks and bags, cartons and tires can be considered for this purpose. These correspond to the cuboid, cylindrical and free geometrical forms. After analyzing the imported goods, about 63.8 % of
the goods in question, those that have been imported in containers, can be automatically unloaded in European ports. The key result of the report stated that 46.7 % of these goods come in boxes of different sizes. Goods in sacks are made up 15.1 %. The proportional amount of cylindrical forms is limited to 0.05 % [5]. These results are shown in figure 3.
Figure 3: Main results of the study [5]. Most boxes arriving in Europe come from the Far East, whereas free-shaped goods are mainly imported from South American countries. The need and feasibility for automatic unloading of containers will be more than justified, considering the imported volumes in European ports measured in Twentyfoot equivalent units (TEU). In 2008, 8.4 billion TEU arrived in European ports that were dedicated for automatic unloading [10]. The potential for such systems is growing with the increasing trade volumes due to globalization and labor division. Within the study it has been attempted to express the amount of imported TEU in the amount of piece goods. Knowing that this analysis is based on several assumptions, there was potentially more than 331,000 billion piece goods unloaded manually [5]. The previous section has identified the economic relevance for automatic systems for unloading containers. A study was conducted because the success of employing such systems in companies is influenced by further factors. The objective is to point out the potential, requirements and challenges for employing robotic systems as an alternative to manual labor. IV. PERFORMANCE INDICATORS FOR AN AUTONOMOUS SYSTEM In 2007, an online survey was conducted, interviewing parties involved in the robotic-logistics market [6]. The study is continuously updated and will be published again in 2011. Most of the participants are from logistics companies, technology suppliers or research institutions. Within this section, core statements were extracted from the study, which form the basis for obtaining performance indicators for cognitive robotics in logistics applications. The study states with respect to:
1) Implementing robots: The main reason not to implement robots is the lack of economic efficiency (50%). Further reasons would include products not being marketready (23 %) and suboptimal basic conditions for robots (23 %). 2) Automation and implementation of robots: More than half of the participants (54 %) stated that automation is important for their institution. 67 % of the participants plan to implement robots within the next five years or further investigate the idea in more detail. The optimal path to automation should be achieved step by step until reaching complete automation (54 %). 3) Barriers, challenges and risks: The participants stated that economic efficiency, cost-benefit ratio and inflexibility are the primary barriers, challenges and risks. Furthermore, a lack of know-how has been highlighted. 4) Places of implementation for robots: Primary places for robot implementation is the unloading/loading and commissioning of goods. One third of the participants evaluated adaptability as major criteria for the implementation of robots. 5) Potential from the implementation of robots: Participants mainly stated three potentials, which are the improvement of process quality, the combination of robots with further technologies (e. g. RFID) and the efficient planning of material flows. The study shows that the most important point for companies is economic efficiency, which has an influence on the decision of whether to implement automation. Therefore, economic efficiency is one performance indicator. Because the economic efficiency of a system is mainly dependent on the machine performance and its costs, machine performance is a second performance indicator. The flexibility of the system is a third performance indicator, derived from the statement regarding the barriers, challenges and risks. The forth performance indicator is a collection of soft factors including increase of process quality and ergonomics of the working area. So, as a result of the study at least four key performance indicators can be derived: 1) Economic efficiency: The economic efficiency is calculated via a comparison of cost method and a net present value method. For details regarding these methods the interested reader is referred to Götze et al. [7]. 2) Engine Performance: The minimum engine necessary to operate the system can be calculated from the parcels per year and per incoming buffer. 3) Flexibility: It is not possible to measure the flexibility of the system in numbers, however estimation of the percentage of goods that can be handled automatically gives guidance. 4) Soft factors: Ergonomics of the working area, safety, process quality. The first two performance indicators are described in detail in this paper. Three scenarios of the cognitive system parcel robot will be developed exemplarily, so that the performance indicators economy efficiency and engine
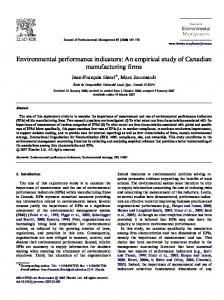
performance can be analyzed and evaluated in the context of a possible application at logistics companies. Within the scenarios, the efficiency of the system is evaluated depending on engine performance (cycle time), meaning that both performance indicators are covered. The other two performance indicators, flexibility and soft factors, are difficult to validate and evaluate. On the one hand, this is due to the fact that it is not possible to make statements about the impact of the development of more flexible piece goods on system cost and performance (cycle time). On the other hand, information and figures about costs of down times are held strictly confidential by the companies, so that a realistic evaluation is difficult to result in accurate statements. Therefore, the analysis within this report is based and focused on the first two performance indicators. V. EVALUATION OF PERFORMANCE INDICATORS FOR AN AUTONOMOUS SYSTEM The performance indicators are evaluated for an application field within logistics that is still challenging for researchers as is the unloading of goods from containers. This is challenging due to the undefined position and orientation of the goods within the restricted workspace, the very low salary level for workers and the requirements for the short period of time for unloading a container. As a cognitive robot (parcel robot) is already available on the market for the specific case of parcels, performance indicators are applied for the unloading of parcels from containers. The parcel robot, shown in figure 4, is a 4-axis kinematic system able to unload containers with a rate up to 500 parcels per hour. Cuboid goods in the range of 200 mm to 600 mm for each edge length and a weight of up to 31.5 kg are suited to be automatically unload through this system. The possibility to extend the parcel robot up to 6-axis kinematic, with modular grippers and a telescopic belt conveyor, gives the system the necessary flexibility in order to reach all parcels positions [8].
The evaluation is restricted to the first two performance indicators economic efficiency and performance. Three typical types of companies were chosen for the evaluation. The values of the parameters necessary to apply the performance indicators are the number of parcels per year and per incoming buffer (P), the operation time in hours per day (O) and the costs of a worker per hour (Cw). By using the number of parcels per year, incoming buffer and the operation time per day, the minimum parcels to be unloaded automatically per hour can be calculated by using an average number of 250 working-days per year. Furthermore, the interest on capital is set to 6 %, the cost for the system (CS) is set to ! 250,000 and the operating costs for the system (CO) is set to ! 4.30 per hour for all three companies. To assure comparable results, all companies have been chosen such that the parcel robot has to unload 330-480 parcels per hour. All companies are representative within the area of service logistics. Company 1 is located in West Germany has a value of 1,200,000 parcels per year and incoming buffer, operation time is 10 hours and the cost of a worker per hour is ! 39. Company 2 represents a company in East Germany, where the costs for workers is far below those in West Germany. The number of parcels per year and incoming buffer is 1,500,000 parcels, the operation time is 18 hours and the costs of a worker per hour is ! 10. Company 3 is located in Canada. The number of parcels is 2,250,000 parcels, the operation time is 20 hours and the costs of a worker is ! 40. An overview of all scenarios is given in Table 1. TABLE 1 SCENARIOS FOR EVALUATION OF PERFORMANCE INDICATORS Parameter P [pcs] O [h] CW [!/h] CS [!] CO [!/h] I [%]
Scenario1 1,200,000 10 39 250,000 4.3 6
Scenario 2 1,500,000 18 10 250,000 4.3 6
Scenario 3 2,250,000 20 40 250,000 4.3 6
The net positive value analysis in Figure 4 shows the difference in pay back period in the three scenarios.
Figure 4: Parcel Robot
!)-$".,/01)$#*23)$45*26,/,$ 7/-8$/5/0*2$/51),-9)5-$.:$;===&$
Figure 7: Break Even Point in number of parcels II.
'$###$###%
The breakeven analysis in Figures 5 and 6 is shown in the number of parcels. It indicates that the breakeven point is reached at 3,487,000 parcels handled per buffer in the first scenario, 10,022,000 parcels in the second scenario and 3,151,000 parcels in the third scenario.
!"#$%&'$
&$"##$###%
&$###$###%
()*+,-./%0&% ()*+,-./%0'% "##$###%
#% #%
!"##$###%
"%
&#%
&"%
'#%
'"%
()*+,$
Figure 5: Net positive value analysis. For company 1, the first scenario, the investment is paid back and becomes profitable in 3 years, for company 2 in 15 years and for company 3 in 1 year and 6 months. 4%$&5"$6$7"#1879"87"7./0$%"12"#&%'$(3" "
!#(" !#'$"
!"#$%"#&%'$(")!*+,"
!#'" ,-."&!!#!!!"
!#&$"
,-."&&$#!!!" ,-."&$!#!!!"
!#&"
,-."&/$#!!!" ,-."'!!#!!!"
!#%$"
0.123456"7%" 0.123456"7&"
!#%"
0.123456"7'"
!#!$" !" !"
VI. CONCLUSION
()*+,-./%01%
&)!!!)!!!" ()!!!)!!!" *)!!!)!!!" +)!!!)!!!" %!)!!!)!!!"%&)!!!)!!!"%()!!!)!!!"%*)!!!)!!!"
-./0$%"12"#&%'$(3"
Several conclusions can be drawn from the evaluation of performance indicators in the previous section: 1) The convenience of automatic systems increases rapidly with the number of parcels suited to being unloaded automatically. For this reason companies in the third scenario can benefit from higher profits from an automatic system than companies in the first scenario. Companies in the third scenario have a payback period of 1 year and 6 months, which is lower than the target payback period of 2 years that is considered to be the cut-off in the decision of whether to make the investment. Companies in the first scenario have a payback period of 3 years, which is beyond this limit, but for companies in this scenario the system could be modified in order to save 10-20% of the initial investment. This would shift the payback period very close to the cut-off of the two years. 2) The convenience of automatic systems increases substantially with the growth of personnel costs. For this reason companies in scenario 2 don’t seem to be suitable for using automatic systems; the extremely low personnel cost in this scenario pushes the payback period far beyond the cut-off of two years (15 years in scenario 2). 3) As mentioned in point 1, automatic systems could be modified in order to save 10-20 % of the initial investment. This saving could be translated into a 10-20 % reduction in the breakeven point in the number of parcels, but is only true if the modifications to the system will not reduce the number of parcels that are suited to be automatically unloaded.
Figure 6: Break Even Point in number of parcels I. ACKNOWLEDGMENT Supported by the European Commission through the Seventh Framework Programme for Research and Development under the Grant Agreement number 270350. REFERENCES [1] [2] [3] [4] [5]
P. R. Murphy and D. Wood, Contemporary Logistics. Prentice Hall, New York, 10th edition, 2010. P. R. Murphy and D. Wood, Logistics Systems: Design and Optimization. Springer US, New York (USA), 1st edition, 2010. H. Baumgarten. (2011, June 10). [Online]. Available: http://logistics.de/downloads/04/84/i_file_45167/Jahrbuch%202002% 20-%20Dienstleistung.pdf A. Kirchheim, Verfahren zur Erkennung von sackförmigen Stückgütern für die automatische Entladung in logistischen Prozessen. Mainz Verlag, Aachen (Germany), 2011. H. Akbiyik, A. Kirchheim and W. Echelmeyer, “Latest Trends in the Container Market”, in Bremer Value Reports, Bremen, vol. 3, 2009
[6]
N. Pfeffermann, W. Echelmeyer and B. Scholz-Reiter, RoboScan’07. Springer-VDI-Verlag, Düsseldorf (Germany), 2007. [7] U. Götze, D. Northcott and P. Schuster, Investment Appraisal: Methods and Models. Springer Verlag, Berlin (Germany), 1st edition, 2007. [8] ThyssenKrupp System Engineering. (2011, June 10). [Online]. Available: http://www.thyssenkruppsystemengineering.com/cms/website.php?id=/587/299/en/productrang e/service/roboticlogistics/parcelrobot.htm [9] B. Lemper and A. Hader, “Entwicklungstendenzen des seewärtigen Welthandels“, in Schriftenreihe der Deutschen Verkehrswissenschaften Gesellschaft e.V., Kiel, 8th Conference, 2001. [10] MDS Transmodal, Supply and Demand in the Container Trades: Global and Regional Trends and Forecasts, Chester, 2007.