Window 1 nurses. Norm(2,3). Window 2 nurses. Norm(4,3). Window 3 nurses. Norm(3,1). Table 5 Pharmacy Resource. Page 7. Page 8. 8. Figure 3 Arena Model ...
Performance Measurement of Queuing System in Felege Hiwot Referral Hospital Shimelis Tilahun1 1
Bahir Dar University, Institute of Technology, School of Mechanical and Industrial Engineering
Abstract: - In order to have high quality service performance in health centers, there must be a management system who can understand the queuing system of the patients. The main aim of this term paper is to show how the health center managers can improve the efficiency of their health service system by reducing the waiting time and unnecessary wastage of resources like human and materials, increase customer satisfaction and increase the effectiveness of the system. Key words:- Waiting time in the queue, Queue system, Performance measurement, Simulation, 1. Introduction From different perspectives it has been observed that in the last two decades the health care sector in Ethiopia has been given attention from the Ethiopian government and health related NGO’s and it is under pressure since the demand for health services is increasing in rapid rate of population increment. In the case company Bahir Dar Felege Hiwot Referral Hospital, there is a limited capacity of facilities that obviously creates a long queues in different service stations of the hospital, and this is due to limited health centers in the town and the available private clinics and hospitals request a lot of money for the customers and patients are prefer to go the government hospital. This choice cost Felege hospital by creating busy service environment and long queue along the waiting room and this case will become the starting point of their problems of the quality decrement in the hospital and customers will suffer by waiting the service while it is the heath case and needs urgent solution. In Service firms especially health care centers, customer satisfaction, performance analysis and improvement model are valuable concepts which should be analyzed during performance measurement studies. This requires computer simulations using arena software to determine resource utilization, bottle neck and optimization of the resources in the system. And it is obvious
that the aim of this paper is to do performance measurement and it’s useful as an approach for obtaining an accurate and meaningful picture of patient flow and helping determine where improvements can be made. 2. Statement of the problem Most of the service companies in Ethiopia, servicing and their resource allocation are not well organized. Besides, by the concept of manufacturing system design the health sectors in Ethiopia also don’t use recent service design tools and requirements to design their service delivery system and the process flows. As a result their service design is so complicated and there is no integration between their compartments. Because of these, their systems require the customer to wait long time to get service which means it has high waiting time and this is due to shortage of professionals. In addition to that our term paper case company Flege Hiwot hospital was undergoing different expansion projects in different times. There is complicated flow process from station to stations and the layout arrangement of the hospital has no clear service system and it creates complicated path to customers due to miss arrangement of the service facilities. And there is unbalanced number of resources to patients because of the amount of servers does not accommodate the existing large amount of customers.
Generally there system creates unfair utilization of resources, unfulfilled service facilities, unbalanced service design. They also have Poor patient history recording systems, which is very valuable for patient perfect medical treatment. 3.
Literature
According to (Obamiro, 2010) Queuing indicates that waiting in line or queue causes inconvenience to economic costs to individuals and organizations. The writer indicates that Hospitals, airline companies, banks, manufacturing firms etc., try to minimize the total waiting cost, and the cost of providing service to their customers. Besides the queuing time, which is the amount of time a person, signal or thing spends before being attended to, or before value adding work is performed to or on it (Ndukwe et al. August 2011). Therefore, speed of service is increasingly becoming a very important competitive parameter. One of the strategic areas of information technology development in the country is health, which acceptance and quick treatment of patients is one of the main components of health care (Neda Darvish, 2011). (Oguntade, 2010) Explained that Analysis of queuing and service times is essential for designing effective congestion control at a service point. (Mohammadi, December 2012) Also a writer indicates how managing healthcare systems play an important role for healthcare providers in order to have high-quality service performance. With respect to service performance (Lambrecht, 2006) define the performance of healthcare systems in terms of patient flow times and utilization of critical resources can be assessed through queuing and simulation models. Performance measurement entails identifying the system goals and the measures by which attainment of the goals are judged. This article principal focus is process planning (representing the steps needed to deliver service and the interactions between process steps), and performance measurement. The reason for these techniques is because it’s widely used to improve the performance of manufacturing,
distribution and transportation systems, and is emerging as promising approaches to improve health care. Basically performance measurement is related with queuing system defined by (Little, 2008) as a "queuing system" consists of discrete objects we shall call "items" that "arrive" at some rate to the "system." Within the system the items may form one or more queues and eventually receive "service" and exit. In addition to that (Ndukwe et al. August 2011) agreed that Queuing theory and its application has gotten very little attention from Heath care operations management. However, health care practice could benefit by understanding and applying some of the theory’s concept. And literatures argue that to be effective, performance measurement should be embedded in the continuing operation of the system, so that key decisions are influenced and evaluated, according to established objectives. According to (fomundam, 2010) In a queuing system, minimizing the time that customers (in healthcare, patients) have to wait and maximizing the utilization of the servers or resources (in healthcare, doctors, nurses, hospital beds, e.g.) are conflicting goals. The writer further discussed about determining server capacity by minimizing the costs in a healthcare queuing system is a special case of system design. (Mostafa et al. Oct 14, 2012) also argue that with increasing demand and shortage of resources, waiting time is an inevitable problem in all clinical fields. And most of literatures concluded their work by writing the following sentence. As long as increasing the productivity of healthcare organizations remains important, analysts will seek to apply relevant models to improve the performance of healthcare processes (Fomundam, 2010). Generally the performance of healthcare systems in terms of patient flow times and utilization of critical resources can be accessed through queuing simulation models.
4. Theoretical Perspectives All entities that are in need of service of some kind will be referred to as customers
while the service is performed in service stations. Customers are calling population. Once they are in need of service, they will approach the service system, where they will line up. When it is customers turn, He/she will be served, after which the customer will leave the service system and rejoin the calling population. In this paper case we have M/M/C queuing model which it assumes that the service is provided by n servers operating independently of each other. This modification is natural since if the mean arrival rate is greater than the service rate the system will not be stable, that is why the number of servers should be increased. 5. Methodology In Bahir Dar Referral hospital in different departments, over two weeks (14 days) data was collected about arrival times, time service begins, time service ends, and departure time of over 100 patients. And this data will help to simulate the results using arena simulation software. 6. Data collection and analysis A. Data collection Both Primary and secondary data collection methodologies has been used in addition to Observation and Interview. In the observation part it has been seen that:A. How the process are organized and prioritized B. Number of queues C. Arrival time of customers D. Allocation of workers E. Queue structure and so on. Obviously from the observation it is clear that there is no performance analysis study has been done before this time from any
researcher in the case study place Felege Hiwot referral hospital. the hospital have no formal performance measurement system but they have monthly report that used checking the performance of the service stations as whole by comparing with key performance indicators (KPI) as reference or standard. Felege Hiwot referral hospital has a plan of 700pateints per day but it is serve 750 patients per day. This indicates that there arrival rate is greater than the existing service rate. This shows that the numbers of customers are more than the plan of the hospital. For this reason the length of queue are always long and there is more amount of backlog and also long Appointment time of patients. For the last six months emergency service stations were served for the amount of 10,800 patients and the amount of anti-natal service were 600. And also anti HIV care were the amount of 250- 300 patients per day. There are 25 main service stations and 12 supportive service stations in Felege Hiwot referral hospital. The supportive service stations are the service stations which had not full service facilities and not organized. The main service stations are which have organized service facilities and can serve more customers. Some of the service stations are: emergency, card room, triage, laboratory, pharmacy, antenatal, OPD, radiology, x-ray room. In Felege Hiwot referral hospital managers assume that the total amount of one patient spend from gate in to hospital system up to gate doctor service averagely 2hr. but in the real situation any patient spend more time to gate service with exception of some type of treatment can spend more time for the nature of disease for example CD4 require at least 6 hours, culture is required 2weeks for laboratory. But the standard of one patient spend 40minute from hospital’s door to gate doctors service. Specially card room, laboratory and emergency sections have long queues during morning session and relatively decrease afternoon session. But card room has the longest queues most of the hospital working
hours. Main reasons that created long queues in the service stations are: Complex service system They have been used traditional service system Slow service system Less employee skill The hospital management believes that each individual’s performance is measured in every month and in each quarter season by comparing the performance with sated key performance indicators (sated target) and apply survey and the giving solution. The hospitals management assigns every professionals according to professionals based and generalist. Professionals based individuals cannot rotate while generalists can rotate and give services for different sections. Managers has taking measure to solve the long queues problems by the following ways 1. Giving training to employees 2. By expanding the service stations 3. Create awareness for the service system Through BPR, the Ministry of Health has set a stretch objective that „any patient with the need for emergency treatment should be provided with the service within 5 minutes of arrival at the hospital”. The proportion of emergency patients who undergo triage within 5 minutes is one of the Keys Performance Indicators that should be reported by hospitals to their Governing Board. B. Analysis Sample data was collected from the four main service stations in the hospital. That is selected working stations for this research to analyze the performance of the hospital system by considering those work stations as the bottleneck for the performance of the existing hospital. In addition to that this work stations are selected due to the reason that they have long queue in day to day activity and most of patients in this hospital is used these service stations. The main calculated data are mean time of the service system of queue and mean time for service stations. The collected data average time of that spends in queue and service system are below table 1.
Service station Emergency Department Carding room Laboratory
Type of time Mean time in loss minute Waiting time 121.94 Service time 16.685 Waiting time 56.6 Service time 9.3 Waiting time 12.965 Service time 8.8 Pharmacy Waiting 2.755 Time Service Time 10.94 Total Time That Consume 239.985 Through these stations Table 1 waiting time for queues and service in each service station
Figure 1 waiting time for queues and service in each service station The total average time that a patient would spend to complete the service system of those four major service stations in Felege Hiwot referral hospital is around 239.985/60 =3.99975 which is almost 4 hours. But Felege Hiwot referral hospital’s management bodies assumed to be the total amount of time that one patient spend from the initial point (from patient arrival) to get doctor’s service averagely 2hours. This shows that the plan is very small or half of the real one. In the real situation any patients spend more time to gate service more than the exception.
7. Reviewing the existing system A. Emergency department (ED):
Patient Arrival
Card According to the observed data average waiting time (or mean) in the service queue of the emergency OPD department is 121.94minutes (2hr and 2min). And also the average service time of emergency department is 16.685minutes (16min. Decision and 41 seconds).Pharmac Therefore y the total average time that any patient waits to complete the service in the emergency department is estimated as 2huors and18min (138.625minutes). In this department Laboratory the amount of service time is increased due to the queuing of the card room and others supportive Pharmacy Decision One patient that come in to the departments. emergency service system and seeing by Bed or Admin emergency physician Doctor in order to get the service the patient’s relatives should be take the Apointment patients card from the card room. This is incurred long time to take the cared from the card room with cash its finance. This and other problems like losing of patients cared, loss of referral papers and waiting of card from card room to emergency and so on problems are the main causes of longest queue time in this service system.
B. Card room: From the collected data average waiting time in the queue of the carding room is 56min and 36seconds. And also the average service time of carding room is 9min. and 18 seconds. Therefore the total average time that any patient waits to complete the service of carding room is estimated as 1huors and 6min. This longest time creates dissatisfaction in the customers and reduces the efficiency and effectiveness of the hospital service system. So that the department is required the longest time to complete the service system due to different reasons such as higher amount of queue, traditional work practice in the system, shortage of server and use traditional recording system. C. Laboratory: Average waiting time in the queue of the laboratory is 12min. and 58 seconds. And also the average service time of laboratory is 8min. and 48 seconds. Therefore the total average time that every patient waits to complete the service in the laboratory is estimated as 21min. and46 seconds. D. Pharmacy: -
Average waiting time in the queue of the pharmacy is 2min. and 45 seconds. And also the average service time of emergency department is 10min. and 56 seconds. Therefore the total average time that every patient waits to complete the service in the emergency department is estimated as 13min. and 42 seconds. 7.2. Characteristics of queuing in Felege Hiwot referral hospital service system A queue system of Felege Hiwot referral hospital service stations are consists of customers whether who have a certain arrival pattern and arrivals without any pattern, and are served at a station consisting of a number of servers with a specific service pattern. In this respect, it has been seen that a basic queuing system, that are applicable in these different service stations are both single service and multiple service stations. Generally the patient flow in Felege Hiwot hospital looks like the following figure.
Figure 2 patient flow in Felege Hiwot hospital
8. Simulation A simulation of a system is the operation of a model of the system that is whether existing or improved system. The operation of the model can be studying, and hence, properties concerning the behavior of the actual system or its subsystem can be inferred. In its broadest sense, simulation is a tool to evaluate the performance of a service system, existing or proposed, under different configurations of interest and over long period of real time Simulation is used to measure the performance of the service system before an existing system is altered or a new system built, to reduce the chance of failure to meet specifications, to eliminate unforeseen bottlenecks, to prevent under or over-utilization of resources, and to optimize the system performance. The researcher has to simulate the existing service system to measure the system performance and to identify the bottle neck on the system service and to identify the resource utilization in the service system. After evaluating the existing system service, it helps to decide whether the system is need for improvement or not. 8.1. Simulation model The simulation models consist of the following components: such as system entities such as server and queue, input variables, performance measures, and functional relationships. In the case of a simulation model of an M/M/C queue, the server and the queue are system entities; arrival rate and service rate input variables, mean wait time and maximum queue length are performance measures, and ‘time in system = wait time + service time’ is one of functional relationship. Almost all simulation software packages provide constructs to model each of the above components. Modeling is arguably the most important part of a simulation study. Indeed, a simulation study is as good as the simulation model. For the simulation purpose the collected data is organized in the following tables below. Item
Place
Patients arrival Greeting for OPD Interview Interview Assessment Holding area Patients Arrival Registration for card room Registration Holding area Finance Holding Area Waiting for Holding Area Porter Patent arrival Receiving prescription for pharmacy Reading Holding area Prescription Searching Drug Holding area Patient arrival Reading lab request for Laboratory Receiving Operation specimen Waiting for Holding area response Result Operation announcement Table 2 Organized data wrt their Item and place Resource Dr 1 and nurses Dr 2 and nurses Dr 3 and nurses Dr 4 and nurses Table 3 Dr Resource Resource Microscope blood smear machine CBC test machine Table 4 Lab Resource
Process time Norm(8,3) Norm(6,4) Norm(5,2) Norm(7,3)
Process time Tria(2, 3.5, 7.3) Tria(0.15, 0.23, 2.98) Norm(7.5, 2.8
Resource Process time Window 1 nurses Norm(2,3) Window 2 nurses Norm(4,3) Window 3 nurses Norm(3,1) Table 5 Pharmacy Resource
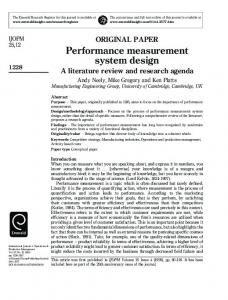
Figure 3 Arena Model
8
Figure 4 Arena Model
9
Figure 5 3D max Model
10
Fixing global variables Time between arrivals in OPD Time between arrivals in laboratory Time between arrivals in pharmacy Time between arrivals in carding Parameters Time between arrivals in OPD is in poison distribution with mean value of 1.97 Time between arrivals in Laboratory is in poison distribution with mean value of 0.23 Time between arrivals in Pharmacy is in poison distribution with mean value of 0.15 Time between arrivals in Carding is in poison distribution with mean value of 0.2 Simulation running set up The simulation model running parameters are settled using assumptions. Number of replication =1 Simulation start date Wednesday/June/11/6/2014/ at 6:48:30 Replication length is with for one week which is 7 days and it’s known that the hospital works for 24 hours per day. Simulation selected results for the settled running parameters Time Information
Waiting Time
desk.Queue OPD Doc
53.81 2482.86
1.Queue OPD
Doc
4629.48
2.Queue Process 10.Queue Window 1.Queue Window 2.Queue
4222.37 2794.26 3890.64
Recourses Dr 1 and nurses
Utilization Number of busy 0.9973 2.9918
Dr 2 and nurses
0.9954
2.9861
Informer
0.9914
0.9914
Nurse 1 in window 1
0.9952
2.9856
Nurse 2 in window 2
0.9952
1.9905
Nurse 3 in window 3
0.996
2.9879
Table 6 Recourse utilization factor From the above results we can infer results using the given simulating time, and based on that the total number of patients flow in to get service in Felege Hiwot hospital is 173,430 patients and from those numbers of patients 135 520 are coming out from the stations getting service and in average 19,320.57 patients are in work in process or they are in the process getting services. While doing that the utilization of resources is beyond the resources capacity and they are all above 99%.but when we see form the results the waiting time in the queue in the OPD doctor service station is around 2482.856 patients for Dr 1 and for Dr 2 is 4629.482 because of their performance rate different their queue becomes different. This result infers us that the hospital managers should increase the resource capacity but we have to see how the managers to increase their resource and by how much to cope up with the increasing demand of patients flowing in increasing in every time of working day of the hospital. This is done by using different scenarios by the process analyzer part of arena simulation software.
11
Scen
D
D
win
win
win
OPD
ario nam
R
r2
dow
dow
dow
1
2
3
1
9
9
Dr 1 dr 2 waiti Wait ng ing time ----time
1
e Scen
2
1
ario Scen 3 3 3 2 3 2 ario Scen 5 2 2 8 8 1 ario Scen 8 4 4 7 6 3 ario Table 7 Scenario comparison table 4
OPD
wind
Win
DR 1
Dr2
Win
Win
Win
Utiliz ation
Utiliz ation
dwo
dow
dow
1
2
3
0
0
0
0.68
0.99
0.995
0.99
7 0.99
4 0.99
0
5 0
5 0.99
6 0.74
0.74
4 0.85
6 0.99
7
3
6
2482
4629
ow 1 dow waiti 2 ng waiti ng --1.81 time time 2 2794 3890
.856 2382
.482 ---
.256 ---
.638 369.
.671 1586
5455
3534
992 2859
.949
.361
.851
.917
As we can see from the above scenario table 5 ,we can conclude that when the number of Doctors in the OPD service station increases from 5 to 8 that is from scenario 3 to scenario 4 the waiting time in the queue for OPD Dr1 working station is decreased from 2382.671 to 1586.949 and their utilization is become fair and it’s around 74.8% which means the doctor can get time and deliver a quality service for his patients while comparing it in scenario 1 which was 99.7 % which means the doctor is almost 100% busy and he cannot deliver his service perfectly because of his busyness. We can correlate this analysis with farming ox if the farmer uses his ox day to day farming activity through morning to night without rest we can say that the farmer use his ox in 100% bet if the farmer has no any ox to help the one who is tired the ox will lose his potential and will die and the farmer will lose his valuable asset. So the hospital doctors need time
0.997
0.599
0.748
0.749
to rest and do their job in relaxed mood while the increased service demand is not giving them any title condition to do that so as scenario 4 indicated we can use their 100% potential by increasing the amount of doctors into 8 and we have seen the result when it gives them time to give a quality service. Conclusion For identifying problems and improving performance of health care centers simulation is very important and key for their development in quality service delivering. And this Paper shows that simulation is an efficient tool for objectives settled to increase performance and it indicates that the simulation model is valuable to present the current work flow and to predict the bottleneck in healthcare systems. The simulation model is developed to demonstrate the queueing system in Felege Hiwot hospital specially to identify stations which are the main bottlenecks for the longer stay 12
of patients in the hospital. The output of the simulation shows the analysis result with a verity of formation. Reference 1. John D.C. Little, Stephen C. Graves Little's Law [Book Section] // Operations Management Models and Principles / book auth. Little John D.C.. Massachusetts : Massachusetts Institute of Technology, 2008.
6. Neda Darvish Mahnaz Vaezi modeling and scheduling intelligent method’s application in increasing hospitals’ efficiency [Report]. - Tehran : Journal of Theoretical and Applied Information Technology, 2011.
7. Obamiro John Kolade Queuing Theory and Patient Satisfaction: An Overview of Terminology and Application in Ante-Natal Care Unit [Journal]. - [s.l.] : Economic Sciences, 2010. - Vol. LXII.
2. Lambrecht Stefan Creemers and Marc R. Modeling a healthcare system as a queueing network:The case of a Belgian hospital [Report]. [s.l.] : department of decision sciences and information management, 2006.
8. Oguntade F.O. Ogunfiditimi and E.S. Queueing and Service Patterns in a University Teaching Hospital [Journal]. - Abuja : Nigerian Journal of Basic and Applied Science , 2010. - 0794-5698 : Vol. 18(2).
3. Mohammadi Shamohammad Queuing Analytic Theory Using WITNESS imulation in Hospital Pharmacy [Journal]. - [s.l.] : International Journal of Engineering & Technology, December 2012. 06 : Vol. 12.
9. Samuel Fomundam Jeffrey Herrmann a survey of Queuing Theory applications in healthcare [Report]. - Maryland : The institute for systems research, 2010.
4. Mostafa Alavi-Moghaddam,1 Reza Forouzanfar,1,* Shahram Alamdari,1 Ali Shahrami,1 Hamid Kariman,1 Afshin Amini,1 Shokooh Pourbabaee,1 and Armin Shirvani2 Application of Queuing Analytic Theory to Decrease Waiting Times in Emergency Department: Does it Make Sense? [Journal]. Tehran, IR Iran : Kowsar Medical Institute, Oct 14, 2012. - 10.5812/atr.7177 : Vol. 1(3). 5. Ndukwe H. C., Omale S, Opanuga O. O Reducing queues in a Nigerian hospital pharmacy [Journal]. - Jos, Plateau : African Journal of Pharmacy and Pharmacology, August 2011. 10.5897/AJPP11.015 : Vol. 5(8). Index 1. ; ; ; ;
Model statements for module:
BasicProcess.Create 1 (Patient arrival)
34$ CREATE, 1.5,MinutesToBaseTime(0.0),Patient:MinutesToBaseTime(POIS( 1.97)):NEXT(35$);
13
35$ 1:NEXT(0$);
ASSIGN:
Patient arrival.NumberOut=Patient arrival.NumberOut +
; ; ; Model statements for module: BasicProcess.Record 1 (Automatic Patient arrival record) ; 0$ COUNT: Automatic Patient arrival record,EntitiesIn(Patient):NEXT(1$); ; ; ; ; 1$
Model statements for module: ASSIGN:
BasicProcess.Process 1 (Information desk)
Information desk.NumberIn=Information desk.NumberIn + 1: Information desk.WIP=Information desk.WIP+1; 1:Save:NEXT(41$);
67$
STACK,
41$ 40$
QUEUE, SEIZE,
Information desk.Queue; 2,Tran: Informer,1:NEXT(39$);
39$
DELAY:
POIS(1.97),,Tran:NEXT(82$);
82$ ASSIGN: Diff.WaitTime; 46$ TALLY: 83$ ASSIGN: Diff.WaitCost; 44$ TALLY: 48$ TALLY: 49$ TALLY:
Information desk.WaitTime=Information desk.WaitTime +
86$ 1:
Information desk.NumberOut=Information desk.NumberOut +
Information desk.WaitTimePerEntity,Diff.WaitTime,1; Information desk.WaitCost=Information desk.WaitCost +
Information desk.WaitCostPerEntity,Diff.WaitCost,1; Information desk.TotalTimePerEntity,Diff.StartTime,1; Information desk.TotalCostPerEntity, Diff.WaitCost + Diff.VACost + Diff.NVACost + Diff.TranCost + Diff.OtherCost,1; 72$ ASSIGN: Information desk.TranTime=Information desk.TranTime + Diff.TranTime; 73$ TALLY: Information desk.TranTimePerEntity,Diff.TranTime,1; 77$ ASSIGN: Information desk.TranCost=Information desk.TranCost + Diff.TranCost; 74$ TALLY: Information desk.TranCostPerEntity,Diff.TranCost,1; 38$ RELEASE: Informer,1; 87$ STACK, 1:Destroy:NEXT(86$); ASSIGN:
Information desk.WIP=Information desk.WIP-1:NEXT(33$); ; ; ; ; 33$ ; ; ; ;
Model statements for module: DELAY:
AdvancedProcess.Delay 15 (Waitng)
UNIF( 2 , 8 ),,Wait:NEXT(2$);
Model statements for module:
BasicProcess.Dispose 1 (Go out holding entry card)
14
2$ ASSIGN: card.NumberOut + 1; 89$ DISPOSE: ; ; ; ;
Go out holding entry card.NumberOut=Go out holding entry Yes;
Model statements for module:
BasicProcess.Create 3 (Pateint arrive for OPD)
90$ CREATE, 1,MinutesToBaseTime(0.0),Patient:MinutesToBaseTime(POIS(TBA for OPD)):NEXT(91$); 91$ ASSIGN: Pateint arrive for OPD.NumberOut=Pateint arrive for OPD.NumberOut + 1:NEXT(20$); ; ; ; ; 20$ ; ; ; go?) ; 11$
; ; ; ; 10$
Model statements for module: DELAY:
NORM( 35 , 15 ),,Other:NEXT(11$);
Model statements for module: BRANCH,
BasicProcess.Decide 2 (Where the patient shall
1: With,(50)/100,10$,Yes: With,(50)/100,7$,Yes: Else,20$,Yes;
Model statements for module: ASSIGN:
AdvancedProcess.Delay 4 (Calling Delay)
BasicProcess.Process 8 (OPD Doc 1)
OPD Doc 1.NumberIn=OPD Doc 1.NumberIn + 1: OPD Doc 1.WIP=OPD Doc 1.WIP+1; 1:Save:NEXT(99$);
125$
STACK,
99$ 98$
QUEUE, SEIZE,
OPD Doc 1.Queue; 2,VA: Dr 1 and nurses,3:NEXT(97$);
97$
DELAY:
Normal(8,3),,VA:NEXT(140$);
140$ 104$ 141$ 102$ 106$ 107$
ASSIGN: TALLY: ASSIGN: TALLY: TALLY: TALLY:
OPD Doc 1.WaitTime=OPD Doc 1.WaitTime + Diff.WaitTime; OPD Doc 1.WaitTimePerEntity,Diff.WaitTime,1; OPD Doc 1.WaitCost=OPD Doc 1.WaitCost + Diff.WaitCost; OPD Doc 1.WaitCostPerEntity,Diff.WaitCost,1; OPD Doc 1.TotalTimePerEntity,Diff.StartTime,1; OPD Doc 1.TotalCostPerEntity, Diff.WaitCost + Diff.VACost + Diff.NVACost + Diff.TranCost + Diff.OtherCost,1; 130$ ASSIGN: OPD Doc 1.VATime=OPD Doc 1.VATime + Diff.VATime; 131$ TALLY: OPD Doc 1.VATimePerEntity,Diff.VATime,1; 135$ ASSIGN: OPD Doc 1.VACost=OPD Doc 1.VACost + Diff.VACost; 132$ TALLY: OPD Doc 1.VACostPerEntity,Diff.VACost,1; 96$ RELEASE: Dr 1 and nurses,3; 145$ STACK, 1:Destroy:NEXT(144$);
15
144$
; ; ; ; 3$
ASSIGN:
OPD Doc 1.NumberOut=OPD Doc 1.NumberOut + 1: OPD Doc 1.WIP=OPD Doc 1.WIP-1:NEXT(3$);
Model statements for module:
BasicProcess.Decide 1 (Where the patient go?)
BRANCH,
1: With,(50)/100,147$,Yes: Else,148$,Yes; 147$ ASSIGN: Where the patient go?.NumberOut True=Where the patient go?.NumberOut True + 1:NEXT(30$); 148$ ASSIGN: Where the patient go?.NumberOut False=Where the patient go?.NumberOut False + 1:NEXT(31$); ; ; ; ; 30$ ; ; ; ; 4$ 149$ ; ; ; ; 31$ ; ; ; ; 5$ 1; 150$ ; ; ; ; 7$
Model statements for module: DELAY:
BasicProcess.Dispose 2 (Go to Pharmacy)
Go to Pharmacy.NumberOut=Go to Pharmacy.NumberOut + 1; Yes;
Model statements for module: DELAY:
for Drag)
5,,VA:NEXT(4$);
Model statements for module: ASSIGN: DISPOSE:
AdvancedProcess.Delay 12 (Prescription
AdvancedProcess.Delay 13 (Prescription for Lab)
5,,VA:NEXT(5$);
Model statements for module:
BasicProcess.Dispose 4 (Go to Laboratory)
ASSIGN:
Go to Laboratory.NumberOut=Go to Laboratory.NumberOut +
DISPOSE:
Yes;
Model statements for module: ASSIGN:
BasicProcess.Process 3 (OPD Doc 2)
OPD Doc 2.NumberIn=OPD Doc 2.NumberIn + 1: OPD Doc 2.WIP=OPD Doc 2.WIP+1; 1:Save:NEXT(154$);
180$
STACK,
154$ 153$
QUEUE, SEIZE,
OPD Doc 2.Queue; 2,VA: Dr 2 and nurses,3:NEXT(152$);
152$
DELAY:
HoursToBaseTime(Normal(6,4)),,VA:NEXT(195$);
16
195$ 159$ 196$ 157$ 161$ 162$
ASSIGN: TALLY: ASSIGN: TALLY: TALLY: TALLY:
OPD Doc 2.WaitTime=OPD Doc 2.WaitTime + Diff.WaitTime; OPD Doc 2.WaitTimePerEntity,Diff.WaitTime,1; OPD Doc 2.WaitCost=OPD Doc 2.WaitCost + Diff.WaitCost; OPD Doc 2.WaitCostPerEntity,Diff.WaitCost,1; OPD Doc 2.TotalTimePerEntity,Diff.StartTime,1; OPD Doc 2.TotalCostPerEntity, Diff.WaitCost + Diff.VACost + Diff.NVACost + Diff.TranCost + Diff.OtherCost,1; 185$ ASSIGN: OPD Doc 2.VATime=OPD Doc 2.VATime + Diff.VATime; 186$ TALLY: OPD Doc 2.VATimePerEntity,Diff.VATime,1; 190$ ASSIGN: OPD Doc 2.VACost=OPD Doc 2.VACost + Diff.VACost; 187$ TALLY: OPD Doc 2.VACostPerEntity,Diff.VACost,1; 151$ RELEASE: Dr 2 and nurses,3; 200$ STACK, 1:Destroy:NEXT(199$); 199$
ASSIGN:
; ; ; ;
OPD Doc 2.NumberOut=OPD Doc 2.NumberOut + 1: OPD Doc 2.WIP=OPD Doc 2.WIP-1:NEXT(3$);
Model statements for module:
BasicProcess.Create 4 (Patients Arrive for Card)
202$ CREATE, 1,MinutesToBaseTime(0.0),Patient:MinutesToBaseTime(POIS(TBA FOR CARD)):NEXT(203$); 203$ ASSIGN: Patients Arrive for Card.NumberOut=Patients Arrive for Card.NumberOut + 1:NEXT(21$); ; ; ; ; 21$
Model statements for module:
; ; ; ; 6$
Model statements for module:
DELAY:
ASSIGN:
AdvancedProcess.Delay 5 (Verify to card)
EXPO(6),,Other:NEXT(6$);
BasicProcess.Process 2 (Rigistration)
235$
STACK,
Rigistration.NumberIn=Rigistration.NumberIn + 1: Rigistration.WIP=Rigistration.WIP+1; 1:Save:NEXT(207$);
207$
DELAY:
Uniform(1.5,4.5),,NVA:NEXT(216$);
216$ 217$
TALLY: TALLY:
254$
ASSIGN:
Rigistration.TotalTimePerEntity,Diff.StartTime,1; Rigistration.TotalCostPerEntity, Diff.WaitCost + Diff.VACost + Diff.NVACost + Diff.TranCost + Diff.OtherCost,1; 240$ ASSIGN: Rigistration.NVATime=Rigistration.NVATime + Diff.NVATime; 241$ TALLY: Rigistration.NVATimePerEntity,Diff.NVATime,1; 245$ ASSIGN: Rigistration.NVACost=Rigistration.NVACost + Diff.NVACost; 242$ TALLY: Rigistration.NVACostPerEntity,Diff.NVACost,1; 255$ STACK, 1:Destroy:NEXT(254$); Rigistration.NumberOut=Rigistration.NumberOut + 1: Rigistration.WIP=Rigistration.WIP-1:NEXT(22$);
;
17
; ; ; 22$
; ; ; ; 27$ ; ; ; ; 23$ 259$ ; ; ; ; 28$ ; ; ; ; 24$ 260$ ; ; ; ; 29$ ; ; ; ; 25$ 261$ ; ; ; ; 26$ 1; 262$
Model statements for module: BRANCH,
1: With,(50)/100,27$,Yes: With,(50)/100,28$,Yes: With,(50)/100,29$,Yes: With,(1)/100,26$,Yes: Else,21$,Yes;
Model statements for module: DELAY:
AdvancedProcess.Delay 11 (Porter For OPD)
30,,VA:NEXT(25$);
Model statements for module: ASSIGN: DISPOSE:
BasicProcess.Dispose 9 (Admitting)
Admitting.NumberOut=Admitting.NumberOut + 1; Yes;
Model statements for module: DELAY:
AdvancedProcess.Delay 10 (Porter For Admitting)
30,,NVA:NEXT(24$);
Model statements for module: ASSIGN: DISPOSE:
BasicProcess.Dispose 8 (Emergency Room)
Emergency Room.NumberOut=Emergency Room.NumberOut + 1; Yes;
Model statements for module: DELAY:
AdvancedProcess.Delay 9 (Porter For Emergency)
30,,NVA:NEXT(23$);
Model statements for module: ASSIGN: DISPOSE:
BasicProcess.Decide 5 (Where To Go)
BasicProcess.Dispose 10 (OPD)
OPD.NumberOut=OPD.NumberOut + 1; Yes;
Model statements for module:
BasicProcess.Dispose 11 (No Service Given)
ASSIGN:
No Service Given.NumberOut=No Service Given.NumberOut +
DISPOSE:
Yes;
18
; ; ; ;
Model statements for module:
BasicProcess.Create 5 (Patient arrival for Pharma)
263$ CREATE, 1,MinutesToBaseTime(0.0),Patient:MinutesToBaseTime(POIS(TBA for Pharmacy)):NEXT(264$); 264$ ASSIGN: Patient arrival for Pharma.NumberOut=Patient arrival for Pharma.NumberOut + 1:NEXT(19$); ; ; ; ; 19$
Model statements for module:
; ; ; ; 12$
Model statements for module:
; ; ; ; 8$
Model statements for module:
DELAY:
BRANCH,
ASSIGN:
AdvancedProcess.Delay 3 (Delay Verification)
HoursToBaseTime(NORM( 1 , 0.23 )),,Other:NEXT(12$);
BasicProcess.Decide 3 (Verify)
1: With,(25)/100,8$,Yes: With,(50)/100,14$,Yes: With,(25)/100,13$,Yes: Else,19$,Yes;
BasicProcess.Process 4 (Window 1)
Window 1.NumberIn=Window 1.NumberIn + 1: Window 1.WIP=Window 1.WIP+1; 1:Save:NEXT(272$);
298$
STACK,
272$ 271$
QUEUE, SEIZE,
Window 1.Queue; 2,VA: Nurse 1 in window 1,3:NEXT(270$);
270$
DELAY:
Normal(2,1.3),,VA:NEXT(313$);
313$ 277$ 314$ 275$ 279$ 280$
ASSIGN: TALLY: ASSIGN: TALLY: TALLY: TALLY:
317$
ASSIGN:
Window 1.WaitTime=Window 1.WaitTime + Diff.WaitTime; Window 1.WaitTimePerEntity,Diff.WaitTime,1; Window 1.WaitCost=Window 1.WaitCost + Diff.WaitCost; Window 1.WaitCostPerEntity,Diff.WaitCost,1; Window 1.TotalTimePerEntity,Diff.StartTime,1; Window 1.TotalCostPerEntity, Diff.WaitCost + Diff.VACost + Diff.NVACost + Diff.TranCost + Diff.OtherCost,1; 303$ ASSIGN: Window 1.VATime=Window 1.VATime + Diff.VATime; 304$ TALLY: Window 1.VATimePerEntity,Diff.VATime,1; 308$ ASSIGN: Window 1.VACost=Window 1.VACost + Diff.VACost; 305$ TALLY: Window 1.VACostPerEntity,Diff.VACost,1; 269$ RELEASE: Nurse 1 in window 1,3; 318$ STACK, 1:Destroy:NEXT(317$); Window 1.NumberOut=Window 1.NumberOut + 1: Window 1.WIP=Window 1.WIP-1:NEXT(9$);
19
; ; ; ; 9$ 320$ ; ; ; ; 14$
Model statements for module: ASSIGN: DISPOSE:
Go Out.NumberOut=Go Out.NumberOut + 1; Yes;
Model statements for module: ASSIGN:
BasicProcess.Dispose 6 (Go Out)
BasicProcess.Process 10 (Window 3)
Window 3.NumberIn=Window 3.NumberIn + 1: Window 3.WIP=Window 3.WIP+1; 1:Save:NEXT(324$);
350$
STACK,
324$ 323$
QUEUE, SEIZE,
Window 3.Queue; 2,VA: Nurse 3 in window 3,3:NEXT(322$);
322$
DELAY:
Normal(3,0.5),,VA:NEXT(365$);
365$ 329$ 366$ 327$ 331$ 332$
ASSIGN: TALLY: ASSIGN: TALLY: TALLY: TALLY:
369$
ASSIGN:
Window 3.WaitTime=Window 3.WaitTime + Diff.WaitTime; Window 3.WaitTimePerEntity,Diff.WaitTime,1; Window 3.WaitCost=Window 3.WaitCost + Diff.WaitCost; Window 3.WaitCostPerEntity,Diff.WaitCost,1; Window 3.TotalTimePerEntity,Diff.StartTime,1; Window 3.TotalCostPerEntity, Diff.WaitCost + Diff.VACost + Diff.NVACost + Diff.TranCost + Diff.OtherCost,1; 355$ ASSIGN: Window 3.VATime=Window 3.VATime + Diff.VATime; 356$ TALLY: Window 3.VATimePerEntity,Diff.VATime,1; 360$ ASSIGN: Window 3.VACost=Window 3.VACost + Diff.VACost; 357$ TALLY: Window 3.VACostPerEntity,Diff.VACost,1; 321$ RELEASE: Nurse 3 in window 3,3; 370$ STACK, 1:Destroy:NEXT(369$);
; ; ; ; 13$
Window 3.NumberOut=Window 3.NumberOut + 1: Window 3.WIP=Window 3.WIP-1:NEXT(9$);
Model statements for module: ASSIGN:
BasicProcess.Process 9 (Window 2)
Window 2.NumberIn=Window 2.NumberIn + 1: Window 2.WIP=Window 2.WIP+1; 1:Save:NEXT(375$);
401$
STACK,
375$ 374$
QUEUE, SEIZE,
Window 2.Queue; 2,VA: Nurse 2 in window 2,2:NEXT(373$);
373$
DELAY:
Normal(4,1.6),,VA:NEXT(416$);
416$ 380$ 417$ 378$ 382$ 383$
ASSIGN: TALLY: ASSIGN: TALLY: TALLY: TALLY:
Window 2.WaitTime=Window 2.WaitTime + Diff.WaitTime; Window 2.WaitTimePerEntity,Diff.WaitTime,1; Window 2.WaitCost=Window 2.WaitCost + Diff.WaitCost; Window 2.WaitCostPerEntity,Diff.WaitCost,1; Window 2.TotalTimePerEntity,Diff.StartTime,1; Window 2.TotalCostPerEntity, Diff.WaitCost + Diff.VACost + Diff.NVACost + Diff.TranCost + Diff.OtherCost,1;
20
406$ 407$ 411$ 408$ 372$ 421$
ASSIGN: TALLY: ASSIGN: TALLY: RELEASE: STACK,
Window 2.VATime=Window 2.VATime + Diff.VATime; Window 2.VATimePerEntity,Diff.VATime,1; Window 2.VACost=Window 2.VACost + Diff.VACost; Window 2.VACostPerEntity,Diff.VACost,1; Nurse 2 in window 2,2; 1:Destroy:NEXT(420$);
420$
ASSIGN:
Window 2.NumberOut=Window 2.NumberOut + 1: Window 2.WIP=Window 2.WIP-1:NEXT(9$);
; ; ; ;
Model statements for module:
BasicProcess.Create 6 (Patient Arrival For Lab)
423$ CREATE, 1,MinutesToBaseTime(0.0),Patient:MinutesToBaseTime(POIS(TBA for Laboratory)):NEXT(424$); 424$ ASSIGN: Patient Arrival For Lab.NumberOut=Patient Arrival For Lab.NumberOut + 1:NEXT(17$); ; ; ; ; 17$
Model statements for module: DELAY:
AdvancedProcess.Delay 2 (Specimen)
NORM( 5, 2.25 ),,Other:NEXT(18$);
; ; ; Model statements for module: BasicProcess.Process 11 (Laboratory Operatoion) ; 18$ ASSIGN: Laboratory Operatoion.NumberIn=Laboratory Operatoion.NumberIn + 1: Laboratory Operatoion.WIP=Laboratory Operatoion.WIP+1; 456$ STACK, 1:Save:NEXT(428$); 428$
DELAY:
Uniform(30,60),,VA:NEXT(437$);
437$ TALLY: Laboratory Operatoion.TotalTimePerEntity,Diff.StartTime,1; 438$ TALLY: Laboratory Operatoion.TotalCostPerEntity, Diff.WaitCost + Diff.VACost + Diff.NVACost + Diff.TranCost + Diff.OtherCost,1; 461$ ASSIGN: Laboratory Operatoion.VATime=Laboratory Operatoion.VATime + Diff.VATime; 462$ TALLY: Laboratory Operatoion.VATimePerEntity,Diff.VATime,1; 466$ ASSIGN: Laboratory Operatoion.VACost=Laboratory Operatoion.VACost + Diff.VACost; 463$ TALLY: Laboratory Operatoion.VACostPerEntity,Diff.VACost,1; 476$ STACK, 1:Destroy:NEXT(475$); 475$ ASSIGN: Operatoion.NumberOut + 1:
Laboratory Operatoion.NumberOut=Laboratory Laboratory Operatoion.WIP=Laboratory Operatoion.WIP-
1:NEXT(15$); ; ;
21
; ; 15$
Model statements for module:
BasicProcess.Decide 4 (Checking the result)
BRANCH,
1: With,(50)/100,478$,Yes: Else,479$,Yes; 478$ ASSIGN: Checking the result.NumberOut True=Checking the result.NumberOut True + 1:NEXT(32$); 479$ ASSIGN: Checking the result.NumberOut False=Checking the result.NumberOut False + 1:NEXT(17$); ; ; ; Model statements for module: AdvancedProcess.Delay 14 (Result writting for the lab Prescription) ; 32$ DELAY: 2,,Other:NEXT(16$); ; ; ; ; 16$ 480$
Model statements for module: ASSIGN: DISPOSE:
BasicProcess.Dispose 7 (Pharmacy)
Pharmacy.NumberOut=Pharmacy.NumberOut + 1; Yes;
22