PERFORMANCE MEASUREMENT SYSTEM MECHANISMS AND SERVICE PROCESS TYPE AMIZAWATI MOHD AMIR* UNIVERSITI KEBANGSAAN MAL AYSIA NIK NAZLI NIK AHMAD MUSLIM HAR SANI MOHAMAD INTERNATIONAL ISLAMIC UNIVERSITY MALAYSIA
Abstract: The paper adds to the stream of Performance Measurement System (PMS) research with understanding the relationship between service activities and PMS design. Focusing on the association between service process types and the ways of measuring activities, the study provides a preliminary exploratory study on the practical aspect of PMS design. Using a combination of both survey and in depth interviews, the findings show that service type has insignificant relationship with choice of measurement mechanisms. Instead other factors, strategy, intensity of competition and size, determine the measurement approaches. More importantly, the results indicate that the PMS mechanisms of professional service firms are not much different from that of mass service firms. The evidence, thus, suggests that PMS is designed in a way that matches the organizational objectives rather than focuses on the uniqueness of service businesses. Keywords: Performance Measurement System; PMS mechanisms; service process type; professional services; mass services.
1.0
INTRODUCTION
A Performance Measurement System (PMS) is a management control tool that guides organizational efforts towards a specific objective and determines the success of the efforts through indicators of work performed and the result of activities (Otley, 1987; Neely, 1999). The system ensures the attainment of key success factors provides a scorecard, justifies the use of resources as well as providing feedback for driving future improvements. In implementing strategy, PMS continues to evolve to denote changes in the business environment and identifies ways to achieve those objectives (IFAC, 1998; Anthony & Govindarajan, 2007). The system should be tailored according to the requirements of individual organization and be constantly monitored the business performance. In addition, a PMS is also an instrument to facilitate an organizations’ decision-making, control, learning, communication and provides the motivation for individuals to perform at their best (Nanni, Dixon & Vollmann, 1992; Simons, 2000).
Amizawati Mohd Amir (School of Accounting, Economics and Business Faculty, UKM ; email:
[email protected])
At the same time, the intensified competition demands firms to compete on several levels simultaneously. Quality, knowledge, competence and reputations are among factors that are becoming critically important in developing competitive advantage (Nixon & Burns, 2005). Hence, a number of multidimensional PMS models have been developed in response to the growing needs for a sophisticated system that provides a broad scope of information such as the Results and Determinants Framework (RDF) for Performance Measurement in Service Businesses (Fitzgerald, Johnston, Silvestro & Voss, 1991), the Performance Pyramid (Lynch & Cross, 1991), Balanced Scorecard (Kaplan & Norton, 1992), and Kanji’s Business Scorecard (2002). Unfortunately, even though these frameworks are undoubtedly valuable, their adoption is often constrained by the fact that they are simply a framework, proposing the areas to be measured, but offer very little guidance on how to measure them (Neely, Mills, Platts, Richards, Gregory, Bourne & Kennerly, 2000). Obviously, having the right set of measures, without taking into consideration suitable mechanisms to operationalize them, is insufficient in designing an effective PMS. A number of researchers have emphasized that the benefits of the PMS framework are only realized when the organization is able to translate the measurement dimensions into actionable measures (Lillis, 2002; Tangen, 2004, 2005; Tuomela, 2005). Likewise, Neely et al. (2000) stress that for any framework to be of practical value; the process of operationalizing the framework should be really understood. Again, the issue is raised by Tangen (2005) who argues that the way activities are measured (i.e. measurement mechanisms) should be part of the PMS design agenda. Despite the concern, the literature is still silent. Therefore, in view of Tangen’s (2005) assertion, the study attempts to add to the limited knowledge in this area by exploring the variation in PMS mechanisms, focusing on the practices in service sector. Notably, PMS issues have been extensively explored in the manufacturing sector. Often the argument is to directly apply the same concepts, tool and techniques to the service sector. Besides a bias towards manufacturers, there are circumstances that the existing instruments fail to grasp due to uniqueness of service activities. For that reason, Anthony and Govindarajan (2007: 616) have argued that, “…management control in service industries is somewhat different from management control in manufacturing companies”.
As matter of fact the need to study service
organizations has been emphasized by a number of researchers (Brignall & Ballantine, 1996; Modell, 1996; Chenhall, 2003). Considering the limited work pertaining to the service sector, therefore, this study attempts to fill the gap by examining the significance of service activities in determining the measurement mechanisms.
2
Accordingly, the study offers several contributions to the service PMS design and management accounting literature. First, the exploratory investigation of the PMS mechanisms provides some guidance on how the appropriate measures can be introduced and ultimately used by service managers.
Second, the study explores the relevance factors in determining the
measurement mechanisms. Considering the deregulation affects the service sector generally, the study makes a contribution to the literature by examining the practices of a wider range of service industries
to
generate
generalizable
findings.
Rather
than
restricted
to
a
specific
organization/industry, the study removed the traditional perception that insists that each industry’s activities and problems are unique. Instead, the focus is on the commonalities that exist between them in facing the consequences of the services revolution. Finally, given the paucity of empirical investigation involving Malaysian service sector, this study attempts to fill the gap and contribute a meaningful PMS knowledge to the practitioners as the wave of liberalization requires Malaysian service firms to be controlled and managed effectively and efficiently. The remainder of this paper is organized as follows. Section 2 develops an understanding on service organizations, the PMS mechanisms, and the focus of the study. This followed by hypotheses development in Section 3. Section 4 discusses on the research method. The findings are presented in Sections 5 and 6. Finally the conclusion provides an overview of the most salient issues arising from the study.
2.0
SERVICE ORGANIZATIONS AND PMS MECHANISMS
2.1
SERVICE ORGANIZATIONS
The twentieth century witnessed a tremendous development of service industries. Economically, the term ‘service’ is often defined not by what it is, but rather by what it is not. Hence, economic reports used to identify activities as “service producing” that are not “goods producing” (Metters, King-Metters & Pullman, 2003).
Grönroos (1990: 27) provides a more detailed definition, “…a
service is an activity or series of activities of a more or less intangible nature that normally, but not necessarily, take place in interactions between the customer and service employees and/or physical resources or goods and/or systems of the service producer, which are provided as solutions to customer problems.” By this definition, services encompass a wide variety of industries, such as transportation, financial services, lodging, education, entertainment, telecommunications and an array of Internet-based services (WTO, 2005). Many service managers believe that each of these industries or sub-sectors is unique and shares little in common with other industries. But when such uniqueness and differences exist, little learning can take place (Lovelock, 1983). However, the basis of this study is the opposite
3
with the emphasis on the commonalities that exist between the services that distinguish them clearly from other sectors, which will also have implications for how to measure performance. Using Fitzgerald et al.’s (1991) service process model the previously disparate service industries are integrated and unified.
The model integrates the industries based on six measurement
dimensions a) equipment/people focus; b) contact time per customer; c) degree of customization, d) degree of discretion, e) value added back/front office, and; f) product/process focus. Viewed on a continuum, each of the dimensions poses an element of uncertainty in the control process, as controlling people-based firms such as consultancies may be different from equipment-based organizations such as freight services (Fitzgerald et al. 1991; Md. Auzair & Langfield-Smith, 2005). Positioned at the high end of the continuum, professional services require considerable judgment to meet customer needs, with most of the services tailored according to customer requirements. Whereas, mass services on the opposite end are relatively stable with most of the service products predetermined prior to customers’ participation in the service process. The variation in the operational conditions between both service types, thus, supports the claims that professional service firms are more likely to face higher task uncertainty as compared to mass services (Modell, 1997; Silvestro, 1999). Considering the lack of research on the significance of types of service businesses, involving a wider spectrum of services sectors, this study attempts to empirically examine the influence of service process type in designing PMS from a broader perspective. The question poses whether the service process types (i.e. professional services and mass services) have a significant effect in the design of service organizations’ PMS mechanisms.
2.2
PMS MECHANISMS
PMS mechanisms refer to the methods used to measure activities (Fitzgerald et al., 1991). Although service management theory argues that PMS design in service organizations are contingent upon the type of service operations, chosen strategies and intensity of completion, Brignall and Ballantine (1996) in their normative study propose that the measurement mechanisms in the service sector are highly determined by the type of service process. They argue that in professional services, for example, the emphasis is on the service quality of highly paid front-office staff, whereas in mass services the utilization of expensive equipment would be more important than that of staff, most of whom will be back-office staff. Using Fitzgerald et al. (1991) service process type model, Brignall and Ballantine (1996) suggest that there will be a significant difference in the way professional and mass services in measuring their activities Additionally, Fitzgerald et al. (1991), based on the Results and Determinants (RDF) framework,
4
postulate that the way of measuring differ significantly in measuring the determinants (i.e. service quality, flexibility, resource utilization and innovation), but not for measuring the result dimensions (i.e. competitiveness, financial performance). Yet, not many studies have attempted to address the issue, except a brief case study conducted by Fitzgerald et al. (1991). In view of these arguments, this study attempted to carry out a preliminary investigation to justify the validity of the proposed theory. Hence, extending Fitzgerald et al.’s (1991) observation, this study will provide empirical evidence by exploring the ways to measure each of the four determinants.
2.2.1
SERVICE QUALITY
Undoubtedly, it is easier to measure the quality of a tangible product than the quality of service. Evaluating the level of service quality is more elusive, and, thus, it is often described as the satisfaction of customer expectation (Parasuraman, Zeithaml & Berry, 1985).
Customer
expectations, however, involve lot of other things that relate to the service delivery process. The providers are expected to exercise their judgment in their respective positions, and behave appropriately. The behavioural notion consists of elements of friendliness, warmth, politeness, anticipation of customer needs, speed and communication both verbal and non-verbal. At the same time, location, size, the layout and reliability of the services are among other factors that influence customer expectation (Haywood-Farmer, 1988). Fitzgerald et al. (1991) encapsulate all these elements in their service quality dimension. The process is very subjective and, therefore, the quality of a service is very much contingent upon the customers’ own perceptions (McLaughlin & Coffey, 1990; Metters et al., 2003) Since quality is a comparison between customer expectation and actual performance, the information should come from the customers themselves. The evaluation can be done at various stages of the delivery process and involves both soft and hard measures. Soft measures are subjective measures that cannot easily be observed and must be collected by talking to customers, employees and others. Whereas, hard measures relate to those activities that can be counted, timed or measured through audit, such as, customer waiting time and number of complaints. In addition, quality measures also come from the internal source, generated by employees and management within an organization. The evaluation is to ensure that the level of performance does meet its own internal specification of quality (Silvestro, Johnston, Fitzgerald & Voss, 1990; Lovelock, Wirtz & Hean, 2002).
Possible mechanisms to measure service quality can be
structured and unstructured questioning of customers, as well as internally generated measures that can be formal such as staff appraisal or quality audit. However, professional service firms are expected to measure quality internally using formal approach and externally through
5
informal/unstructured customer interviews. Conversely, in mass services, the relationship between is more of between the organization and the customer, rather than between the staff and the customer. Thus, formal approach which includes well-structured surveys may be suitable to assess the service quality standard.
2.2.2
SERVICE FLEXIBILITY
Much of the literature on flexibility has been restricted to the analysis of manufacturing activities (Coffey & Bailly, 1991). The few studies on services describe service flexibility as the ability to which a service firm adjusts its service process to adapt to changes occurring in the market (Mills, 1986; Fitzgerald et al., 1991). In general, there are three different types of service flexibility that are volume, delivery speed and specification flexibility (Fitzgerald et al., 1991). The ability of a service provider to meet the fluctuation in demand explains the volume flexibility. However, the definition of volume differs across sectors. For example, a car rental service will consider the number of cars rented as the volume, while for a bank, volume refers to the number of transactions processed. Next, is delivery speed flexibility referring to the ability to respond to customer requirements in terms of speed or processing time, and, finally, the specification flexibility looks into the ability to meet individual customer requirements. The ability to be flexible, however, varies according to the nature of the service process. In people-based services, such as consultancy services, there tends to be greater scope for providing short-term flexibility compared to equipment-based services like car rental services. In a consultancy firm, the ability to reassign people to match the changes in demand can be implemented immediately to respond to customer requirements. However, in car rental services, adapting to different customer needs may result in changes in service design and even capital investment, which cannot be made in the short-term. Hence, the mechanisms should differ across the different types of service process ranging from immediate and temporary response such as hiring part-time workers to a longer-term decision such as investing in new technology (Fitzgerald et al., 1991).
2.2.3
RESOURCE UTILIZATION
Resource utilization is a dimension that evaluates how organizations efficiently utilize and transform resources into service values.
The concept that is rooted in the manufacturing
environment is often referred to as productivity (Fitzgerald et al., 1991; Grönroos & Ojasalo, 2004; Johnston & Jones, 2004). Despite the importance of this dimension in service activities,
6
little empirical work has been undertaken in this area. In fact, service productivity receives very little attention in management accounting literature. Traditionally, productivity measures the amount of output produced, relative to the amount of input used, with a constant value assumption. Given the nature of service operations, measuring service productivity is difficult, as the constant value assumption no longer holds. The problem may not be obvious in fast food services where the input and output are easily defined, but in other types of services, such as consultancy or legal services, this can be a problem. The service provider’s knowledge, experience, creative activity or ability to offer advice together with inseparable customer participation in the service delivery process complicates the process of measuring the input. Indeed, measuring the output is even more difficult as the output is hard to define. Some researchers argue that the quality for both the input and output is pertinent in service businesses and should not be treated in isolation (McLaughlin & Coffery, 1990; Nachum, 1999; Vourinen, Järvinen & Lehtinen, 2002). Meanwhile, other researchers argue that that the nature of service operations is an important consideration and thus suggests people-based services should be largely defined in terms of labour hour, while in equipment-based services will be determined by a mix of human and non-human resource utilization ratios (Fitzgerald et al., 1991). However, to capture the intangibility and variability of services input and output is not an easy task and poses a challenge in measuring service productivity. The difficulty to calculate the value of outputs or even the inputs leads to use of financial and non-financial measurement for service productivity. Nonetheless, Grönroos and Ojasalo (2004) strongly recommend that it should be financially measured, as this is the best way to encapsulate the quantitative and qualitative variation caused by the nature of service processes. Accordingly, service productivity may be measured as the ratio between total revenue (and/or revenue from a given service) and total costs (and/or cost of producing the service).
2.2.4 SERVICE INNOVATION Similarly, service innovation has also been largely neglected by management accounting researchers. Due to researcher bias towards product innovation, service innovation has hardly been examined (Miles, 2003). Despite the limited research in service innovation, Fitzgerald et al. (1991) have long recognized innovation as a key source of competitive advantage. Innovation is the development and implementation of new ideas and knowledge to meet the present and future marker requirements (Van de Ven, 1986; Fitzgerald et al., 1991). It can be a development of a totally new idea or a combination of a new and old one, which can improve the existing product
7
or services. In services, new ideas can be related to a product, a service or the process of service delivery. Although there is a lack of literature on process innovation, the importance of innovation has been acknowledged, as studies examine the relevance of MCS in controlling and coordinating product innovation activities. However, the current state of research displays a largely incoherent body of literature. Abernethy and Stoelwinder (1991) and Verona (1999) argue that the use of formal control in monitoring innovation hinders the development of new ideas. Ammabile (1998) reiterates that formal control demands results, which often kill rather than support the development of new ideas. However, other researchers, such as Otley (1999), perceive that MCS can actually stimulate innovation. Through MCS, managers can use the information to reduce uncertainties, while standards and procedures act as a means to block innovation excess and enhance effectiveness. The competing arguments lead to inconclusive decisions and, in fact, the empirical studies in the area (Davila, 2000; Bisbe & Otley; 2004) present contradictory conclusions. In relation to PMS, a prior study finds that both financial and non-financial measures are equally likely to be used in measuring innovation activities (Davila, 2000).
In addition,
Fitzgerald et al. (1991) strongly suggest that the measurement should encapsulate the result as well as the performance of the innovation process that could be measured along three dimensions: cost, effectiveness and speed of the innovation process.
3.0
SERVICE PROCESS TYPE AND PMS MECHANISMS
There is a growing concern that there is limited guidance on how to measure or operate the measurement systems. Tangen (2004, 2005) argues that performance measurement designs are simply frameworks with a strong academic and philosophical basis. To benefit from these frameworks managers have to translate the measurement dimensions or perspectives into actionable measures, which is not easy (Otley, 1999; Lillis, 2002; Tuomela, 2005). As proposed by Fitzgerald et al. (1991) and Brignall and Ballantine (1996), the service process type is the main factor that explains how performance will be measured, which is expected to differ between the process types.
Since the process type will certainly vary between service businesses, the
consequences will be on measurement mechanisms. Taking this factor into consideration, the present study attempts to test the theory as an exploratory research on a much broader view. Based on the earlier discussion, the following hypothesis is suggested: H1:
PMS mechanisms will be different between professional service and mass service firms.
8
4.0
RESEARCH METHOD
The study combined both quantitative and qualitative methods (i.e. use of questionnaire surveys and a series of post-survey interviews). The data collection process started with the surveys, while the interviews commenced immediately after analyzing the survey responses. In line with the objective of the present study to establish generalized findings of PMS mechanisms in service organizations, greater emphasis was placed on the questionnaire survey.
4.1
SURVEY METHOD
4.2.1
SAMPLE
The sampling frame for this study was private service firms operating in Malaysia, based on data provided by the Department of Statistics, Malaysia and the Central Bank of Malaysia. An extensive search of directories/portals was then undertaken to compile the mailing list for every service sector. Samples were randomly selected from the lists. The unit of analysis was either an independent service firm or a core business unit depending upon the size of the firm, similar to Chenhall (2005). Survey data was collected by administering a mail questionnaire survey to top management of service firms or general managers of strategic business unit of 1000 service organizations operating in Malaysia. The respondents were chosen as they are in positions with the most comprehensive knowledge of PMS in the organizations. Of these, 121 companies (12%) sent complete responses. 92% of the respondents were local-owned firms, while foreign firms were only 6.7% and 0.8% was a combination of both. Respondents covered a variety of service sectors representing the diversified service industry. Table 1 presents the profile of responding firms by sector, age and number of employees.
Table 1 Profile of the Responding Firms
Service activities Computer & related services Consumer banking Corporate banking Education Health services Hotels Insurance Post and telecommunication
Frequency
%
11
9.2
8 6 14 9 15 9 8
6.7 5.1 11.8 7.6 12.6 7.6 6.7
9
Professional (i.e. accounting, consultancy, engineering, legal firms) Restaurants Transportation Wholesale and Retail Trades Total Missing Total
3 11 12 119 2 121
2.5 9.2 10.1 100.0
Ages of service firms 10 years and below Between 11 to 20 years Between 21 to 30 years Above 30 years Total Missing Total
46 28 22 17 113 8 121
40.7 24.8 19.5 15.0 100.0
45 8 6 60 119 2
37.8 6.7 5.1 50.4 100.0
Total number of employees Below 100 Between 100-149 Between 150-199 200 and above Total Missing Total
4.2.2
13
10.9
121
MEASUREMENT OF VARIABLES
Service Process Type was measured using Fitzgerald’s et al. (1991) six-measurement scheme that Md. Auzair and Langfield-Smith (2005) reconstructed into survey questions. A seven-point scale was used, with one indicating a greater emphasis on mass services, and seven indicating a greater emphasis on professional service process. When subjected to factor analysis, all items were equally divided and loaded on two components. Although all loadings were higher than 0.50, the reliability of the second component, comprising equipment/people focus, level of customization and discretion, was below 0.5 and therefore excluded from further analysis (refer to Table 2). The classification of service process type, thus, was based on length of contact time per customer, value added back/front office and product/process focus, with a Cronbach alpha of 0.592. PMS mechanisms were measured using a 40-items instrument, which was partly based on, Fitzgerald et al. (1991) discussion on service quality and flexibility measurement mechanisms. In an attempt to increase the generalizability of the findings, the study transformed Fitzgerald et al.’s
10
(1991) qualitative findings into seven-point Likert scale questions where managers were asked to identify to what extent a particular mechanism was implemented in their firms, ranging from “not at all” (1) to “intensively” (7) use of the identified techniques. Meanwhile, reviews of literature in related disciplines, such as service operations management and management science, were undertaken to identify the recent measurement techniques associated with the four RDF determinants, including productivity and innovation dimensions.
Additional measures were
adapted from Edgett and Snow (1997) and U.K. 2005 R&D Scoreboard to form the survey questions.
However, only common measurement mechanisms were listed as the possible
responses as the aim of the measurement was not to identify the mechanisms. Instead the aim of the study was to test whether there is a significant difference between professional and mass service measurement mechanisms.
TABLE 2 Summary results of factor analysis Variables Service Process Type Product/process focus Short/long term contact Back/front office
# of items n/a
Eigenvalue % of Variance Cronbach Alpha 1.653
55.097
0.592
61.776
0.888
PMS Mechanisms Service Quality Mechanisms
7
4.324
Service Flexibility Mechanisms Short-termism capacity Longer-termism capacity Temporal flexibility Functional flexibility
3 3 2 4
2.244 2.222 2.149 2.058
Resource Utilization Mechanisms Efficiency of internal capacity Labour productivity
4 2
2.539 1.858
Service Innovation Mechanisms Services acceptance Knowledge creation
3 3
2.217 1.984
72.278 0.782 0.753 0.926 0.705 73.293 0.825 0.792 70.022 0.807 0.710
Accordingly, the survey divided into four sections with each section measuring a specific dimension (refer to Appendix):
11
a) Service quality mechanisms- the study conceptualized quality mechanisms with regard to generating service quality information from internal and external sources. All items loaded onto one factor with a Cronbach alpha of 0.888. b) Service flexibility mechanisms- service flexibility was defined as the ability to respond to changes in service specifications or demand. Capacity flexibility and labour flexibility are the two major sources of flexibility (Fitzgerald et al., 1991). Accordingly four components were extracted during factor analysis (refer Table 2). Three items were loaded on Factor 1 and Factor 2, which reflected the capacity flexibility. Factor 1 reflected the decision or ability to be flexible in the shorter period with relatively less investment compared to approaches loaded on Factor 2. Thus, Factor 1 could be labelled as ‘short-term capacity approach’ and Factor 2 as ‘long-term capacity approach’. Meanwhile, Factor 3 and Factor 4 dealt with flexibility in labour. Factor 3 encompassed part-time and temporary workers, which could be interpreted as ‘temporal flexibility’.
Whereas, Factor 4 was more of
‘functionality flexibility’ by which the same employees were responsible for a variety of tasks. The Cronbach alphas for all four factors were above 0.70 indicating satisfactory internal reliability of the scales. c) Service resource utilization mechanisms- resource utilization mechanisms looked into firms’ choices of measuring the efficiency and effectiveness of input and output in their service delivery processes. Six items were factor analyzed that loaded onto two factors, ‘efficiency of internal capacity’ and ‘productivity of labour’ (refer to Table 2). The Cronbach alphas were 0.825 and 0.792 respectively. d) Service innovation mechanisms- service innovation defined as a process that includes generation, development or improvement in a product, a service or delivery process (Fitzgerald et. al. 1991). The roles of PMS are to monitor and measure the development and adoption of innovations (Damanpour, 1996). Focusing on the measurement mechanisms, hence, two potential alternatives to support the measurement of firms’ innovative actions were identified (refer Table 2). Factor 1 signified the measures on the implementation or acceptance of an innovation, while Factor 2 concentrated on the elements of knowledge. Hence, “service acceptance measure” and “knowledge creation” could describe how innovation would be practically monitored or measured.
The scales also reported high
internal reliability with Cronbach alphas of 0.807 and 0.710 respectively.
Descriptive statistics for the variables in this study are presented in Table 3.
12
Table 3 Descriptive statistics
Variables Service Process Types PMS Mechanisms Service Quality Short term capacity Long term Capacity Temporal flexibility Functional flexibility Internal capacity efficiency Labour productivity Service acceptance measures Knowledge creation 4.2.3
Theoretical range 1-7
Actual range 2.33-6.67
Mean
S.D.
4.592
1.063
1-7 1-7 1-7 1-7 1-7 1-7 1-7 1-7 1-7
2.29-7.00 2.33-7.00 1.00-7.00 1.00-7.00 2.75-7.00 3.00-7.00 2.50-7.00 3.67-7.00 3.33-7.00
5.030 4.546 3.731 3.767 4.964 4.888 5.038 5.340 4.991
0.982 1.079 1.698 1.731 0.982 0.961 1.091 0.899 0.870
RESULTS
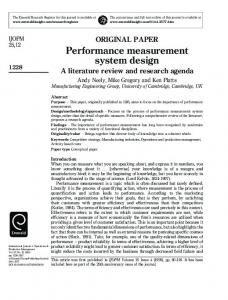
The service process types were classified into sets of similar group using cluster analysis. Using a two-step cluster analysis the optimal or “best number” of clusters is automatically determined. The objectives of this technique are to minimize within cluster variation and maximize between cluster variations. Consistent with Md. Auzair and Langfield-Smith’s (2005) classification of service process type, Table 4 shows that the service process types were successfully clustered into two service groups, i.e. professional and mass services. The means of professional and mass services were 5.59 and 3.83 respectively, presenting a clear distinction between the two service process groups (refer to Figure 1). The error-bar chart graphically displays the distribution and means of the two service types at 95% confidence interval TABLE 4 Distributions of service process types Std. Frequency Percent Mean Deviation Cluster Professional Service 52 43.3% 5.5897 .50967 Mass Service 68 56.7% 3.8284 .66789 Combined 120 100.0% 4.5917 1.06332 Excluded Cases 1 Total 121
13
Simultaneous 95% Confidence Intervals for Means Service Process Types
6.0 5.5 5.0 4.5 4.0 3.5 N=
52
68
P rofessional
M ass Services
Cluster Reference Line is the Overall M ean = 4.59
Figure 1
Classification of service process type
Subsequently, the hypothesized relationship was examined using t-test analysis. The adequacy of the data was assessed by testing for the normality, homogeneity of variance of residuals and the appropriateness of the linear models. The results indicated that the inherent assumptions of the model used were validated.
HYPOTHESIS TESTING A series of independent t-tests were undertaken to examine the variation in the level of emphasis on each component of measurement mechanisms, between professional and mass services. Concentrating on the four RDF determinant dimensions (Fitzgerald et al., 1991) the hypothesis was tested.
The results of the t-tests are presented in Table 5.
The comparison between
professional and mass services shows that only the mechanism in supporting services long-term flexibility capacity presents a significant difference between professional and mass services (p